
CSO publication, 28, 11am
The EU regulation concerning Short-Term Statistical indicators (STS) of economic activities1 requires that sectoral weights for the Producer Price Index (PPI) be updated from 2015 to 2021 in 2024 to reflect changes in the structure of the economy. This article introduces the updated Wholesale Price Index (WPI) to base 2021 as 100 for the publication of the October 2024 release in November 2024. It replaces the former Wholesale Price Index series which was introduced in 2018 to base 2015 as 100.
The same system of price indices used in the Base 2015 as 100 series is continued, namely:
(i) Manufacturing Industries Output Price Index (Table 1) which contains the overall Manufacturing Industries Output Price Index as well as breakdown by Home and Export Sales.
together with separate series of:
(ii) Industrial producer price indices classified by NACE2 + sector (Table 2);
(iii) Wholesale price indices for building and construction materials (Table 3);
(iv) Wholesale price indices for capital goods (Table 4);
(v) Wholesale price indices for energy products purchased by manufacturing industry (Table 5).
Tables 1 and 2 present the rebased Producer Price Indices as required by the STS regulation. Tables 3, 4 and 5 have also been rebased to 2021=100 for consistency.
Without any methodological changes, a rebase of an index typically involves:
However, for this new 2021 = 100, we have taken the opportunity to improve the methodology used to create the indexes.
The new series – official from October 2024 released in November 2024 – has been backdated to provide an overlapping period covering January 2021 to September 2024. These series have been calculated January 2021 to September 2024 using the new weights. They are not used as the official backdated series as the percentage changes reported differ from those already officially published for the period prior to September 2024. They are useful, however, as they highlight the effect of the new weights on the series when compared to the official backdated series.
Rescaling calculation: Users may wish to rescale older series to allow comparison with the latest data. To rescale a series, first calculate the mean index in the older series over the 12 months in 2021. The scaling factor is then
  . The series can be rescaled by multiplying each index by this rescaling factor.
The Wholesale Price Index is compiled by the CSO and is normally issued through the CSO website within 4 weeks of the month to which it relates.
The industrial producer price index for a sector measures, in index form, changes in prices received by Irish manufacturers for goods fully or partially produced in Ireland and sold to the home and export markets by that sector. The other wholesale price index series incorporate imported and home-produced goods sold by manufacturers and wholesale outlets. All constituent series are compiled using a Jevons index formula at the lowest level, and a Laspeyres type index at higher levels. In almost all cases, identical items are priced each month so that changes in the cost of this constant basket reflect price changes only.
The indices are used by economists and expert users to evaluate and analyse developing price trends and as an indication of inflationary processes in the overall economy. The indices are used within the CSO for deflation purposes (e.g. deflation of the indices of production by National Accounts). The industrial producer price index (Table 2) is used by Eurostat3 as a measure of short- and medium-term economic activity of the individual Member States of the EU and of the Union as a whole. The indices are also used in contracts by the building and construction industry as a measure of allowable price increases or decreases over the term of these contracts (i.e. elements of a contract price can be linked to the relevant index within the WPI).
Since its introduction in 1938 the WPI has been updated several times:
(i) Index with base October 1938 as 100
The monthly General Wholesale Price Index was introduced in the Irish Trade Journal and Statistical Bulletin in June 1946 and was the first official index of wholesale prices compiled for the State. Weights for commodities were based on their exchange value (i.e. sales value) during 1936. Difficulties were experienced in establishing a base period due to abnormal production patterns during the 1939 to 1945 war years. Approximately 1,050 price quotations were used in all. Data was collected for both home-produced and imported goods and indices were classified by 9 commodity groups.
(ii) Index with base 1953 as 100
The second series was introduced in the March 1955 issue of the Irish Trade Journal and Statistical Bulletin. It was compiled for each month beginning with January 1954. The weights were based on 1950 Census of Industrial Production4, external trade and agricultural output data. Approximately 2,380 price quotations were collected in all, and indices were calculated and published for 12 commodity groups. As opposed to the ‘exchange’ principle previously used, an ‘Economic Flow’ principle was then adopted in the development of weights and commodity groups. Under this system transactions between members of the same sector were ignored – i.e. only transactions external to the sector were used in the index calculation.
(iii) Index with base 1975 as 100
A major canvassing operation preceded the introduction of the third wholesale price index series which was introduced in the March 1978 issue of the Irish Statistical Bulletin. The number of price quotations had increased to 3,300 and the number of sectors for which indices were published was expanded from 12 to 24. Several major changes were made to the structure of the index. The NACE 70 classification system was adopted, and the main thrust of data collection was now the collection of output prices for Irish Manufacturers. The published data focused more on the ‘Output of Manufacturing Industry’ as opposed to the General Wholesale Price Index (although this index was retained). New tables for Building and Construction Materials and Capital Goods Price Indices were introduced. Much of the formatting and methodology introduced in this series has been retained up to the current series.
(iv) Index with base 1985 as 100
The fourth series was introduced in September 1989. Weights for industrial producer price indices were based on 1985 Census of Industrial Production4 figures. Canvassing to improve coverage was again a major feature of the updating programme and at this point more than 4,000 price quotations were being collected. The methodology and format of the 1975=100 series were retained. By this time a new table for Energy Products Purchased by Manufacturing Industry had been introduced.
(v) Index with base 1995 as 100
This series was introduced in March 2002 with the publication of the January 2002 index. This series incorporated a number of technical changes as well as an updating of weights, sample of companies surveyed, and products priced. The coding for the producer price indices was updated from NACE 70 to NACE Rev.1. The EU Prodcom5 coding system was introduced for commodity groupings. The weights were updated to 1995 levels from several sources, notably the 1995 Census of Industrial Production, 1995 Prodcom Inquiry and National Accounts data.
(vi) Index with base 2000 as 100
This series was introduced in March 2003 with the publication of the January 2003 index. This series incorporated a number of technical changes as well as an updating of weights, sample of companies surveyed, and products priced. The coding for the producer price indices was updated from NACE Rev.1 to NACE Rev.1.1. The weights were updated to 2000 levels from several sources, notably the 2000 Census of Industrial Production, 2000 Prodcom Inquiry and National Accounts data.
(vii) Index with base 2005 as 100
This series was introduced in June 2010 with the publication of the April 2010 index. This series incorporated a number of technical changes as well as an updating of weights, sample of companies surveyed, and products priced. The coding for the producer price indices was updated from NACE Rev.1.1 to NACE Rev.2. The weights were updated to 2005 levels from a number of sources, notably the 2005 Census of Industrial Production, 2005 Prodcom Inquiry and National Accounts data.
(viii) Index with base 2010 as 100
This series was introduced in October 2013 with the publication of the September 2013 index. This series incorporated a number of technical changes as well as an updating of weights, sample of companies surveyed, and products priced. The weights were updated to 2010 levels from a number of sources, notably the 2010 Census of Industrial Production, 2010 Prodcom Inquiry and National Accounts data.
(ix) Index with base 2015 as 100
This series was introduced in March 2018 with the publication of the February 2018 index. This series incorporated a number of technical changes as well as an updating of weights, sample of companies surveyed, and products priced. The weights were updated to 2015 levels from a number of sources, notably the 2015 Census of Industrial Production, 2015 Prodcom Inquiry and National Accounts data.
Price quotations are collected in a monthly inquiry. The methods of data collection are postal survey, email, phone, electronic questionnaire (eQ), and the CSO’s Secure Deposit Box response system. The updated system is currently based on approximately 4,000 monthly price quotations provided by a panel of some 775 respondent firms. The CSO wishes to express appreciation to all respondents for their co-operation. The price quotations relating to individual concerns are treated as strictly confidential and are not divulged in an identifiable form by the CSO to any other Government Department or outside body.
Each month customised survey forms are sent to respondent firms. These incorporate the detailed specifications of the representative selection of products to be priced. Actual transaction prices are sought.
The price sought is the price invoiced to customers for an item on the 15th day of the month (i.e. mid-month):
Pricing procedures are strictly based on the principle that identical items must be priced by respondents on each occasion (i.e. matched basket approach). If discontinuities occur, such as an item becoming unavailable, respondents are asked to price a suitable replacement product. Generally, the price of a new product is excluded from the index calculations until two consecutive monthly quotations are obtained for the substitute. Where replacement products are excluded from the month’s calculations the price trend for all other products in that product group is taken as the price trend for the product excluded. Indirectly, by doing this, a valuation is put on any quality change. This is known as an indirect or implicit method of quality adjustment.
For certain products in sectors that have a high impact on the overall index, an alternative method of quality adjustment is used. In these cases, product specifications from old and new products are compared to estimate the proportion of the price change that is due to differences in quality between the two products. This proportion of the price change is then excluded from the price index calculation, allowing a quality adjusted price change between the new and replacement products to be included in the index.
The lowest level of the WPI calculation uses the Jevons index formula. This is a change introduced for Base Year 2021 = 100. The lowest level calculates the index for all prices of the same product group for one respondent. The 2015 series used the weighted Laspeyres index formula, where the weights were the revenue shares for individual products estimated by the respondent. The Jevons formula treats all the products for a respondent within a product group equally.
A weighted Laspeyres formula requires consistently high-quality information from each respondent for the relative split of their products. As these can evolve over time, the information provided to the CSO could be misleading. The Jevons formula avoids this burden on respondents.
The Jevons index is defined as:
The value pit refers to the price of product i at time t, while and pi0 is the price of product i in the price reference period. In the 2021 as 100 series, the price reference period is December 2020. n is the number of products the respondent supplied prices for within the product group. In practice the chained version of the Jevons formula is used. This is explained in the next section.
The WPI indices at all higher levels of aggregation are compiled using a variant of the fixed weighted Laspeyres index formula. The Laspeyres index for these higher levels of aggregation is defined as:
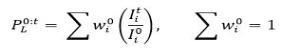
The value Iit refers to the price index of aggregate i at time t, while Ii0 is the price index of aggregate i in the price reference period. In the 2021 as 100 series, the price reference period is December 2020. The weights wi0 are the revenue shares for individual aggregates in the weight reference period. While the objective is the calculation of a Laspeyres index, where the price and weight reference periods are the same, in practice the index takes the form of a Young index (see below). In a Young index, the weight reference period may be different from the price reference period due to time lags in data availability.
Note that indices included in the WPI release are expressed in the standard form where a value of 100 means that there is no change in the index between the current and base periods.
Also, in practice the chained version of the Laspeyres formula is used. This is explained in the next section.
The Jevons and Laspeyres formulae above are direct indices i.e. they compare prices or indices in the current period to those in the reference period. Direct index calculations require the same sample to be used during the current and reference period. In practice, products and respondents are dropped from the index over time and new products and respondents introduced. Using a direct index reduces the data available for the index to the subsample which is present in both the current and reference time periods.
An alternative to a direct index is a chain index. In a chain index, each link in the chain is calculated by comparing the prices in the current period to those in the previous period. While sample changes over the full length of the series can be large, only a small number of products or respondents will change between two subsequent time periods. Using a chain index minimises the reduction in usable data due to sample changes.
The chained version of the Jevons index is:
And then
The direct and chained version of the Jevons formula give the same answer if the respondent supplies prices for the same products within a product group from the reference period to the current period.
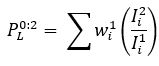
For the Laspeyres index the chain links are chained together to obtain a long-term index by updating the quantities used to weight the price relatives each month as shown below. In the first month, the chain index calculation is the same as the direct index:

For each unit i, the calculation  gives an “updated value” for i, i.e. its weight in the reference period updated by the relative
  or the price change between period 1 and period 0. Denoting these updated values as wi1, the index for the second month is calculated as:
Again, the updated values 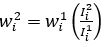 are used to weight the relatives in the subsequent month:

And in general, the index at time t is given by:

Where the sample remains the same, the chain index equals the direct index. For example, at time t=3:

To compile the WPI indices, first the price indices of the lowest level elementary aggregates are calculated. Then weighted averages of these elementary price indices are used to obtain higher-level indices. The calculations are done in several stages reflecting the hierarchical structure of the WPI.
In practice the method of compilation of the indices means that base period commodity values are progressively updated each month and the price indices are derived by dividing the aggregate current monthly value by the corresponding base period value.
(i) Each elementary aggregate is a product group for a single respondent. Elementary price indices are calculated for these elementary aggregates. The elementary price index is a chained month-to-month Jevons index as described above. Only products which have prices in both the current and previous month are included in the calculation.
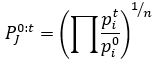
(ii) The elementary aggregates are used to calculate price indices at the product group level. A weighted average of the price indices of different respondents within each product group is calculated where the weights are the share of sales recorded by each respondent in that product group. These weights are estimated from responses to CSO surveys. This weighted average calculation is a Young index. The general formula for a Young index is:
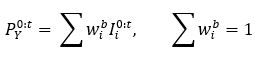
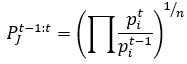
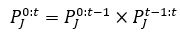
Here, PY0:t is the product group index for time t, the sum Σ is over all respondents within a product group, Ii0:t is the elementary price index for respondent i in the product group, and wib is the weight of the respondent in the product group in period b, which typically precedes the reference period 0. In the WPI, a chained Young index is used instead of a direct index, for the same reasons as described above for the Laspeyres index. The chained version of the Young index, which is equivalent to the direct Young index where the sample remains the same, is given by:

Ii0:t-1 is the elementary price index for respondent i in the product group in the previous period, while Iit-1:t is the month-on-month index comparing the current to the previous period. This month-on-month index is the ratio of the indices for period t and t - 1.
(iii) A weighted average of month-on-month product group price indices within a NACE group (3-digit NACE) is used to calculate NACE group price indices. The calculation is a chained Young index as detailed in the previous step, where the indices Iit-1:t are the month-on-month product group price indices. The weights wib are the relative proportions of each product group within the corresponding NACE group.
(iv) A weighted average of month-on-month NACE group price indices within a NACE division (2-digit NACE) is used to calculate NACE division price indices. The calculation is a chained Young index as detailed previously, where the indices Iit-1:t are the month-on-month NACE group price indices. The weights used are the relative proportions of each NACE group within the corresponding NACE division.
(v) Other higher-level aggregates are calculated as weighted averages of NACE group price indices using the same method. Again, the calculation is a chained Young index, where the indices Iit-1:t are the month-on-month NACE group price indices. The weights used are sums of the corresponding weights from the lower levels of aggregation.
(vi) Certain indices are calculated on a net sector basis. This means that sales from one industry in a sector to another industry in the same sector are excluded from the weighting calculations. This is to prevent double counting of price changes as products flow through different production processes.
(vii) To get the final Base Year Indices at NACE group, NACE division and other levels of aggregation, the base period indices are rescaled by dividing by the mean of the corresponding 12 monthly indices during 2021.
The WPI compilation process is illustrated by the chart in Appendix 1.
1 COUNCIL REGULATION (EC) No 2019/2152 of 27 November 2019 concerning business statistics (Official Journal L 327,17/12/2019).
2 NACE Rev.2 Statistical classification of economic activities in the European Community.
3 Statistical Office of the European Union.
4 The Census of Industrial Production is a detailed annual survey which records a range of data re the activity of manufacturers in Ireland.
5 Prodcom (Production sold/Commission work done) is an annual survey, published by the CSO, recording the value of output/work done by industrial firms.