
CSO statistical release, 20 October 2021, 11am
Online ISSN 2009-681X

CensusAtSchool is an online educational project that takes place every year with the aim of bringing statistics to life in the classroom. Schools are invited to participate on a voluntary basis. Supervised by teachers, students connect to the internet using a variety of digital devices and answer questions about their lives and opinions. The data is then collated and made available for class exercises on the Census at School website so that students can see the real-life relevance of statistics.
From an estimated 379,183 secondary school students, 1,198 (0.3%) students completed the Phase 20 questionnaire of the CensusAtSchool survey. It was available to students and schools between September 2020 and June 2021. The Phase 20 questionnaire covered a variety of topics including:
Please note: the CensusAtSchool survey is voluntary. It is not part of a representative sampling process. As representative sampling process was not used to gain responses to the survey, the results of the survey are not reliable in providing inferences about the overall secondary school student population. Comparisons with international data are also not representative.
Students were asked questions around ’Irishness’ and Irish culture. The table below ranks the one word students associated with being Irish.
| Rank | One word to describe being Irish |
|---|---|
| 1 | Proud |
| 2 | Fun |
| 3 | Friendly |
| 4 | Good |
| 5 | Great |

Students were asked if they spoke Irish and the frequency they spoke it. For those students who said they spoke Irish, almost 5% of students said they spoke Irish daily and 68% said they never spoke it outside of school. See Figure 1.
| X-axis label | Frequency Irish is spoken |
|---|---|
| Yearly | 9 |
| Weekly | 11 |
| Never outside school | 68 |
| Monthly | 8 |
| Daily | 5 |

It was also great to see that 45% of students got the month for the next Irish Census correct, which is taking place in April 2022.
Students were asked about how they travelled to school and how long it usually took. Travelling by car was the most popular mode of transport at 46% followed by taking the bus at 32%. The average time it took students to travel to school was 17 minutes. See Figure 2.
Please note data may not add to 100% due to rounding issues.

The question on how students travelled to school was also asked in 2013 and 2016. We compared the results in the table below.
| CAS 2013 | CAS 2016 | CAS 2021 | |
|---|---|---|---|
| Car | 47% | 44% | 46% |
| Bus | 27% | 27% | 32% |
| Walk | 21% | 20% | 17% |
| Answer | |
|---|---|
| Bus | 32 |
| Car | 46 |
| Cycle | 2 |
| Other | 1 |
| Walk | 17 |
Every year the CensusAtSchool questionnaire asks students to take different measurements such as the circumference of their wrist, height and arm span.

We compared the average height of 1st Year students to the Transition Year students for both sexes. Male 1st Years average height at 1.63m is 4cm taller than female 1st Years at 1.59m, the difference has grown to 12cm in the Transition Year students. See Figure 3.
| X-axis label | Male | Female |
|---|---|---|
| 1st Year | 163 | 159 |
| Transition Year | 177 | 165 |
Students were asked a range of questions around internet connectivity and mobile apps. An interesting question asked students which application they would choose if they could only have one on their phone.

Snapchat was the clear winner at 38%, with Facebook coming in at less than 1%. Snapchat was also the students most popular method for communicating with their friends at 39%, followed by in-person at 21%. See Figure 4.
| Answer | |
|---|---|
| 7 | |
| 8 | |
| Other | 18 |
| Snapchat | 38 |
| TikTok | 11 |
| 7 | |
| YouTube | 11 |
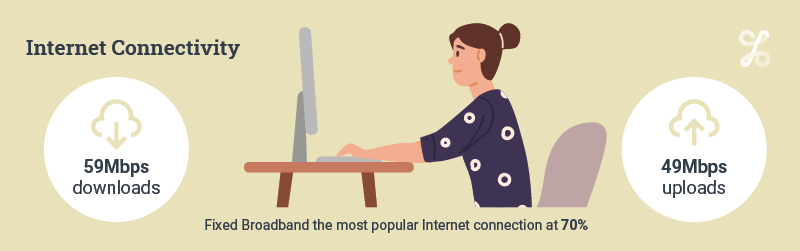
The graph below shows the breakdown of how students connect to the internet at home, with fixed broadband being the most popular at 70%. The average download speed students achieved was 59Mbps (Megabits per second) and upload speed was 49Mbps. Most students tested their broadband speed on a Tuesday. See Figure 5.
| X-axis label | Type of internet connectivity |
|---|---|
| Satellite | 8 |
| Other internet connection | 7 |
| No internet connection | 1 |
| Mobile broadband (e.g. 3G/dongle) | 14 |
| Fixed broadband | 70 |
Running/Walking tops the list of fun pastimes students engaged in during lockdown, with baking a close second.
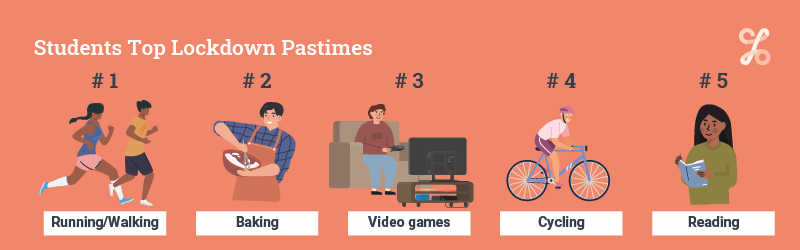
| Rank | Fun pastimes during lockdown 2020 |
|---|---|
| 1 | Running/Walking |
| 2 | Baking |
| 3 | Video games |
| 4 | Cycling |
| 5 | Reading |
Students ranked on a scale of 1-100 how they felt their learning suffered due to home-schooling during lockdown, 1 being the least affected with 100 most affected. The results were grouped into quartiles which are illustrated in the graph below. 21% of students felt their learning suffered greatly (very high effect- highest quartile) during lockdown. See Figure 6.
| X-axis label | Lockdown effect |
|---|---|
| Low effect | 28 |
| Medium effect | 22 |
| High effect | 29 |
| Very high effect | 21 |

Students were also asked about their preference for online learning, again on a scale of 1-100. 42% of students selected a value of 50 or over for their preference for online learning.
Students were also asked questions around exams and alternative assessments.
Most students felt it was a good idea to cancel the exams last year, with 76% choosing this option. There was also good correlation between male and female students on this issue, with 75% of females and 77% of males feeling exam cancellation was the correct choice. See Figure 7.

56% of students felt that exams were not a fair way to be assessed and when asked how they would like to be assessed 59% favoured a continuous assessment or project-based approach.
| Answer | |
|---|---|
| Correct decision to cancel | 76 |
| Incorrect decision to cancel | 24 |
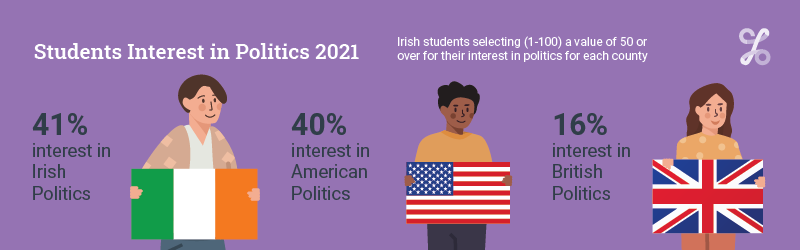
Interest in politics was mixed with 41% of students selecting (scale 1-100) a value of 50 or over for their interest in Irish politics, closely followed by 40% selecting a value of 50 or over for interest in US politics. Student's interest in British politics lagged significantly behind with only 16% selecting a value of 50 or over here.
Students were asked where they might achieve fame in 2035. Politics didn’t fair great here at 4% with most students feeling sport was their best chance to achieve fame at 27%.

| X-axis label | Area in which fame could be achieved |
|---|---|
| Science | 5 |
| Engineering | 8 |
| Innovation | 3 |
| Art & culture | 16 |
| Medicine | 6 |
| Business | 14 |
| Politics | 4 |
| Sport | 27 |
| Other | 18 |
CensusAtSchool is a non-profit making international project. It is funded by organisations interested in promoting good use of statistics, mathematics and data handling. Ireland became involved in CensusAtSchool in 2009. Four Irish bodies are collaborating in this project:
The Irish website, www.censusatschool.ie, has been in place since 2009.
The Royal Statistical Society Centre for Statistical Education (RSSCSE) started the CensusAtSchool project in 2000 in conjunction with the Office of National Statistics (ONS) in the United Kingdom. The project, originally planned as a one-off survey, was linked to the UK population census of 2001. It has now developed into a dynamic, ongoing and exciting initiative being conducted in several countries. Further information on its operation in countries can be found here:
1,198 secondary school attendees from 95 secondary schools completed the Phase 20 questionnaire of the CensusAtSchool survey between September 2020 and June 2021. Because the survey voluntary and is not part of a representative sampling process, the results of the survey are less reliable in providing inferences about the overall secondary school student population.
The CensusAtSchool Phase 20 questionnaire and more results from the survey can be found on the CensusAtSchool website at CensusAtSchool Questionnaire
Email: Information@cso.ie