
CSO statistical release, 21 October 2019, 11am
Online ISSN 2009-681X

CensusAtSchool is an online educational project that takes place every year with the aim of bringing statistics to life in the classroom. Schools take part voluntarily. Supervised by teachers, students use a variety of digital devices that are connected to the Internet to answer 30 questions about their lives and opinions. The data is then collated and made available for class exercises, so that students can see the real-life relevance of statistics.
From an estimated 362,000 secondary school students, 1,417 (0.4%) students completed the Phase 18 questionnaire of the CensusAtSchool survey. It was available between September 2018 and August 2019. The Phase 18 questionnaire covered a variety of topics including:
Please note: This survey is voluntary. It is not part of a representative sampling process. Hence, the results of the survey are less reliable in providing inferences about the overall secondary school student population.

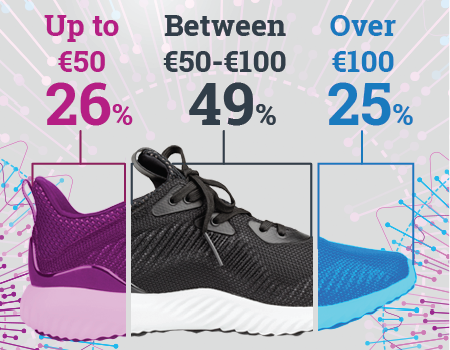
Students were asked about the types of footwear they own and the cost and colour of their last pair of trainers. Three in four students spent less than €100 on their last pair of trainers (75%) while less than one in twenty students spent over €200 on their last pair of trainers (4%).
The most popular type of shoe with students are trainers, with over half of students owning at least three pairs of trainers (56%). Wellies are the least popular, with only 45% of students owning at least one pair. See Figures 1 and 2.
| No Pairs | 1 to 2 pairs | 3 to 4 pairs | Over 4 pairs | |
| Trainers | 1 | 43 | 34 | 22 |
| Shoes | 6 | 54 | 25 | 15 |
| Boots | 30 | 56 | 12 | 3 |
| Sandals | 43 | 45 | 9 | 3 |
| Wellies | 55 | 42 | 2 | 1 |
| Other Footwear | 53 | 32 | 9 | 5 |
| X-axis label | Trainers | Wellies |
|---|---|---|
| No Pairs | 1 | 55 |
| 1 to 2 pairs | 43 | 42 |
| 3 to 4 pairs | 34 | 2 |
| Over 4 pairs | 22 | 1 |

Students were also asked various questions on languages including which languages they can hold conversations in and languages which they would like to learn. They were also asked which reasons would encourage them to learn languages and also the downsides to learning languages.
Of the students that do speak Irish, almost three in five never speak Irish outside of school (59%). Just under one in 12 students speak Irish daily outside of school (8%).
The most popular language to learn, that is unavailable at school, is Spanish. Over four in ten females would like to learn Spanish (42%) while a third of males would like to learn Spanish (33%). Forty-four different languages were mentioned by students in their responses. A broad diversity of languages were mentioned by students including Mongolian, Bisaya, Igbo, Korean and many more.
Four in ten students can hold an everyday conversation in at least three languages (41%). Approximately 3% of students are conversant in at least five languages. See Figure 3.
| How many languages | |
| 1 language | 27 |
| 2 languages | 32 |
| 3 languages | 31 |
| 4 languages | 7 |
| Over 5 languages | 3 |
Just over one in five females (22%) and under one in four males (24%) would learn a new language as there are “better job prospects abroad”. The least popular reason to learn a new language was “a sense of achievement” with less than one and ten students choosing this reason (9%). See Figure 4.
| X-axis label | Male | Female |
|---|---|---|
| Better job prospects abroad | 24 | 22 |
| Talking to other people | 22 | 22 |
| Learning about another culture | 13 | 16 |
| Learning a practical skill | 13 | 11 |
| Incentive to travel | 18 | 20 |
| A sense of achievement | 9 | 9 |
Students were also asked to measure their height. Over 83% of respondents were in either 1st year (54%) or transition year (29%). The average height of a male 1st year was 1.63m, 4cm taller than female first years. This height difference increased to 13cm in transition year, with female transition years measuring 1.65m and male transition years measuring 1.78m.

The weight of school bags was also measured. Almost seven in ten students found that their school bags weighed less than 2kg. Males were more likely to have a school bag that weighed over 6kg (15% of males, 10% of females).
School books were the heaviest object in student’s bags. Females were more likely to report that their drink bottle was the heaviest object in their bag than males (13% of females, 6% of males). See Figure 5.

| Heaviest object | Male | Female |
|---|---|---|
| School books | 58 | 48 |
| Copy books/Journal | 14 | 13 |
| Drink bottle | 6 | 13 |
| iPad/Laptop | 7 | 11 |
| Folder | 3 | 7 |
| Lunch | 5 | 3 |
| Miscellaneous | 4 | 2 |
| Pencil case | 3 | 3 |
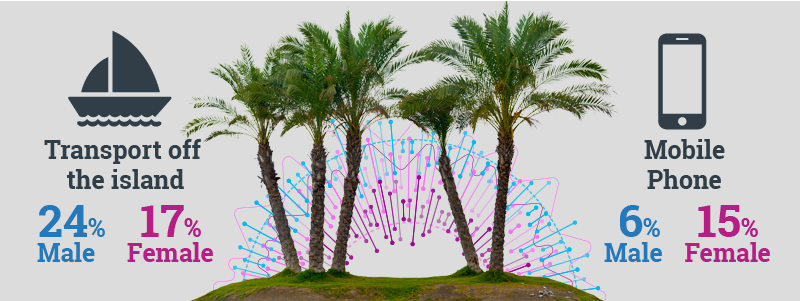
Students were asked what one object they would bring to a desert island. The most popular object to bring to a desert island was food and water with over one in three females (35%) and one in four males (26%) choosing this object. Males were more likely to want transport off the island (24% of males, 17% of females) while females were more likely to want to bring a phone (15% of females, 6% of males). See Figure 6.

| Object you would like to have with you | Male | Female |
|---|---|---|
| Entertainment | 6 | 5 |
| Friends or Family | 5 | 5 |
| Weapon | 10 | 5 |
| Survival Kit | 8 | 8 |
| Miscellaneous | 14 | 10 |
| Phone | 6 | 15 |
| Transport off the Island | 24 | 17 |
| Food and Water | 26 | 35 |
CensusAtSchool is a nonprofit making international project. It is funded by organisations interest in promoting good use of statistics, mathematics and data handling. Ireland became involved in CensusAtSchool in 2009. Four Irish bodies are collaborating in this project:
The Irish website, www.censusatschool.ie, has been in place since 2009.
The Royal Statistical Centre for Statistical Education (RSSCSE) started the CensusAtSchool project in 2000 in conjunction with the Office of National Statistics (ONS) in the UK. The project, originally a oneoff, was linked to the UK population census of 2001. It has now developed into a dynamic, ongoing and exciting initiative running in a number of countries. Further information can be found here:
USA http://ww2.amstat.org/censusatschool/index.cfm
Canada http://www.censusatschool.ca/
New Zealand http://new.censusatschool.org.nz/explore/
Japan http://census.ism.ac.jp/cas
1,417 secondary school attendees from 78 secondary schools completed the Phase 18 questionnaire of the CensusAtSchool survey between September 2017 and August 2018. Because the survey is not part of a representative sampling process, the results of the survey are less reliable in providing inferences about the overall secondary school student population.
The CensusAtSchool Phase 18 questionnaire and more results from the survey can be found on the CensusAtSchool website at http://www.censusatschool.ie/en/takepart/questionnaires
A data tool for examining international CensusAtSchool data can be found:
http://new.censusatschool.org.nz/explore/
It can be further explored using the facilities inbuilt in the inZight site operated by Statistics New Zealand.
https://www.stat.auckland.ac.nz/~wild/iNZight/index.php
Map 1 Student participation in CensusAtSchool Phase 17 questionnaire classified by county location of school
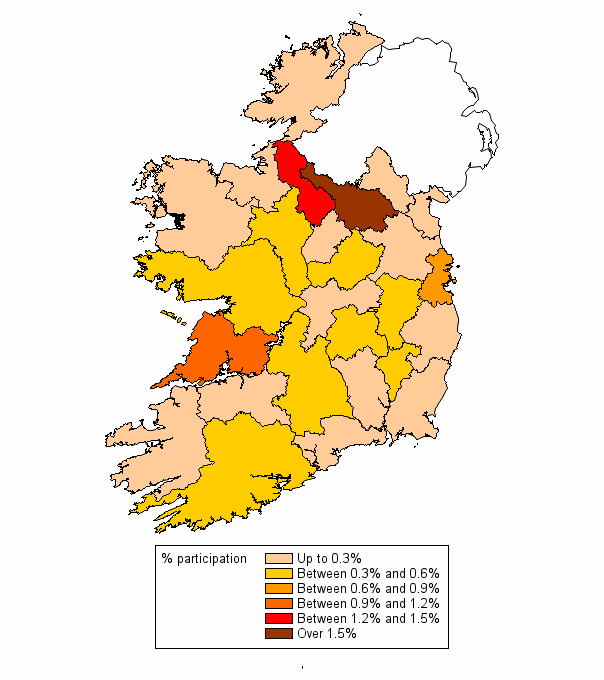
Note: The map only includes survey responses when the roll number on the questionnaire response matched a school roll number provided by the Department of Education and Skills.
FOR MORE INFORMATION ON THIS RELEASE:
Email: information@cso.ie
Sarah Crilly (+353) 21 453 5085
Aeidin Sheppard (+353) 21 453 5025