
From an estimated 352,000 secondary school students, 3,471 (1.0%) students completed the Phase 16 questionnaire of the CensusAtSchool survey. It was available between September 2016 and August 2017. The phase 16 questionnaire covered a variety of topics including:
Interesting findings from Phase 16 results:
Background information:
CensusAtSchool is a non-profit making international project. It is funded by organisations interested in promoting good use of statistics, mathematics and data handling. Ireland became involved in CensusAtSchool in 2009. Four Irish bodies are collaborating in this project:
The Irish website, www.censusatschool.ie, has been in place since 2009.
| X-axis label | Female | Male |
|---|---|---|
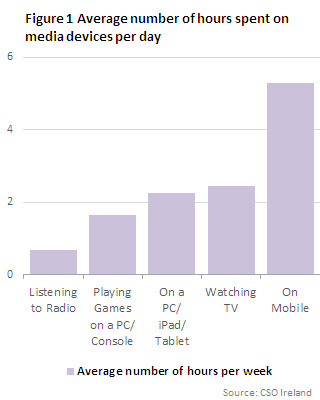
| Listening to Radio | 0.6378491 | 0.7099698 |
| Playing Games on a PC/console | 0.453882 | 2.8368457 |
| On a PC/iPad/ Tablet | 2.0655371 | 2.4230874 |
| Watching TV | 2.6627893 | 2.2230484 |
| On Mobile | 5.8675777 | 4.7255263 |
| X-axis label | Female | Male |
|---|---|---|
| On two shoulders (e.g. backpack) | 86 | 86.01 |
| On one shoulder | 11.1 | 10.62 |
| Other | 1.3 | 1.28 |
| On wheels | 1.12 | 1.68 |
| In my hand | 0.47 | 0.41 |
| Female | Male | |
| 2012 | 11.83 | 16.73 |
| 2016 | 11.1 | 10.62 |
| Female | Male | |
| 2012 | 85.97 | 78.71 |
| 2016 | 86 | 86.01 |
| Low level of concern | Medium level of concern | High level of concern | |
| 1st year | 21.33 | 34.44 | 44.24 |
| 2nd year | 25.67 | 32.93 | 41.4 |
| 3rd year | 31.4 | 27.91 | 40.7 |
| Transition Year | 20.1 | 35.9 | 43.99 |
| 5th year | 30.18 | 34.55 | 35.27 |
| 6th year | 19.27 | 27.52 | 53.21 |
| % who responded yes to the question | |
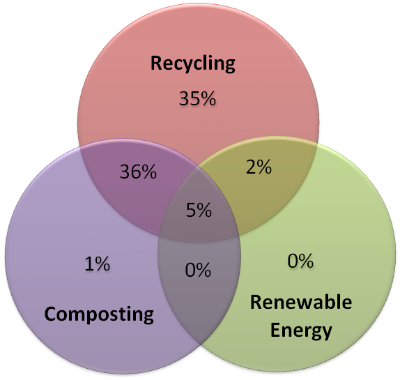
| Recycling | 78.3059636992221 |
| Composting | 42.7542494958225 |
| Renewable energy | 8.12445980985307 |
Figure 7 Environmentally friendly practices engaged in by families of students
| Table 1: UN Sustainable Development Goals ranked by students and displayed in order of most important | ||||||
| UN Sustainable Development Goal | Rank | |||||
| No Hunger | 1 | |||||
| Good Health | 2 | |||||
| No Poverty | 3 | |||||
| Clean Water & Sanitation | 4 | |||||
| Peace & Justice | 5 | |||||
| Quality Education | 6 | |||||
| Gender & Equality | 7 | |||||
| Good Jobs & Economic Growth | 8 | |||||
| Climate Action | 9 | |||||
| Renewable Energy | 10 | |||||
| Life On Land | 11 | |||||
| Sustainable Cities & Communities | 12 | |||||
| Reduce Inequalities | 13 | |||||
| Responsible Consumption | 14 | |||||
| Life Below Water | 15 | |||||
| Innovation & Infrastructure | 16 | |||||
| Partnerships For The Goals | 17 | |||||
| % of families who recycle these materials | |
| Paper/cardboard | 69.26 |
| Plastic | 63.7 |
| Glass | 54.54 |
| Tin/Aluminum cans | 52.84 |
| Batteries | 41.4 |
| Electrical items | 28.9 |
| Other | 4.49 |
| % of families who use this composting method | |
| Brown bin | 57.89 |
| Personal compost | 37.92 |
| Local compost facility | 2.16 |
| Other | 2.02 |
| % of families who use this renewable energy source | |
| Solar | 74.73 |
| Geothermal | 8.19 |
| Wind | 6.05 |
| Hydroelectric | 4.63 |
| Wave | 2.85 |
| Biomass | 1.78 |
| Tidal | 1.78 |
| % of students who reported that this was a factor for their family when determining their holiday destination | |
| Climate | 53.82 |
| Cost | 51.63 |
| Safety | 36.16 |
| Cultural (Sport/entertainment) | 28.67 |
| Visit family | 22.76 |
| Environment | 21.29 |
| Education | 5.53 |
| Other | 3.46 |
| % chosen by female students | |
| Blue | 31.43 |
| Purple | 12.34 |
| Pink | 10.1 |
| Black | 6.82 |
| Green | 6.3 |
| % chosen by male students | |
| Blue | 34.57 |
| Red | 18.34 |
| Green | 13.48 |
| Black | 7.26 |
| Orange | 4.31 |
| % chosen by female students | |
| Tired | 24.16 |
| Happy | 18.49 |
| Bored | 6.3 |
| Hungry | 3.71 |
| Confused | 2.8 |
| % chosen by male students | |
| Happy | 21.09 |
| Tired | 11.51 |
| Bored | 8.15 |
| Good | 4.93 |
| Grand | 2.64 |
The Royal Statistical Centre for Statistical Education (RSSCSE) started the CensusAtSchool project in 2000 in conjunction with the Office of National Statistics (ONS) in the UK. The project, originally a one-off, was linked to the UK population census of 2001. It has now developed into a dynamic, on-going and exciting initiative running in a number of countries. Further information can be found here:
USA http://ww2.amstat.org/censusatschool/index.cfm
Canada http://www.censusatschool.ca/
Australia http://www.abs.gov.au/censusatschool
New Zealand http://new.censusatschool.org.nz/explore/
UK http://www.censusatschool.com/
Japan http://census.ism.ac.jp/cas/
3,471 secondary school attendees from 124 secondary schools completed the Phase 16 questionnaire of the CensusAtSchool survey between September 2016 and August 2017. Because the survey is voluntary and not part of a representative sampling process, the results of the survey are less reliable in providing inferences about the overall secondary school student population.
The CensusAtSchool Phase 16 questionnaire and more results from the survey can be found on the CensusAtSchool website at http://www.censusatschool.ie/en/take-part/questionnaires
A data tool for examining international CensusAtSchool data can be found:
http://censusatschool.com/getmydata.php
http://new.censusatschool.org.nz/explore/
It can be further explored using the facilities inbuilt in the inZight site operated by Statistics New Zealand.
https://www.stat.auckland.ac.nz/~wild/iNZight/index.php
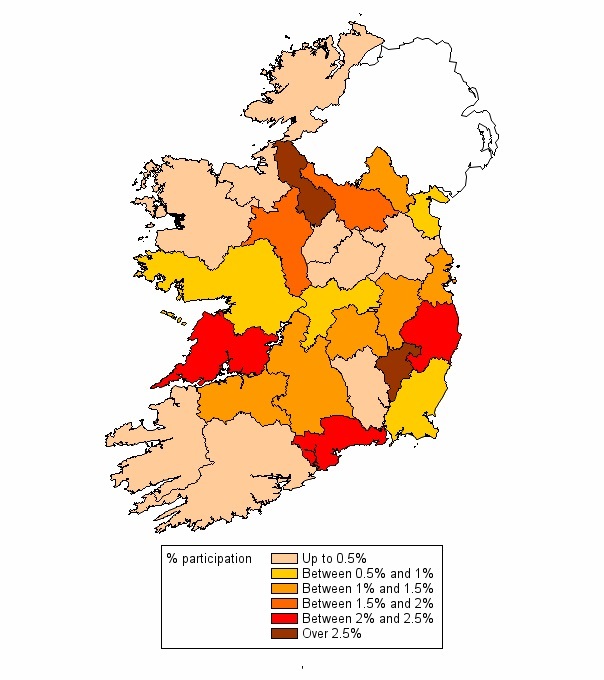
Note: The map only includes survey responses when the roll number on the questionnaire response matched a school roll number provided by the Department of Education and Skills.
 Hide Background Notes
Scan the QR code below to view this release online or go to
http://www.cso.ie
 Show Background Notes
 Hide Background Notes