
| Unadjusted | Seasonally Adjusted | |||||||
| Average Weekly Earnings | Average Hourly Earnings | Average Weekly Paid Hours | Average Hourly Total Labour Costs | Average Weekly Earnings | Average Hourly Earnings | Average Weekly Paid Hours | Average Hourly Total Labour Costs | |
| € | € | Hours | € | € | € | Hours | € | |
| Q1 2016 | 713.41 | 22.52 | 31.7 | 26.00 | 704.89 | 22.03 | 32.0 | 25.50 |
| Q4 2016 | 716.86 | 22.15 | 32.4 | 25.71 | 713.75 | 22.13 | 32.3 | 25.69 |
| Q1 2017* | 723.08 | 22.68 | 31.9 | 26.20 | 716.88 | 22.25 | 32.4 | 25.91 |
| Quarterly change % | +0.4 | +0.5 | +0.3 | +0.9 | ||||
| Annual change % | +1.4 | +0.7 | +0.6 | +0.8 | ||||
| * Preliminary Estimates | ||||||||
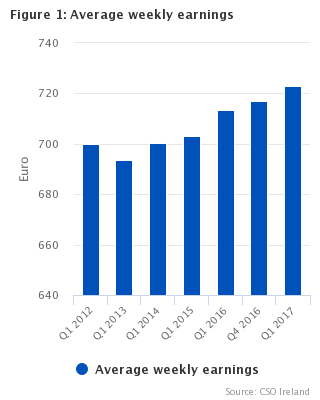
Average weekly earnings were €723.08 in Q1 2017, a rise of 1.4% from €713.41 one year earlier according to preliminary estimates of the Earnings and Labour Costs Quarterly release. Final data for average weekly earnings in Q4 2016 were €716.86 and showed an increase of 0.7% over the same period in 2015. See tables 1 and 4.
Other features of the preliminary results for Q1 2017 include:
Unadjusted average weekly earnings increase in 11 of the 13 sectors in year to Q1 2017
Average weekly earnings were €723.08 in Q1 2017, which represents average earnings in the Irish economy, however there are large variations in earnings across the sectors. The highest average weekly earnings of €1,162.16 were in the Financial, insurance and real estate sector, followed by the Information and Communication sector at €1,094.84. The lowest average weekly earnings were €326.90 in the Accommodation and food services sector and €471.12 in the Arts, entertainment, recreation and other service activities sector. See table 1 and figure 2.
Average weekly earnings increased in eleven of the thirteen sectors in the economy in the year to Q1 2017. The largest percentage increase was 5.2% in the Administrative and support services sector, in which average weekly earnings rose from €524.24 to €551.41 in the year to Q1 2017. Average weekly earnings rose by 3.8% in the Construction sector between the first quarter of 2016 and 2017, €708.35 to €735.07. See table 1 and figure 2.
Both the Information and Communication sector and the Arts, entertainment, recreation and other service activities sector showed annual decreases of 4.2% and 0.2% respectively, falling from €1,142.38 to €1,094.84 and €471.94 to €471.12. See table 1.
Average weekly earnings in the private sector showed an increase of 1.5% from €659.15 to €669.09 in the year to Q1 2017. There was also an increase in average weekly earnings in the public sector (including semi-state) of 1.6%, from €901.69 to €915.73 over the same period. However, when census field staff are excluded from Q1 2016 figures, average weekly earnings in the public sector increased 0.4% in the year to Q1 2017. See table 1.
In the five years to Q1 2017 average weekly earnings rose by 3.3%, from €699.98 in Q1 2012 to €723.08. There were large differences in the changes to average weekly earnings across individual sectors over this time period, ranging between +13.7% in the Financial, insurance and real estate sector to -3.0% in both the Education and the Human health and social work sectors. See table 1 and figure 2.
|
Note: While there is no internationally agreed methodology for assessing the public / private sector wage gap, the CSO has published analyses of the differential using the National Employment Survey for 2007-2010 and a matched Quarterly National Household Survey and P35 dataset for 2011-2014. These analyses took account of compositional differences between the public and private sector, such as occupational mix, sectors of activity, gender balance, union membership, etc. The public sector pay gap in 2014 was estimated to range from -0.36% to +5.05% depending on the specification applied and the treatment of the Pension Levy. See analysis for 2007-2010 here and for 2011-2014 here. |
| 5 Year % Change | |
| Financial & real estate | 13.7 |
| Admin & support service | 13.4 |
| Construction | 12.1 |
| Accommodation & food | 9.8 |
| Industry | 7.6 |
| Transportation | 7.5 |
| Wholesale & retail | 5.3 |
| Information & communication | 5 |
| Professional & technical | 3.3 |
| All sectors | 3.3 |
| Arts & entertainment | 0.5 |
| Public admin & defence | -2.2 |
| Education | -3 |
| Health & social | -3 |
| Nace code description |
|||
| Total | All Sectors | K-L | Financial, insurance and real estate activities |
| B-E | Industry | M | Professional, scientific and technical activities |
| F | Construction | N | Administrative and support service activities |
| G | Wholesale and retail trade; repair of motor vehicles and motorcycles | O | Public Administration and defence; compulsory social security |
| H | Transportation and storage | P | Education |
| I | Accommodation and food service activities | Q | Human health and social work activities |
| J | Information and communication | R-S | Arts, entertainment, recreation and other service activities |
Average hourly earnings increase 0.7% to €22.68 in year to Q1 2017
Average hourly earnings were €22.68 in Q1 2017. The sector with the highest average hourly earnings was the Education sector with a rate of €33.80, followed by the Financial, insurance and real estate sector with €33.55. The lowest earning sectors were the Accommodation and food services sector with average hourly earnings of €12.74 and the Arts, entertainment, recreation and other service activities sector with €16.82.
Average hourly earnings increased from €22.52 per hour in Q1 2016 to €22.68 in Q1 2017, representing an increase of 0.7%. Seasonally adjusted average hourly earnings showed an increase of 0.5% in the quarter to Q1 2017, increasing from €22.13 to €22.25. See table 2, table 4 and figure 3.
| Unadjusted | Seasonally Adjusted | |
| Q110 | 22.22 | 22.12 |
| Q210 | 22.05 | 22.08 |
| Q310 | 21.79 | 22.15 |
| Q410 | 22.16 | 22.12 |
| Q111 | 22.22 | 21.96 |
| Q211 | 21.92 | 22.01 |
| Q311 | 21.6 | 21.96 |
| Q411 | 22.09 | 21.97 |
| Q112 | 22.25 | 22.02 |
| Q212 | 21.98 | 22.03 |
| Q312 | 21.83 | 22.08 |
| Q412 | 21.92 | 21.89 |
| Q113 | 22.23 | 21.97 |
| Q213 | 22.04 | 21.97 |
| Q313 | 21.52 | 22 |
| Q413 | 21.89 | 21.99 |
| Q114 | 22.36 | 21.89 |
| Q214 | 21.82 | 21.88 |
| Q314 | 21.21 | 21.74 |
| Q414 | 22.08 | 21.91 |
| Q115 | 22.32 | 21.93 |
| Q215 | 21.89 | 21.9 |
| Q315 | 21.51 | 21.88 |
| Q415 | 21.92 | 21.87 |
| Q116 | 22.52 | 22.03 |
| Q216 | 21.98 | 21.95 |
| Q316 | 21.55 | 22.04 |
| Q416 | 22.15 | 22.13 |
| Q117 | 22.68 | 22.25 |
Average hourly earnings increased in 9 of the 13 main sectors in the year to Q1 2017. The Transportation and storage sector had the largest increase in average hourly earnings of 3.0% rising from €20.71 to €21.34 per hour in the year. The Information and Communication sector saw the largest annual fall in average hourly earnings to Q1 2017, decreasing 3.6% from €31.51 to €30.36 per hour. See table 2 and figure 4.
| Q1 2016 | Q1 2017 | |
| Industry | 23.07 | 23.51 |
| Construction | 19.66 | 20.15 |
| Wholesale & retail | 17.87 | 18.13 |
| Transportation | 20.71 | 21.34 |
| Accommodation & food | 12.41 | 12.74 |
| Information & communication | 31.51 | 30.36 |
| Financial & real estate | 32.81 | 33.55 |
| Professional & technical | 25.77 | 26.37 |
| Admin & support service | 18.08 | 18.09 |
| Public admin & defence | 25.35 | 25.16 |
| Education | 33.86 | 33.8 |
| Health & social | 22.07 | 22.3 |
| Arts & entertainment | 17.17 | 16.82 |
| All sectors | 22.52 | 22.68 |
In the five years to Q1 2017 overall average hourly earnings increased by 1.9% from €22.25 to €22.68. Over this period average hourly earnings have increased in 10 of the 13 sectors. The largest percentage increase was recorded in the Administrative and support services sector (+12.7%) rising from €16.05 to €18.09. Decreases in average hourly earnings were recorded in 3 sectors over the same period. The Education sector and the Public administration and defence sector both decreased 4.7% from €35.47 to €33.80 and from €26.41 to €25.16 respectively, while the Human health and social work sector fell 4.3% from €23.31 to €22.30.
Enterprises with less than 50 employees showed an annual increase of 2.1% in average hourly earnings in Q1 2017, from €18.39 to €18.77. Enterprises with greater than 250 employees recorded an increase in average hourly earnings of 0.2%, from €25.99 to €26.03 over the same period. Contrastingly enterprises with between 50 and 250 employees showed a decrease of 0.5% in the year to Q1 2017 with values falling from €20.85 to €20.74 in average hourly earnings.
Private sector average hourly earnings rose 0.9% from €20.89 to €21.08 in the year to Q1 2017. Public sector average hourly earnings also increased 0.7%, from €28.10 to €28.29, in the year.
Average weekly paid hours increase 0.6% in the year to Q1 2017
Average weekly paid hours were 31.9 across all economic sectors in the first quarter of 2017. There are large variations in average weekly paid hours with workers in the Industry sector recording the highest number at 38.1 followed by the Construction sector at 36.5. The sectors with the lowest average weekly paid hours were Education at 23.8 and Accommodation and food services at 25.7. See table 3, table 4 and figure 5.
| Unadjusted | Seasonally Adjusted | |
| Q110 | 31.1 | 31.8 |
| Q210 | 31.7 | 31.7 |
| Q310 | 32.2 | 31.7 |
| Q410 | 31.8 | 31.5 |
| Q111 | 30.9 | 31.5 |
| Q211 | 31.4 | 31.4 |
| Q311 | 31.9 | 31.5 |
| Q411 | 31.7 | 31.6 |
| Q112 | 31.5 | 31.6 |
| Q212 | 31.5 | 31.5 |
| Q312 | 31.8 | 31.5 |
| Q412 | 31.6 | 31.6 |
| Q113 | 31.2 | 31.6 |
| Q213 | 31.6 | 31.6 |
| Q313 | 31.7 | 31.6 |
| Q413 | 31.7 | 31.6 |
| Q114 | 31.3 | 31.7 |
| Q214 | 31.8 | 31.8 |
| Q314 | 31.9 | 31.8 |
| Q414 | 31.9 | 31.8 |
| Q115 | 31.5 | 31.9 |
| Q215 | 32 | 32 |
| Q315 | 32.2 | 32.1 |
| Q415 | 32.5 | 32 |
| Q116 | 31.7 | 32 |
| Q216 | 32.2 | 32.1 |
| Q316 | 32.6 | 32.2 |
| Q416 | 32.4 | 32.3 |
| Q117 | 31.9 | 32.4 |
Average weekly paid hours increased by 0.6% in the year to Q1 2017. Seasonally adjusted average weekly paid hours increased slightly in the quarter from 32.3 to 32.4 in Q1 2017.
The largest annual percentage increase in average weekly paid hours in Q1 2017 was recorded in the Administrative and support services sector (+5.2%), from 29.0 to 30.5 hours. The largest percentage decrease over the same period was seen in the Financial, insurance and real estate sector (-1.7%) from 35.2 to 34.6 hours.
Enterprises with greater than 250 employees showed an increase in average weekly paid hours of 1.2% while enterprises with less than 50 employees as well as those with between 50 and 250 employees showed no change in average weekly paid hours in the year to Q1 2017.
The public sector average weekly paid hours increased 0.9% in the year to Q1 2017, rising from 32.1 to 32.4. The private sector also recorded an increase in average weekly paid hours of 0.3% from 31.6 to 31.7 in the year. See table 3.
Average hourly total labour costs increase by 0.8% in year to Q1 2017
Average hourly total labour costs were €26.20 across all the economic sectors in Q1 2017. The sector with the highest average hourly total labour costs was the Financial, insurance and real estate sector with a rate of €41.76, followed by the Education sector at €37.43. The sectors with the lowest cost of employing labour were the Accommodation and food services sector with average hourly earnings of €14.08 and the Arts, entertainment, recreation and other service activities sector with €19.58.
Unadjusted average hourly total labour costs increased by 0.8% in the year to Q1 2017. Seasonally adjusted average hourly total labour costs increased 0.9% in the quarter from €25.69 to €25.91 in Q1 2017.
The largest annual percentage increase in average hourly total labour costs was seen in the Financial, insurance and real estate sector, rising by 3.6% from €40.32 to €41.76 per hour. The Information and communication sector and the Arts, entertainment, recreation and other service activities sector both recorded the largest annual percentage decrease in average hourly total labour costs, decreasing by 2.8% from €37.91 to €36.85 and €20.14 to €19.58 respectively. On a quarterly basis, seasonally adjusted average hourly total labour costs increased by 0.9% in the quarter to Q1 2017.
In the year to Q1 2017 the average hourly total labour costs in firms with less than 50 employees increased by 1.9% (from €20.91 to €21.30), while there was a 0.2% decrease for firms with 50 to 250 employees (from €24.28 to €24.22). Enterprises with greater than 250 employees recorded an increase of 0.3% in average hourly total labour costs over the same period (from €30.15 to €30.24). See table 4 and table 6c.
The public sector average hourly total labour costs increased 0.5% in the year to Q1 2017, from €31.22 to €31.39 while the private sector recorded an increase in average hourly total labour costs of 1.0% from €24.48 to €24.72 in the year.
Average hourly total labour costs increased by 2.7% over the five years to Q1 2017, from €25.50 per hour to €26.20. The percentage changes across the sectors ranged from +13.7% in the Administrative and support services sector (from €18.19 to €20.68) to -4.0% in the Public administration and defence sector (from €28.42 to €27.27). See table 6c and figure 6.
| 5 Year % Change | |
| Administrative and support services | 13.7 |
| Financial activities | 13.3 |
| Construction | 9.2 |
| Industry | 7.1 |
| Wholesale & retail | 6.8 |
| Accommodation & food | 6.4 |
| Information and communication | 5.6 |
| Total | 2.7 |
| Profesional activities | 1.4 |
| Transportation | 1.1 |
| Arts & entertainment | -0.5 |
| Health & social work | -3.6 |
| Education | -3.7 |
| Public admin & defence | -4 |
Average weekly earnings increase 1.6% across the public sector in year to Q1 2017
Average weekly earnings increased by 1.6% across the public sector in the year to Q1 2017, rising from €901.69 to €915.73. However, when census field staff are excluded from Q1 2016 figures, average weekly earnings for the public sector increased 0.4% in the year to Q1 2017, rising from €912.01 to €915.73. When Semi-State Bodies are excluded, average weekly earnings increased by 1.8% across the public sector in the year to Q1 2017, rising from €882.27 to €898.27. Six of the seven public sector sub-sectors had annual increases in average weekly earnings, with the Civil Service sub-sector recording the largest rise of 9.1% from €828.68 to €904.24 in the year to Q1 2017. However, when census field staff are excluded from Q1 2016 figures, average weekly earnings for the Civil Service decreased 1.4% from €916.78 to €904.24 in the year to Q1 2017. The Regional Bodies sub-sector showed a decrease in average weekly earnings in the year of 2.1%, from €844.49 to €826.50.
The Education sector recorded the highest average hourly earnings in the year to Q1 2017 of €37.71, while also showing the lowest hours worked of 24.2 hours. An Garda Síochána together with the Semi-state sector had the next highest earnings with average hourly earnings in the year to Q1 2017 of €28.26. An Garda Síochána worked the longest hours of 42.7 hours. The Defence sector recorded the lowest average hourly earnings in the year to Q1 2017 of €22.80. See tables 8a, 8b, 8c and figure 7.
| Q1 2016 | Q1 2017 | |
| Civil service | 828.68 | 904.24 |
| Defence | 811.03 | 812.35 |
| Garda Siochana | 1206.15 | 1205.58 |
| Education | 899.41 | 912.95 |
| Regional bodies | 844.49 | 826.5 |
| Health | 866.31 | 873.93 |
| Semi-state | 1024.2 | 1025.83 |
| All sectors | 882.27 | 898.27 |
Annual increase of 0.7% in public sector employment in Q1 2017
The estimated number of persons employed in the public sector showed an increase of 0.7% over the year to Q1 2017 from 386,300 to 389,200.
In the year to Q1 2017 the largest percentage increase was recorded in the Health sector, increasing 3.6% from 123,100 to 127,500 while the largest percentage decrease was recorded in the Civil Service sector, decreasing 8.3% from 43,600 to 40,000 and Defence was the only sector where numbers remained unchanged at 9,500. Over the five years from Q1 2012 to Q1 2017 overall employment numbers in the public sector are at the same level of 389,200. See table 8e and figure 8.
| Q4 2016 | Q1 2017 | |
| Civil service | 39900 | 40000 |
| Defence | 9500 | 9500 |
| Garda Siochana | 13200 | 13000 |
| Education | 112000 | 112600 |
| Regional bodies | 33100 | 33000 |
| Health | 125600 | 127500 |
| Semi-state | 53100 | 53500 |
Table 8e contains estimates of public sector employment numbers by sub-sector within the overall public sector. Public sector employment is spread across a number of NACE economic sectors and includes Semi-state bodies in sectors such as Transportation and storage and Information and communication. Furthermore, while employment in the Public administration and defence, Education, Human health and social work sectors is for the most part comprised of public sector employees, there is some element of private sector employment across these sectors.
Job vacancy rate 1.0% in Q1 2017
The job vacancy rate at the end of Q1 2017 was 1.0%, the same rate as a year earlier. In Q1 2017 the Professional, scientific and technical activities sector had the highest job vacancy rate of 2.7%, followed by the Financial, insurance and real estate sector with a vacancy rate of 2.1%. The Construction sector and the Transportation and storage sector shared the lowest vacancy rate of 0.3% at the end of Q1 2017. See table 7c and figure 9.
The rounded number of job vacancies at the end of Q1 2017 was 16,700 representing a rise of 1,000 from the number of vacancies at the end of Q1 2016 and an increase of 800 on the vacancies reported at the end of Q4 2016. See table 7b.
| Job Vacancy Rate | |
| Q110 | 0.4 |
| Q210 | 0.5 |
| Q310 | 0.5 |
| Q410 | 0.5 |
| Q111 | 0.5 |
| Q211 | 0.6 |
| Q311 | 0.5 |
| Q411 | 0.5 |
| Q112 | 0.6 |
| Q212 | 0.5 |
| Q312 | 0.6 |
| Q412 | 0.6 |
| Q113 | 0.6 |
| Q213 | 0.7 |
| Q313 | 0.7 |
| Q413 | 0.7 |
| Q114 | 0.7 |
| Q214 | 0.7 |
| Q314 | 0.8 |
| Q414 | 0.7 |
| Q115 | 1 |
| Q215 | 0.9 |
| Q315 | 1 |
| Q415 | 0.9 |
| Q116 | 1 |
| Q216 | 0.9 |
| Q316 | 1 |
| Q416 | 0.9 |
| Q117 | 1 |
| Table 1 Average weekly earnings by economic sector and other characteristics and quarter¹ | ||||||||||||
| NACE Principal Activity | 2012 | 2013 | 2014 | 2015 | 2016 | 2016 | 2017 | Quarterly change | Annual change | |||
| Q1 | Q1 | Q1 | Q1 | Q1 | Q4 | Q1* | ||||||
| € | € | € | € | € | € | € | € | % | € | % | ||
| B-E | Industry | 832.17 | 824.23 | 864.51 | 858.30 | 881.87 | 867.93 | 895.16 | +27.23 | +3.1 | +13.29 | +1.5 |
| F | Construction | 655.56 | 640.22 | 699.23 | 696.96 | 708.35 | 751.49 | 735.07 | -16.42 | -2.2 | +26.72 | +3.8 |
| G | Wholesale and retail trade; repair of motor vehicles and motorcycles | 518.47 | 518.83 | 520.87 | 532.91 | 541.43 | 572.06 | 546.20 | -25.86 | -4.5 | +4.77 | +0.9 |
| H | Transportation and storage | 709.19 | 723.54 | 706.45 | 731.62 | 735.83 | 772.61 | 762.47 | -10.14 | -1.3 | +26.64 | +3.6 |
| I | Accommodation and food services | 297.67 | 293.01 | 306.81 | 311.13 | 316.09 | 335.22 | 326.90 | -8.32 | -2.5 | +10.81 | +3.4 |
| J | Information and communication | 1,042.64 | 1,039.00 | 1,037.38 | 1,101.41 | 1,142.38 | 1,048.15 | 1,094.84 | +46.69 | +4.5 | -47.54 | -4.2 |
| K-L | Financial, insurance and real estate | 1,022.02 | 1,044.79 | 1,111.29 | 1,086.33 | 1,155.99 | 1,017.38 | 1,162.16 | +144.78 | +14.2 | +6.17 | +0.5 |
| M | Professional, scientific and technical activities | 857.00 | 826.39 | 829.87 | 803.57 | 862.77 | 885.17 | 885.05 | -0.12 | - | +22.28 | +2.6 |
| N | Administrative and support services | 486.13 | 506.09 | 513.94 | 507.91 | 524.24 | 531.58 | 551.41 | +19.83 | +3.7 | +27.17 | +5.2 |
| O | Public administration and defence | 936.41 | 940.82 | 920.92 | 930.55 | 897.14 | 921.77 | 916.26 | -5.51 | -0.6 | +19.12 | +2.1 |
| P | Education | 828.09 | 814.13 | 802.20 | 796.70 | 795.11 | 812.63 | 802.87 | -9.76 | -1.2 | +7.76 | +1.0 |
| Q | Human health and social work | 711.91 | 689.02 | 667.90 | 669.48 | 678.21 | 685.15 | 690.59 | +5.44 | +0.8 | +12.38 | +1.8 |
| R-S | Arts, entertainment, recreation and other service activities | 468.60 | 484.24 | 461.87 | 469.05 | 471.94 | 475.91 | 471.12 | -4.79 | -1.0 | -0.82 | -0.2 |
| Total | 699.98 | 693.61 | 700.39 | 702.95 | 713.41 | 716.86 | 723.08 | +6.22 | +0.9 | +9.67 | +1.4 | |
| Public/Private Sector² | ||||||||||||
| Private sector | 626.74 | 624.68 | 638.57 | 642.06 | 659.15 | 660.01 | 669.09 | +9.08 | +1.4 | +9.94 | +1.5 | |
| Public sector¹ | 917.46 | 915.62 | 902.98 | 906.57 | 901.69 | 920.13 | 915.73 | -4.40 | -0.5 | +14.04 | +1.6 | |
| Size of Enterprise | ||||||||||||
| Less than 50 employees | 536.24 | 534.31 | 553.26 | 546.85 | 556.99 | 573.12 | 569.47 | -3.65 | -0.6 | +12.48 | +2.2 | |
| 50-250 employees | 654.51 | 651.82 | 638.59 | 650.89 | 667.17 | 655.68 | 663.47 | +7.79 | +1.2 | -3.70 | -0.6 | |
| Greater than 250 employees | 835.22 | 830.18 | 834.69 | 835.37 | 846.76 | 847.39 | 858.12 | +10.73 | +1.3 | +11.36 | +1.3 | |
| ¹ Average weekly earnings by Public sector sub-sector are set out in Table 8a. | ||||||||||||
| ² For additional Public/Private data see StatBank table EHQ08. | ||||||||||||
| * Preliminary Estimates | ||||||||||||
| Table 2 Average hourly earnings by economic sector and other characteristics and quarter¹ | ||||||||||||
| NACE Principal Activity | 2012 | 2013 | 2014 | 2015 | 2016 | 2016 | 2017 | Quarterly change | Annual change | |||
| Q1 | Q1 | Q1 | Q1 | Q1 | Q4 | Q1* | ||||||
| € | € | € | € | € | € | € | € | % | € | % | ||
| B-E | Industry | 22.27 | 22.06 | 22.83 | 22.73 | 23.07 | 22.46 | 23.51 | +1.05 | +4.7 | +0.44 | +1.9 |
| F | Construction | 18.55 | 18.32 | 19.25 | 19.20 | 19.66 | 20.42 | 20.15 | -0.27 | -1.3 | +0.49 | +2.5 |
| G | Wholesale and retail trade; repair of motor vehicles and motorcycles | 17.07 | 17.33 | 17.43 | 17.85 | 17.87 | 18.39 | 18.13 | -0.26 | -1.4 | +0.26 | +1.5 |
| H | Transportation and storage | 19.96 | 20.25 | 20.27 | 20.28 | 20.71 | 21.55 | 21.34 | -0.21 | -1.0 | +0.63 | +3.0 |
| I | Accommodation and food services | 12.10 | 12.06 | 12.28 | 12.29 | 12.41 | 12.60 | 12.74 | +0.14 | +1.1 | +0.33 | +2.7 |
| J | Information and communication | 28.82 | 28.39 | 28.82 | 30.56 | 31.51 | 29.13 | 30.36 | +1.23 | +4.2 | -1.15 | -3.6 |
| K-L | Financial, insurance and real estate | 30.17 | 30.70 | 32.24 | 31.96 | 32.81 | 28.87 | 33.55 | +4.68 | +16.2 | +0.74 | +2.3 |
| M | Professional, scientific and technical activities | 26.17 | 25.33 | 25.34 | 24.66 | 25.77 | 25.73 | 26.37 | +0.64 | +2.5 | +0.60 | +2.3 |
| N | Administrative and support services | 16.05 | 17.02 | 17.58 | 17.19 | 18.08 | 17.21 | 18.09 | +0.88 | +5.1 | +0.01 | +0.1 |
| O | Public administration and defence | 26.41 | 26.51 | 25.55 | 25.66 | 25.35 | 25.20 | 25.16 | -0.04 | -0.2 | -0.19 | -0.7 |
| P | Education | 35.47 | 35.25 | 34.35 | 33.76 | 33.86 | 33.76 | 33.80 | +0.04 | +0.1 | -0.06 | -0.2 |
| Q | Human health and social work | 23.31 | 22.84 | 22.35 | 22.05 | 22.07 | 22.22 | 22.30 | +0.08 | +0.4 | +0.23 | +1.0 |
| R-S | Arts, entertainment, recreation and other service activities | 16.64 | 17.22 | 16.86 | 17.33 | 17.17 | 16.70 | 16.82 | +0.12 | +0.7 | -0.35 | -2.0 |
| Total | 22.25 | 22.23 | 22.36 | 22.32 | 22.52 | 22.15 | 22.68 | +0.53 | +2.4 | +0.16 | +0.7 | |
| Public/Private Sector² | ||||||||||||
| Private sector | 19.97 | 20.08 | 20.51 | 20.51 | 20.89 | 20.44 | 21.08 | +0.64 | +3.1 | +0.19 | +0.9 | |
| Public sector¹ | 28.96 | 29.04 | 28.29 | 28.19 | 28.10 | 28.23 | 28.29 | +0.06 | +0.2 | +0.19 | +0.7 | |
| Size of Enterprise | ||||||||||||
| Less than 50 employees | 17.73 | 17.89 | 18.54 | 18.20 | 18.39 | 18.60 | 18.77 | +0.17 | +0.9 | +0.38 | +2.1 | |
| 50-250 employees | 20.52 | 20.58 | 20.20 | 20.55 | 20.85 | 20.15 | 20.74 | +0.59 | +2.9 | -0.11 | -0.5 | |
| Greater than 250 employees | 25.96 | 25.90 | 25.82 | 25.72 | 25.99 | 25.35 | 26.03 | +0.68 | +2.7 | +0.04 | +0.2 | |
| ¹ Average hourly earnings by Public sector sub-sector are set out in Table 8b. | ||||||||||||
| ² For additional Public/Private data see StatBank table EHQ08. | ||||||||||||
| * Preliminary Estimates | ||||||||||||
| Table 3 Average weekly paid hours by economic sector and other characteristics and quarter¹ | ||||||||||||
| NACE Principal Activity | 2012 | 2013 | 2014 | 2015 | 2016 | 2016 | 2017 | Quarterly change | Annual change | |||
| Q1 | Q1 | Q1 | Q1 | Q1 | Q4 | Q1* | ||||||
| hours | hours | hours | hours | hours | hours | hours | hours | % | hours | % | ||
| B-E | Industry | 37.4 | 37.4 | 37.9 | 37.8 | 38.2 | 38.6 | 38.1 | -0.5 | -1.3 | -0.1 | -0.3 |
| F | Construction | 35.3 | 34.9 | 36.3 | 36.3 | 36.0 | 36.8 | 36.5 | -0.3 | -0.8 | 0.5 | +1.4 |
| G | Wholesale and retail trade; repair of motor vehicles and motorcycles | 30.4 | 29.9 | 29.9 | 29.9 | 30.3 | 31.1 | 30.1 | -1.0 | -3.2 | -0.2 | -0.7 |
| H | Transportation and storage | 35.5 | 35.7 | 34.9 | 36.1 | 35.5 | 35.8 | 35.7 | -0.1 | -0.3 | 0.2 | +0.6 |
| I | Accommodation and food services | 24.6 | 24.3 | 25.0 | 25.3 | 25.5 | 26.6 | 25.7 | -0.9 | -3.4 | 0.2 | +0.8 |
| J | Information and communication | 36.2 | 36.6 | 36.0 | 36.0 | 36.2 | 36.0 | 36.1 | 0.1 | +0.3 | -0.1 | -0.3 |
| K-L | Financial, insurance and real estate | 33.9 | 34.0 | 34.5 | 34.0 | 35.2 | 35.2 | 34.6 | -0.6 | -1.7 | -0.6 | -1.7 |
| M | Professional, scientific and technical activities | 32.8 | 32.6 | 32.8 | 32.6 | 33.5 | 34.4 | 33.6 | -0.8 | -2.3 | 0.1 | +0.3 |
| N | Administrative and support services | 30.3 | 29.7 | 29.2 | 29.6 | 29.0 | 30.9 | 30.5 | -0.4 | -1.3 | 1.5 | +5.2 |
| O | Public administration and defence | 35.5 | 35.5 | 36.0 | 36.3 | 35.4 | 36.6 | 36.4 | -0.2 | -0.5 | 1.0 | +2.8 |
| P | Education | 23.3 | 23.1 | 23.4 | 23.6 | 23.5 | 24.1 | 23.8 | -0.3 | -1.2 | 0.3 | +1.3 |
| Q | Human health and social work | 30.5 | 30.2 | 29.9 | 30.4 | 30.7 | 30.8 | 31.0 | 0.2 | +0.6 | 0.3 | +1.0 |
| R-S | Arts, entertainment, recreation and other service activities | 28.2 | 28.1 | 27.4 | 27.1 | 27.5 | 28.5 | 28.0 | -0.5 | -1.8 | 0.5 | +1.8 |
| Total | 31.5 | 31.2 | 31.3 | 31.5 | 31.7 | 32.4 | 31.9 | -0.5 | -1.5 | 0.2 | +0.6 | |
| Public/Private Sector² | ||||||||||||
| Private sector | 31.4 | 31.1 | 31.1 | 31.3 | 31.6 | 32.3 | 31.7 | -0.6 | -1.9 | 0.1 | +0.3 | |
| Public sector¹ | 31.7 | 31.5 | 31.9 | 32.2 | 32.1 | 32.6 | 32.4 | -0.2 | -0.6 | 0.3 | +0.9 | |
| Size of Enterprise | ||||||||||||
| Less than 50 employees | 30.3 | 29.9 | 29.8 | 30.1 | 30.3 | 30.8 | 30.3 | -0.5 | -1.6 | - | - | |
| 50-250 employees | 31.9 | 31.7 | 31.6 | 31.7 | 32.0 | 32.5 | 32.0 | -0.5 | -1.5 | - | - | |
| Greater than 250 employees | 32.2 | 32.1 | 32.3 | 32.5 | 32.6 | 33.4 | 33.0 | -0.4 | -1.2 | 0.4 | +1.2 | |
| ¹ Average weekly paid hours by Public sector sub-sector are set out in Table 8c. | ||||||||||||
| ² For additional Public/Private data see StatBank table EHQ08. | ||||||||||||
| * Preliminary Estimates | ||||||||||||
| Table 4 Earnings, hours and labour costs, unadjusted and seasonally adjusted by other characteristics and quarter | |||||||||||
| Unadjusted Series | Seasonally Adjusted Series | ||||||||||
| Quarter | Average weekly earnings | Average weekly paid hours | Average hourly earnings | Average hourly other labour costs | Average hourly total labour costs | Average weekly earnings | Average weekly paid hours | Average hourly earnings | Average hourly other labour costs | Average hourly total labour costs | |
| Q108 | 704.85 | 32.7 | 21.53 | 3.50 | 25.03 | 703.05 | 32.9 | 21.14 | 3.47 | 24.60 | |
| Q208 | 706.56 | 32.9 | 21.51 | 3.40 | 24.91 | 706.93 | 32.9 | 21.50 | 3.45 | 24.98 | |
| Q308 | 697.63 | 32.9 | 21.21 | 3.42 | 24.63 | 710.46 | 32.7 | 21.67 | 3.51 | 25.15 | |
| Q408 | 721.27 | 32.5 | 22.17 | 3.60 | 25.77 | 712.94 | 32.5 | 21.85 | 3.48 | 25.38 | |
| Q109 | 710.77 | 31.7 | 22.44 | 3.59 | 26.03 | 712.30 | 32.0 | 22.17 | 3.61 | 25.76 | |
| Q209 | 702.63 | 31.9 | 22.02 | 3.65 | 25.66 | 706.30 | 31.9 | 22.14 | 3.66 | 25.73 | |
| Q309 | 700.05 | 32.0 | 21.89 | 3.49 | 25.38 | 706.02 | 31.9 | 22.17 | 3.58 | 25.77 | |
| Q409 | 723.72 | 32.1 | 22.52 | 3.66 | 26.18 | 707.62 | 31.7 | 22.31 | 3.54 | 25.89 | |
| Q110 | 691.40 | 31.1 | 22.22 | 3.36 | 25.58 | 703.05 | 31.8 | 22.12 | 3.38 | 25.40 | |
| Q210 | 698.62 | 31.7 | 22.05 | 3.29 | 25.34 | 699.56 | 31.7 | 22.08 | 3.30 | 25.41 | |
| Q310 | 701.40 | 32.2 | 21.79 | 3.13 | 24.92 | 699.40 | 31.7 | 22.15 | 3.22 | 25.43 | |
| Q410 | 705.78 | 31.8 | 22.16 | 3.27 | 25.43 | 695.71 | 31.5 | 22.12 | 3.16 | 25.26 | |
| Q111 | 686.85 | 30.9 | 22.22 | 3.14 | 25.36 | 691.16 | 31.5 | 21.96 | 3.15 | 25.04 | |
| Q211 | 689.32 | 31.4 | 21.92 | 3.14 | 25.06 | 691.51 | 31.4 | 22.01 | 3.15 | 25.12 | |
| Q311 | 688.58 | 31.9 | 21.60 | 3.08 | 24.68 | 692.07 | 31.5 | 21.96 | 3.17 | 25.13 | |
| Q411 | 699.19 | 31.7 | 22.09 | 3.29 | 25.38 | 692.57 | 31.6 | 21.97 | 3.18 | 25.26 | |
| Q112 | 699.98 | 31.5 | 22.25 | 3.25 | 25.50 | 694.70 | 31.6 | 22.02 | 3.26 | 25.31 | |
| Q212 | 693.50 | 31.5 | 21.98 | 3.29 | 25.27 | 694.54 | 31.5 | 22.03 | 3.31 | 25.32 | |
| Q312 | 693.74 | 31.8 | 21.83 | 3.31 | 25.14 | 693.15 | 31.5 | 22.08 | 3.40 | 25.46 | |
| Q412 | 693.21 | 31.6 | 21.92 | 3.58 | 25.49 | 691.86 | 31.6 | 21.89 | 3.46 | 25.32 | |
| Q113 | 693.61 | 31.2 | 22.23 | 3.45 | 25.68 | 692.55 | 31.6 | 21.97 | 3.41 | 25.41 | |
| Q213 | 697.21 | 31.6 | 22.04 | 3.32 | 25.36 | 694.92 | 31.6 | 21.97 | 3.38 | 25.40 | |
| Q313 | 682.28 | 31.7 | 21.52 | 3.22 | 24.74 | 694.69 | 31.6 | 22.00 | 3.31 | 25.38 | |
| Q413 | 694.50 | 31.7 | 21.89 | 3.72 | 25.61 | 695.99 | 31.6 | 21.99 | 3.61 | 25.47 | |
| Q114 | 700.39 | 31.3 | 22.36 | 3.40 | 25.77 | 692.07 | 31.7 | 21.89 | 3.40 | 25.32 | |
| Q214 | 694.98 | 31.8 | 21.82 | 3.37 | 25.20 | 696.52 | 31.8 | 21.88 | 3.38 | 25.23 | |
| Q314 | 677.13 | 31.9 | 21.21 | 3.26 | 24.47 | 692.10 | 31.8 | 21.74 | 3.34 | 25.11 | |
| Q414 | 703.91 | 31.9 | 22.08 | 3.51 | 25.59 | 699.54 | 31.8 | 21.91 | 3.42 | 25.28 | |
| Q115 | 702.95 | 31.5 | 22.32 | 3.45 | 25.77 | 701.18 | 31.9 | 21.93 | 3.45 | 25.33 | |
| Q215 | 700.66 | 32.0 | 21.89 | 3.44 | 25.33 | 701.13 | 32.0 | 21.90 | 3.44 | 25.36 | |
| Q315 | 693.57 | 32.2 | 21.51 | 3.34 | 24.84 | 702.29 | 32.1 | 21.88 | 3.42 | 25.36 | |
| Q415 | 712.02 | 32.5 | 21.92 | 3.45 | 25.37 | 700.60 | 32.0 | 21.87 | 3.37 | 25.18 | |
| Q116 | 713.41 | 31.7 | 22.52 | 3.48 | 26.00 | 704.89 | 32.0 | 22.03 | 3.43 | 25.50 | |
| Q216 | 707.02 | 32.2 | 21.98 | 3.46 | 25.44 | 706.30 | 32.1 | 21.95 | 3.50 | 25.47 | |
| Q316 | 702.69 | 32.6 | 21.55 | 3.45 | 24.99 | 708.82 | 32.2 | 22.04 | 3.54 | 25.58 | |
| Q416 | 716.86 | 32.4 | 22.15 | 3.55 | 25.71 | 713.75 | 32.3 | 22.13 | 3.48 | 25.69 | |
| Q117* | 723.08 | 31.9 | 22.68 | 3.52 | 26.20 | 716.88 | 32.4 | 22.25 | 3.52 | 25.91 | |
| *Preliminary Estimates | |||||||||||
| Table 5a Average hourly earnings excluding irregular earnings by economic sector and other characteristics and quarter¹² | ||||||||||||
| NACE Principal Activity | 2012 | 2013 | 2014 | 2015 | 2016 | 2016 | 2017 | Quarterly change | Annual change | |||
| Q1 | Q1 | Q1 | Q1 | Q1 | Q4 | Q1* | ||||||
| € | € | € | € | € | € | € | € | % | € | % | ||
| B-E | Industry | 20.46 | 20.44 | 20.80 | 20.82 | 20.88 | 21.03 | 21.33 | +0.30 | +1.4 | +0.45 | +2.2 |
| F | Construction | 18.43 | 18.18 | 18.91 | 18.91 | 19.50 | 19.83 | 19.77 | -0.06 | -0.3 | +0.27 | +1.4 |
| G | Wholesale and retail trade; repair of motor vehicles and motorcycles | 16.08 | 16.39 | 16.34 | 16.55 | 16.79 | 17.05 | 17.15 | +0.10 | +0.6 | +0.36 | +2.1 |
| H | Transportation and storage | 18.78 | 19.10 | 19.42 | 19.34 | 19.82 | 20.08 | 20.46 | +0.38 | +1.9 | +0.64 | +3.2 |
| I | Accommodation and food services | 11.86 | 11.87 | 12.07 | 12.04 | 12.08 | 12.27 | 12.39 | +0.12 | +1.0 | +0.31 | +2.6 |
| J | Information and communication | 25.25 | 25.04 | 25.49 | 26.04 | 26.69 | 26.40 | 25.91 | -0.49 | -1.9 | -0.78 | -2.9 |
| K-L | Financial, insurance and real estate | 27.00 | 26.71 | 26.77 | 26.86 | 26.72 | 27.31 | 27.83 | +0.52 | +1.9 | +1.11 | +4.2 |
| M | Professional, scientific and technical activities | 23.58 | 23.69 | 23.92 | 22.99 | 23.75 | 24.21 | 24.62 | +0.41 | +1.7 | +0.87 | +3.7 |
| N | Administrative and support services | 15.06 | 15.33 | 15.84 | 16.18 | 16.33 | 16.23 | 16.36 | +0.13 | +0.8 | +0.03 | +0.2 |
| O | Public administration and defence | 25.17 | 25.29 | 24.38 | 24.46 | 24.28 | 24.19 | 24.16 | -0.03 | -0.1 | -0.12 | -0.5 |
| P | Education | 34.96 | 34.66 | 33.90 | 33.37 | 33.50 | 33.24 | 33.49 | +0.25 | +0.8 | -0.01 | - |
| Q | Human health and social work | 22.22 | 21.80 | 21.41 | 21.17 | 21.15 | 21.23 | 21.32 | +0.09 | +0.4 | +0.17 | +0.8 |
| R-S | Arts, entertainment, recreation and other service activities | 15.96 | 16.41 | 16.16 | 16.41 | 16.03 | 15.85 | 15.87 | +0.02 | +0.1 | -0.16 | -1.0 |
| Total | 20.91 | 20.88 | 20.89 | 20.83 | 20.91 | 20.99 | 21.15 | +0.16 | +0.8 | +0.24 | +1.1 | |
| Public/Private Sector³ | ||||||||||||
| Private sector | 18.59 | 18.70 | 18.93 | 18.90 | 19.11 | 19.27 | 19.43 | +0.16 | +0.8 | +0.32 | +1.7 | |
| Public sector² | 27.71 | 27.81 | 27.17 | 27.10 | 27.05 | 27.07 | 27.16 | +0.09 | +0.3 | +0.11 | +0.4 | |
| Size of Enterprise | ||||||||||||
| Less than 50 employees | 17.05 | 17.21 | 17.57 | 17.41 | 17.50 | 17.80 | 17.92 | +0.12 | +0.7 | +0.42 | +2.4 | |
| 50-250 employees | 18.96 | 19.10 | 18.83 | 18.99 | 19.02 | 19.08 | 19.25 | +0.17 | +0.9 | +0.23 | +1.2 | |
| Greater than 250 employees | 24.22 | 24.13 | 23.97 | 23.79 | 23.96 | 23.90 | 24.04 | +0.14 | +0.6 | +0.08 | +0.3 | |
| ¹ Average hourly earnings excluding irregular earnings plus the average hourly irregular earnings in Table 5b equal average hourly earnings as set out in Table 2. | ||||||||||||
| ² Average hourly earnings excluding irregular earnings by Public sector sub-sector are set out in Table 8d. | ||||||||||||
| ³ For additional Public/Private data see StatBank table EHQ08. | ||||||||||||
| * Preliminary Estimates | ||||||||||||
| Table 5b Average hourly irregular earnings by economic sector and other characteristics and quarter¹² | ||||||||||
| NACE Principal Activity | 2012 | 2013 | 2014 | 2015 | 2016 | 2016 | 2017 | Quarterly change | Annual change | |
| Q1 | Q1 | Q1 | Q1 | Q1 | Q4 | Q1* | ||||
| € | € | € | € | € | € | € | € | € | ||
| B-E | Industry | 1.81 | 1.63 | 2.04 | 1.91 | 2.19 | 1.44 | 2.17 | +0.73 | -0.02 |
| F | Construction | 0.12 | 0.14 | 0.34 | 0.29 | 0.17 | 0.58 | 0.38 | -0.20 | +0.21 |
| G | Wholesale and retail trade; repair of motor vehicles and motorcycles | 1.00 | 0.94 | 1.10 | 1.30 | 1.09 | 1.34 | 0.98 | -0.36 | -0.11 |
| H | Transportation and storage | 1.19 | 1.14 | 0.84 | 0.94 | 0.90 | 1.48 | 0.88 | -0.60 | -0.02 |
| I | Accommodation and food services | 0.23 | 0.19 | 0.21 | 0.25 | 0.33 | 0.32 | 0.34 | +0.02 | +0.01 |
| J | Information and communication | 3.56 | 3.35 | 3.33 | 4.52 | 4.82 | 2.73 | 4.45 | +1.72 | -0.37 |
| K-L | Financial, insurance and real estate | 3.17 | 3.99 | 5.47 | 5.09 | 6.10 | 1.56 | 5.72 | +4.16 | -0.38 |
| M | Professional, scientific and technical activities | 2.58 | 1.64 | 1.41 | 1.67 | 2.01 | 1.52 | 1.75 | +0.23 | -0.26 |
| N | Administrative and support services | 1.00 | 1.69 | 1.74 | 1.00 | 1.74 | 0.97 | 1.73 | +0.76 | -0.01 |
| O | Public administration and defence | 1.24 | 1.22 | 1.16 | 1.20 | 1.08 | 1.01 | 1.00 | -0.01 | -0.08 |
| P | Education | 0.52 | 0.59 | 0.44 | 0.38 | 0.35 | 0.52 | 0.31 | -0.21 | -0.04 |
| Q | Human health and social work | 1.09 | 1.04 | 0.94 | 0.87 | 0.92 | 0.99 | 0.98 | -0.01 | +0.06 |
| R-S | Arts, entertainment, recreation and other service activities | 0.68 | 0.80 | 0.70 | 0.92 | 1.13 | 0.85 | 0.96 | +0.11 | -0.17 |
| Total | 1.35 | 1.34 | 1.47 | 1.49 | 1.61 | 1.16 | 1.53 | +0.37 | -0.08 | |
| Public/Private Sector³ | ||||||||||
| Private sector | 1.38 | 1.38 | 1.58 | 1.61 | 1.78 | 1.17 | 1.64 | +0.47 | -0.14 | |
| Public sector² | 1.24 | 1.23 | 1.12 | 1.08 | 1.05 | 1.16 | 1.13 | -0.03 | +0.08 | |
| Size of Enterprise | ||||||||||
| Less than 50 employees | 0.67 | 0.68 | 0.97 | 0.78 | 0.89 | 0.80 | 0.86 | +0.06 | -0.03 | |
| 50-250 employees | 1.56 | 1.49 | 1.38 | 1.56 | 1.84 | 1.07 | 1.49 | +0.42 | -0.35 | |
| Greater than 250 employees | 1.73 | 1.77 | 1.85 | 1.93 | 2.03 | 1.45 | 1.99 | +0.54 | -0.04 | |
| ¹ Average hourly irregular earnings plus the average hourly earnings excluding irregular earnings in Table 5a equal average hourly earnings as set out in Table 2. | ||||||||||
| ² Average hourly earnings excluding irregular earnings by Public sector sub-sector are set out in Table 8d. | ||||||||||
| ³ For additional Public/Private data see StatBank table EHQ08. | ||||||||||
| * Preliminary Estimates | ||||||||||
| Table 6a Average hourly other labour costs by economic sector and other characteristics and quarter | ||||||||||||
| NACE Principal Activity | 2012 | 2013 | 2014 | 2015 | 2016 | 2016 | 2017 | Quarterly change | Annual change | |||
| Q1 | Q1 | Q1 | Q1 | Q1 | Q4 | Q1* | ||||||
| € | € | € | € | € | € | € | € | % | € | % | ||
| B-E | Industry | 4.34 | 4.93 | 4.68 | 4.76 | 4.95 | 5.21 | 5.01 | -0.20 | -3.8 | +0.06 | +1.2 |
| F | Construction | 2.26 | 2.29 | 2.41 | 2.37 | 2.55 | 2.57 | 2.57 | - | - | +0.02 | +0.8 |
| G | Wholesale and retail trade; repair of motor vehicles and motorcycles | 2.53 | 2.52 | 2.69 | 2.71 | 2.71 | 2.95 | 2.80 | -0.15 | -5.1 | +0.09 | +3.3 |
| H | Transportation and storage | 4.48 | 3.59 | 3.42 | 3.50 | 3.60 | 3.47 | 3.37 | -0.10 | -2.9 | -0.23 | -6.4 |
| I | Accommodation and food services | 1.13 | 1.08 | 1.28 | 1.31 | 1.30 | 1.31 | 1.34 | +0.03 | +2.3 | +0.04 | +3.1 |
| J | Information and communication | 6.09 | 7.32 | 5.99 | 6.43 | 6.39 | 7.33 | 6.49 | -0.84 | -11.5 | +0.10 | +1.6 |
| K-L | Financial, insurance and real estate | 6.69 | 7.48 | 7.53 | 8.03 | 7.50 | 7.28 | 8.20 | +0.92 | +12.6 | +0.70 | +9.3 |
| M | Professional, scientific and technical activities | 4.09 | 4.04 | 4.17 | 3.88 | 4.09 | 4.44 | 4.30 | -0.14 | -3.2 | +0.21 | +5.1 |
| N | Administrative and support services | 2.14 | 2.31 | 2.51 | 2.32 | 2.59 | 2.37 | 2.59 | +0.22 | +9.3 | - | - |
| O | Public administration and defence | 2.01 | 2.09 | 2.09 | 2.16 | 2.19 | 2.15 | 2.11 | -0.04 | -1.9 | -0.08 | -3.7 |
| P | Education | 3.40 | 3.52 | 3.52 | 3.48 | 3.61 | 3.63 | 3.62 | -0.01 | -0.3 | +0.01 | +0.3 |
| Q | Human health and social work | 2.36 | 2.37 | 2.42 | 2.43 | 2.44 | 2.46 | 2.44 | -0.02 | -0.8 | - | - |
| R-S | Arts, entertainment, recreation and other service activities | 3.04 | 3.54 | 3.12 | 3.43 | 2.98 | 2.24 | 2.76 | +0.52 | +23.2 | -0.22 | -7.4 |
| Total | 3.25 | 3.45 | 3.40 | 3.45 | 3.48 | 3.55 | 3.52 | -0.03 | -0.8 | +0.04 | +1.1 | |
| Public/Private Sector¹ | ||||||||||||
| Private sector | 3.36 | 3.60 | 3.55 | 3.59 | 3.59 | 3.67 | 3.65 | -0.02 | -0.5 | +0.06 | +1.7 | |
| Public sector | 2.94 | 2.98 | 2.95 | 3.01 | 3.12 | 3.13 | 3.10 | -0.03 | -1.0 | -0.02 | -0.6 | |
| Size of Enterprise | ||||||||||||
| Less than 50 employees | 2.41 | 2.57 | 2.56 | 2.44 | 2.52 | 2.52 | 2.53 | +0.01 | +0.4 | +0.01 | +0.4 | |
| 50-250 employees | 3.33 | 3.33 | 3.28 | 3.39 | 3.43 | 3.45 | 3.48 | +0.03 | +0.9 | +0.05 | +1.5 | |
| Greater than 250 employees | 3.80 | 4.12 | 4.04 | 4.15 | 4.16 | 4.30 | 4.20 | -0.10 | -2.3 | +0.04 | +1.0 | |
| ¹ For additional Public/Private data see StatBank table EHQ08. | ||||||||||||
| * Preliminary Estimates | ||||||||||||
| Table 6b Average hourly benefits in kind (BIK) by economic sector and other characteristics and quarter¹ | ||||||||||||
| NACE Principal Activity | 2012 | 2013 | 2014 | 2015 | 2016 | 2016 | 2017 | Quarterly change | Annual change | |||
| Q1 | Q1 | Q1 | Q1 | Q1 | Q4 | Q1* | ||||||
| € | € | € | € | € | € | € | € | % | € | % | ||
| B-E | Industry | 0.25 | 0.24 | 0.25 | 0.20 | 0.26 | 0.30 | 0.19 | -0.11 | -36.7 | -0.07 | -26.9 |
| F | Construction | 0.09 | 0.06 | 0.06 | 0.05 | 0.05 | 0.11 | 0.10 | -0.01 | -9.1 | +0.05 | +100.0 |
| G | Wholesale and retail trade; repair of motor vehicles and motorcycles | 0.21 | 0.22 | 0.26 | 0.24 | 0.24 | 0.31 | 0.26 | -0.05 | -16.1 | +0.02 | +8.3 |
| H | Transportation and storage | 0.11 | 0.15 | 0.12 | 0.13 | 0.11 | 0.08 | 0.08 | - | - | -0.03 | -27.3 |
| I | Accommodation and food services | 0.02 | 0.01 | 0.02 | 0.02 | 0.01 | 0.02 | 0.02 | - | - | +0.01 | +100.0 |
| J | Information and communication | 0.79 | 0.48 | 0.91 | 0.91 | 0.99 | 1.93 | 1.21 | -0.72 | -37.3 | +0.22 | +22.2 |
| K-L | Financial, insurance and real estate | 0.31 | 0.35 | 0.48 | 0.53 | 0.38 | 0.29 | 0.44 | +0.15 | +51.7 | +0.06 | +15.8 |
| M | Professional, scientific and technical activities | 0.31 | 0.45 | 0.34 | 0.19 | 0.38 | 0.45 | 0.43 | -0.02 | -4.4 | +0.05 | +13.2 |
| N | Administrative and support services | 0.09 | 0.18 | 0.13 | 0.12 | 0.27 | 0.15 | 0.19 | +0.04 | +26.7 | -0.08 | -29.6 |
| O | Public administration and defence | 0.01 | 0.01 | 0.01 | 0.01 | 0.01 | 0.01 | 0.00 | -0.01 | - | -0.01 | - |
| P | Education | 0.01 | 0.02 | 0.01 | 0.00 | 0.01 | 0.01 | 0.00 | -0.01 | - | -0.01 | - |
| Q | Human health and social work | 0.01 | 0.01 | 0.01 | 0.01 | 0.01 | 0.01 | 0.01 | - | - | - | - |
| R-S | Arts, entertainment, recreation and other service activities | 0.85 | 0.67 | 0.69 | 1.08 | 0.73 | 0.14 | 0.59 | +0.45 | +321.4 | -0.14 | -19.2 |
| Total | 0.18 | 0.18 | 0.21 | 0.20 | 0.21 | 0.25 | 0.21 | -0.04 | -16.0 | - | - | |
| Public/Private Sector² | ||||||||||||
| Private sector | 0.24 | 0.23 | 0.27 | 0.25 | 0.27 | 0.31 | 0.27 | -0.04 | -12.9 | - | - | |
| Public sector | 0.01 | 0.01 | 0.01 | 0.01 | 0.01 | 0.01 | 0.01 | - | - | - | - | |
| Size of Enterprise | ||||||||||||
| Less than 50 employees | 0.20 | 0.19 | 0.21 | 0.14 | 0.15 | 0.15 | 0.16 | +0.01 | +6.7 | +0.01 | +6.7 | |
| 50-250 employees | 0.20 | 0.19 | 0.20 | 0.21 | 0.25 | 0.19 | 0.22 | +0.03 | +15.8 | -0.03 | -12.0 | |
| Greater than 250 employees | 0.16 | 0.17 | 0.20 | 0.23 | 0.23 | 0.33 | 0.24 | -0.09 | -27.3 | +0.01 | +4.3 | |
| ¹ Average hourly benefits in kind (BIK) are a sub-component of average hourly other labour costs as set out in Table 6a. BIK is considered an income rather than an other labour cost by Eurostat and in Structure of Earnings Statistics | ||||||||||||
| ² For additional Public/Private data see StatBank table EHQ08. | ||||||||||||
| * Preliminary Estimates | ||||||||||||
| Table 6c Average hourly total labour costs by economic sector and other characteristics and quarter¹ | ||||||||||||
| NACE Principal Activity | 2012 | 2013 | 2014 | 2015 | 2016 | 2016 | 2017 | Quarterly change | Annual change | |||
| Q1 | Q1 | Q1 | Q1 | Q1 | Q4 | Q1* | ||||||
| € | € | € | € | € | € | € | € | % | € | % | ||
| B-E | Industry | 26.61 | 26.99 | 27.51 | 27.49 | 28.01 | 27.67 | 28.51 | +0.84 | +3.0 | +0.50 | +1.8 |
| F | Construction | 20.81 | 20.61 | 21.66 | 21.57 | 22.21 | 22.99 | 22.73 | -0.26 | -1.1 | +0.52 | +2.3 |
| G | Wholesale and retail trade; repair of motor vehicles and motorcycles | 19.60 | 19.86 | 20.13 | 20.56 | 20.59 | 21.34 | 20.93 | -0.41 | -1.9 | +0.34 | +1.7 |
| H | Transportation and storage | 24.44 | 23.84 | 23.69 | 23.78 | 24.31 | 25.03 | 24.70 | -0.33 | -1.3 | +0.39 | +1.6 |
| I | Accommodation and food services | 13.23 | 13.14 | 13.56 | 13.60 | 13.71 | 13.91 | 14.08 | +0.17 | +1.2 | +0.37 | +2.7 |
| J | Information and communication | 34.91 | 35.71 | 34.80 | 36.99 | 37.91 | 36.47 | 36.85 | +0.38 | +1.0 | -1.06 | -2.8 |
| K-L | Financial, insurance and real estate | 36.86 | 38.18 | 39.77 | 39.99 | 40.32 | 36.15 | 41.76 | +5.61 | +15.5 | +1.44 | +3.6 |
| M | Professional, scientific and technical activities | 30.25 | 29.37 | 29.51 | 28.54 | 29.86 | 30.17 | 30.66 | +0.49 | +1.6 | +0.80 | +2.7 |
| N | Administrative and support services | 18.19 | 19.33 | 20.09 | 19.50 | 20.67 | 19.58 | 20.68 | +1.10 | +5.6 | +0.01 | - |
| O | Public administration and defence | 28.42 | 28.60 | 27.64 | 27.82 | 27.55 | 27.35 | 27.27 | -0.08 | -0.3 | -0.28 | -1.0 |
| P | Education | 38.87 | 38.77 | 37.86 | 37.23 | 37.47 | 37.39 | 37.43 | +0.04 | +0.1 | -0.04 | -0.1 |
| Q | Human health and social work | 25.66 | 25.22 | 24.76 | 24.47 | 24.50 | 24.68 | 24.74 | +0.06 | +0.2 | +0.24 | +1.0 |
| R-S | Arts, entertainment, recreation and other service activities | 19.68 | 20.76 | 19.98 | 20.76 | 20.14 | 18.94 | 19.58 | +0.64 | +3.4 | -0.56 | -2.8 |
| Total | 25.50 | 25.68 | 25.77 | 25.77 | 26.00 | 25.71 | 26.20 | +0.49 | +1.9 | +0.20 | +0.8 | |
| Public/Private Sector² | ||||||||||||
| Private sector | 23.33 | 23.68 | 24.06 | 24.10 | 24.48 | 24.11 | 24.72 | +0.61 | +2.5 | +0.24 | +1.0 | |
| Public sector | 31.89 | 32.02 | 31.23 | 31.20 | 31.22 | 31.36 | 31.39 | +0.03 | +0.1 | +0.17 | +0.5 | |
| Size of Enterprise | ||||||||||||
| Less than 50 employees | 20.14 | 20.46 | 21.10 | 20.63 | 20.91 | 21.12 | 21.30 | +0.18 | +0.9 | +0.39 | +1.9 | |
| 50-250 employees | 23.85 | 23.92 | 23.48 | 23.94 | 24.28 | 23.61 | 24.22 | +0.61 | +2.6 | -0.06 | -0.2 | |
| Greater than 250 employees | 29.75 | 30.02 | 29.86 | 29.87 | 30.15 | 29.65 | 30.24 | +0.59 | +2.0 | +0.09 | +0.3 | |
| ¹ Average hourly total labour costs equal the average hourly earnings in Table 2 plus the average hourly other labour costs as set out in Table 6a. | ||||||||||||
| ² For additional Public/Private data see StatBank table EHQ08. | ||||||||||||
| * Preliminary Estimates | ||||||||||||
| Table 7a Employment by economic sector and other characteristics and quarter¹ | ||||||||||
| NACE Principal Activity | 2010 | 2011 | 2012 | 2013 | 2014 | 2015 | 2016 | 2016 | 2017 | |
| Q1 | Q1 | Q1 | Q1 | Q1 | Q1 | Q1 | Q4 | Q1* | ||
| B-E | Industry | 200,100 | 197,900 | 192,800 | 194,400 | 193,600 | 202,900 | 204,400 | 212,700 | 216,600 |
| F | Construction | 77,500 | 64,300 | 62,700 | 54,400 | 60,400 | 73,400 | 81,300 | 89,200 | 93,900 |
| G | Wholesale and retail trade; repair of motor vehicles and motorcycles | 277,900 | 273,000 | 276,400 | 278,500 | 270,300 | 275,200 | 280,200 | 295,000 | 288,200 |
| H | Transportation and storage | 63,200 | 64,500 | 61,000 | 61,600 | 61,100 | 62,500 | 65,700 | 70,600 | 69,600 |
| I | Accommodation and food services | 134,000 | 112,600 | 120,200 | 126,600 | 140,000 | 139,200 | 148,400 | 156,900 | 163,600 |
| J | Information and communication | 55,600 | 51,800 | 55,900 | 55,500 | 58,000 | 59,800 | 62,400 | 64,800 | 66,500 |
| K-L | Financial, insurance and real estate | 92,200 | 86,400 | 87,200 | 86,700 | 85,800 | 88,000 | 87,300 | 89,300 | 89,000 |
| M | Professional, scientific and technical activities | 74,100 | 73,900 | 69,200 | 72,200 | 84,100 | 79,000 | 80,400 | 94,500 | 87,600 |
| N | Administrative and support services | 72,700 | 76,900 | 72,800 | 69,300 | 73,200 | 76,100 | 81,700 | 78,800 | 86,100 |
| O | Public administration and defence | 116,900 | 116,300 | 110,700 | 105,100 | 107,000 | 108,300 | 108,600 | 111,400 | 111,300 |
| P | Education | 132,000 | 131,800 | 131,700 | 130,900 | 133,400 | 137,500 | 136,600 | 140,400 | 141,700 |
| Q | Human health and social work | 212,900 | 215,200 | 216,600 | 225,000 | 222,900 | 225,000 | 227,100 | 235,700 | 234,400 |
| R-S | Arts, entertainment, recreation and other service activities | 45,700 | 50,500 | 48,700 | 47,100 | 43,900 | 48,200 | 50,000 | 52,700 | 50,300 |
| Total | 1,554,800 | 1,515,100 | 1,505,900 | 1,507,200 | 1,533,700 | 1,575,100 | 1,614,200 | 1,691,900 | 1,698,900 | |
| Public/Private Sector² | ||||||||||
| Private sector | 1,148,000 | 1,105,700 | 1,116,700 | 1,129,200 | 1,158,100 | 1,200,600 | 1,227,600 | 1,305,600 | 1,309,700 | |
| Public sector | 406,800 | 409,400 | 389,200 | 378,000 | 375,600 | 374,500 | 386,600 | 386,300 | 389,200 | |
| ¹ It should be noted that the Quarterly National Household Survey (QNHS) is the official source of estimates of employment. The estimated trend in the number of employees refers to QNHS employee estimates, but differs in coverage in certain ways, such as the fact that a person with two jobs could be counted twice in the table and the exclusion of the Agriculture, forestry and fishing sector which is covered by the QNHS. | ||||||||||
| ² For additional Public/Private data see statbank table EHQ08. | ||||||||||
| * Preliminary Estimates | ||||||||||
| Table 7b Job vacancies by economic sector and other characteristics and quarter | ||||||||||
| NACE Principal Activity | 2010 | 2011 | 2012 | 2013 | 2014 | 2015 | 2016 | 2016 | 2017 | |
| Q1 | Q1 | Q1 | Q1 | Q1 | Q1 | Q1 | Q4 | Q1* | ||
| B-E | Industry | 800 | 1,100 | 1,000 | 1,100 | 1,000 | 1,200 | 1,500 | 1,000 | 1,400 |
| F | Construction | 300 | 100 | 500 | 200 | 600 | 1,000 | 400 | 500 | 300 |
| G | Wholesale and retail trade; repair of motor vehicles and motorcycles | 1,400 | 1,300 | 800 | 800 | 1,300 | 2,100 | 1,700 | 2,300 | 1,500 |
| H | Transportation and storage | 200 | 200 | 100 | 100 | 300 | 400 | 200 | 400 | 200 |
| I | Accommodation and food services | 500 | 400 | 400 | 900 | 600 | 1,200 | 1,100 | 1,200 | 1,600 |
| J | Information and communication | 600 | 900 | 1,000 | 800 | 1,100 | 1,600 | 1,500 | 1,100 | 1,100 |
| K-L | Financial, insurance and real estate | 1,100 | 1,500 | 2,300 | 1,800 | 2,100 | 2,100 | 2,300 | 1,700 | 1,900 |
| M | Professional, scientific and technical activities | 300 | 500 | 600 | 800 | 1,000 | 1,300 | 1,400 | 1,700 | 2,400 |
| N | Administrative and support services | 100 | 400 | 500 | 800 | 700 | 800 | 1,000 | 900 | 800 |
| O | Public administration and defence | 400 | 300 | 500 | 500 | 600 | 1,300 | 1,600 | 1,000 | 1,000 |
| P | Education | 200 | 300 | 300 | 400 | 400 | 700 | 400 | 700 | 1,000 |
| Q | Human health and social work | 700 | 700 | 800 | 1,100 | 1,500 | 1,600 | 2,400 | 3,100 | 3,000 |
| R-S | Arts, entertainment, recreation and other service activities | 200 | 600 | 300 | 200 | 300 | 500 | 400 | 300 | 400 |
| Total | 6,800 | 8,100 | 9,200 | 9,500 | 11,300 | 15,700 | 15,700 | 15,900 | 16,700 | |
| Public/Private Sector¹ | ||||||||||
| Private sector | 5,600 | 7,200 | 8,000 | 8,200 | 9,600 | 12,900 | 12,000 | 12,200 | 12,700 | |
| Public sector | 1,200 | 1,000 | 1,200 | 1,300 | 1,800 | 2,800 | 3,700 | 3,600 | 4,000 | |
| ¹ For additional Public/Private data see StatBank table EHQ08. | ||||||||||
| * Preliminary Estimates | ||||||||||
| Table 7c Job vacancy rate by economic sector and other characterisics and quarter | ||||||||||
| NACE Principal Activitity | 2010 | 2011 | 2012 | 2013 | 2014 | 2015 | 2016 | 2016 | 2017 | |
| Q1 | Q1 | Q1 | Q1 | Q1 | Q1 | Q1 | Q4 | Q1* | ||
| % | % | % | % | % | % | % | % | % | ||
| B-E | Industry | 0.4 | 0.5 | 0.5 | 0.5 | 0.5 | 0.6 | 0.7 | 0.5 | 0.7 |
| F | Construction | 0.3 | 0.1 | 0.8 | 0.4 | 1.0 | 1.3 | 0.4 | 0.6 | 0.3 |
| G | Wholesale and retail trade; repair of motor vehicles and motorcycles | 0.5 | 0.5 | 0.3 | 0.3 | 0.5 | 0.8 | 0.6 | 0.8 | 0.5 |
| H | Transportation and storage | 0.3 | 0.3 | 0.2 | 0.2 | 0.5 | 0.6 | 0.3 | 0.5 | 0.3 |
| I | Accommodation and food services | 0.4 | 0.3 | 0.3 | 0.7 | 0.4 | 0.8 | 0.7 | 0.7 | 1.0 |
| J | Information and communication | 1.0 | 1.7 | 1.7 | 1.4 | 1.8 | 2.6 | 2.4 | 1.7 | 1.6 |
| K-L | Financial, insurance and real estate | 1.1 | 1.7 | 2.6 | 2.0 | 2.4 | 2.3 | 2.5 | 1.8 | 2.1 |
| M | Professional, scientific and technical activities | 0.4 | 0.6 | 0.9 | 1.1 | 1.2 | 1.6 | 1.7 | 1.7 | 2.7 |
| N | Administrative and support services | 0.2 | 0.5 | 0.7 | 1.2 | 1.0 | 1.1 | 1.2 | 1.2 | 0.9 |
| O | Public administration and defence | 0.4 | 0.3 | 0.5 | 0.5 | 0.5 | 1.2 | 1.5 | 0.8 | 0.9 |
| P | Education | 0.1 | 0.2 | 0.3 | 0.3 | 0.3 | 0.5 | 0.3 | 0.5 | 0.7 |
| Q | Human health and social work | 0.3 | 0.3 | 0.4 | 0.5 | 0.7 | 0.7 | 1.0 | 1.3 | 1.3 |
| R-S | Arts, entertainment, recreation and other service activities | 0.5 | 1.1 | 0.6 | 0.5 | 0.6 | 1.1 | 0.8 | 0.7 | 0.8 |
| Total | 0.4 | 0.5 | 0.6 | 0.6 | 0.7 | 1.0 | 1.0 | 0.9 | 1.0 | |
| Public/Private Sector¹ | ||||||||||
| Private Sector | 0.5 | 0.6 | 0.7 | 0.7 | 0.8 | 1.1 | 1.0 | 0.9 | 1.0 | |
| Public Sector | 0.3 | 0.2 | 0.3 | 0.4 | 0.5 | 0.8 | 0.9 | 0.9 | 1.0 | |
| ¹ For additional Public/Private data see StatBank table EHQ08. | ||||||||||
| * Preliminary Estimates | ||||||||||
| Table 8a Average weekly earnings by public sector sub-sector and quarter | |||||||||||
| Public sector sub-sector | 2012 | 2013 | 2014 | 2015 | 2016 | 2016 | 2017 | Quarterly change | Annual change | ||
| Q1 | Q1 | Q1 | Q1 | Q1 | Q4 | Q1* | |||||
| € | € | € | € | € | € | € | € | % | € | % | |
| Civil service | 935.26 | 936.86 | 925.06 | 922.23 | 828.68 | 907.82 | 904.24 | -3.58 | -0.4 | +75.56 | +9.1 |
| Defence | 844.68 | 825.97 | 805.43 | 807.82 | 811.03 | 808.95 | 812.35 | +3.40 | +0.4 | +1.32 | +0.2 |
| Garda Siochana | 1,218.26 | 1,245.62 | 1,227.64 | 1,235.67 | 1,206.15 | 1,218.56 | 1,205.58 | -12.98 | -1.1 | -0.57 | - |
| Education | 917.88 | 917.23 | 906.04 | 901.82 | 899.41 | 927.13 | 912.95 | -14.18 | -1.5 | +13.54 | +1.5 |
| Regional bodies | 822.18 | 829.38 | 809.20 | 827.17 | 844.49 | 830.78 | 826.50 | -4.28 | -0.5 | -17.99 | -2.1 |
| Health | 883.15 | 874.48 | 851.64 | 858.23 | 866.31 | 868.42 | 873.93 | +5.51 | +0.6 | +7.62 | +0.9 |
| Semi-state | 982.55 | 977.90 | 992.01 | 992.80 | 1,024.20 | 1,033.52 | 1,025.83 | -7.69 | -0.7 | +1.63 | +0.2 |
| Total public sector | 917.46 | 915.62 | 902.98 | 906.57 | 901.69 | 920.13 | 915.73 | -4.40 | -0.5 | +14.04 | +1.6 |
| Total public sector excluding semi-state bodies | 907.90 | 906.19 | 888.94 | 892.54 | 882.27 | 902.23 | 898.27 | -3.96 | -0.4 | +16.00 | +1.8 |
| Semi-state by sub-sector | |||||||||||
| Non Commercial Semi-state bodies | 1,050.28 | 1,021.26 | 974.70 | 972.68 | 993.70 | 973.41 | 958.56 | -14.85 | -1.5 | -35.14 | -3.5 |
| Commercial Semi-state bodies | 963.22 | 965.81 | 998.30 | 1,000.48 | 1,034.35 | 1,054.71 | 1,049.09 | -5.62 | -0.5 | +14.74 | +1.4 |
| * Preliminary Estimates | |||||||||||
| Table 8b Average hourly earnings by public sector sub-sector and quarter | |||||||||||
| Public sector sub-sector | 2012 | 2013 | 2014 | 2015 | 2016 | 2016 | 2017 | Quarterly change | Annual change | ||
| Q1 | Q1 | Q1 | Q1 | Q1 | Q4 | Q1* | |||||
| € | € | € | € | € | € | € | € | % | € | % | |
| Civil service | 26.75 | 26.96 | 25.57 | 25.58 | 24.92 | 24.94 | 25.03 | +0.09 | +0.4 | +0.11 | +0.4 |
| Defence | 23.73 | 23.13 | 22.59 | 22.74 | 22.80 | 22.79 | 22.80 | +0.01 | - | - | - |
| Garda Siochana | 29.61 | 29.97 | 30.17 | 30.04 | 28.80 | 28.15 | 28.26 | +0.11 | +0.4 | -0.54 | -1.9 |
| Education | 38.52 | 38.93 | 38.01 | 37.43 | 37.55 | 37.63 | 37.71 | +0.08 | +0.2 | +0.16 | +0.4 |
| Regional bodies | 23.64 | 23.90 | 23.17 | 23.23 | 23.48 | 23.50 | 23.26 | -0.24 | -1.0 | -0.22 | -0.9 |
| Health | 26.44 | 26.54 | 25.44 | 25.27 | 25.07 | 25.22 | 25.25 | +0.03 | +0.1 | +0.18 | +0.7 |
| Semi-state | 27.26 | 26.98 | 27.02 | 27.17 | 27.49 | 28.08 | 28.26 | +0.18 | +0.6 | +0.77 | +2.8 |
| Total public sector | 28.96 | 29.04 | 28.29 | 28.19 | 28.10 | 28.23 | 28.29 | +0.06 | +0.2 | +0.19 | +0.7 |
| Total public sector excluding semi-state bodies | 29.25 | 29.41 | 28.52 | 28.38 | 28.21 | 28.26 | 28.30 | +0.04 | +0.1 | +0.09 | +0.3 |
| Semi-state by sub-sector | |||||||||||
| Non Commercial Semi-state bodies | 30.41 | 30.47 | 28.06 | 28.28 | 28.23 | 27.84 | 27.85 | +0.01 | - | -0.38 | -1.3 |
| Commercial Semi-state bodies | 26.40 | 26.10 | 26.66 | 26.78 | 27.27 | 28.16 | 28.40 | +0.24 | +0.9 | +1.13 | +4.1 |
| * Preliminary Estimates | |||||||||||
| Table 8c Average weekly paid hours by public sector sub-sector and quarter | |||||||||||
| Public sector sub-sector | 2012 | 2013 | 2014 | 2015 | 2016 | 2016 | 2017 | Quarterly change | Annual change | ||
| Q1 | Q1 | Q1 | Q1 | Q1 | Q4 | Q1* | |||||
| hours | hours | hours | hours | hours | hours | hours | hours | % | hours | % | |
| Civil service | 35.0 | 34.7 | 36.2 | 36.1 | 33.3 | 36.4 | 36.1 | -0.3 | -0.8 | +2.8 | +8.4 |
| Defence | 35.6 | 35.7 | 35.6 | 35.5 | 35.6 | 35.5 | 35.6 | +0.1 | +0.3 | - | - |
| Garda Siochana | 41.1 | 41.6 | 40.7 | 41.1 | 41.9 | 43.3 | 42.7 | -0.6 | -1.4 | +0.8 | +1.9 |
| Education | 23.8 | 23.6 | 23.8 | 24.1 | 24.0 | 24.6 | 24.2 | -0.4 | -1.6 | +0.2 | +0.8 |
| Regional bodies | 34.8 | 34.7 | 34.9 | 35.6 | 36.0 | 35.4 | 35.5 | +0.1 | +0.3 | -0.5 | -1.4 |
| Health | 33.4 | 33.0 | 33.5 | 34.0 | 34.6 | 34.4 | 34.6 | +0.2 | +0.6 | - | - |
| Semi-state | 36.0 | 36.2 | 36.7 | 36.5 | 37.3 | 36.8 | 36.3 | -0.5 | -1.4 | -1.0 | -2.7 |
| Total public sector | 31.7 | 31.5 | 31.9 | 32.2 | 32.1 | 32.6 | 32.4 | -0.2 | -0.6 | +0.3 | +0.9 |
| Total public sector excluding semi-state bodies | 31.0 | 30.8 | 31.2 | 31.5 | 31.3 | 31.9 | 31.7 | -0.2 | -0.6 | +0.4 | +1.3 |
| Semi-state by sub-sector | |||||||||||
| Non Commercial Semi-state bodies | 34.5 | 33.5 | 34.7 | 34.4 | 35.2 | 35.0 | 34.4 | -0.6 | -1.7 | -0.8 | -2.3 |
| Commercial Semi-state bodies | 36.5 | 37.0 | 37.4 | 37.4 | 37.9 | 37.5 | 36.9 | -0.6 | -1.6 | -1.0 | -2.6 |
| * Preliminary Estimates | |||||||||||
| Table 8d Average hourly earnings excluding irregular earnings by public sector sub-sector and quarter¹ | |||||||||||
| Public sector sub-sector | 2012 | 2013 | 2014 | 2015 | 2016 | 2016 | 2017 | Quarterly change | Annual change | ||
| Q1 | Q1 | Q1 | Q1 | Q1 | Q4 | Q1* | |||||
| € | € | € | € | € | € | € | € | % | € | % | |
| Civil service | 26.24 | 26.47 | 25.09 | 25.09 | 24.40 | 24.43 | 24.52 | +0.09 | +0.4 | +0.12 | +0.5 |
| Defence | 22.78 | 22.20 | 21.89 | 22.08 | 21.97 | 21.86 | 22.02 | +0.16 | +0.7 | +0.05 | +0.2 |
| Garda Siochana | 24.50 | 25.00 | 25.03 | 24.92 | 24.86 | 24.78 | 24.82 | +0.04 | +0.2 | -0.04 | -0.2 |
| Education | 37.94 | 38.37 | 37.67 | 37.07 | 37.28 | 37.09 | 37.40 | +0.31 | +0.8 | +0.12 | +0.3 |
| Regional bodies | 23.00 | 23.25 | 22.48 | 22.49 | 22.71 | 22.75 | 22.47 | -0.28 | -1.2 | -0.24 | -1.1 |
| Health | 24.87 | 24.92 | 24.02 | 23.94 | 23.72 | 23.86 | 23.78 | -0.08 | -0.3 | +0.06 | +0.3 |
| Semi-state | 26.01 | 25.88 | 25.82 | 26.06 | 26.23 | 26.40 | 26.63 | +0.23 | +0.9 | +0.40 | +1.5 |
| Total public sector | 27.71 | 27.81 | 27.17 | 27.10 | 27.05 | 27.07 | 27.16 | +0.09 | +0.3 | +0.11 | +0.4 |
| Total public sector excluding semi-state bodies | 28.00 | 28.16 | 27.42 | 27.30 | 27.20 | 27.20 | 27.26 | +0.06 | +0.2 | +0.06 | +0.2 |
| Semi-state by sub-sector | |||||||||||
| Non Commercial Semi-state bodies | 30.28 | 30.28 | 27.93 | 27.97 | 27.81 | 27.40 | 27.51 | +0.11 | +0.4 | -0.30 | -1.1 |
| Commercial Semi-state bodies | 24.85 | 24.77 | 25.11 | 25.39 | 25.74 | 26.07 | 26.34 | +0.27 | +1.0 | +0.60 | +2.3 |
| ¹ To calculate average hourly irregular earnings subtract values in Table 8d from Table 8b. | |||||||||||
| * Preliminary Estimates | |||||||||||
| Table 8e Public sector employment by sub-sector and quarter¹ | |||||||||
| Public sector sub-sector | 2012 | 2013 | 2014 | 2015 | 2016 | 2016 | 2017 | Annual change | |
| Q1 | Q1 | Q1 | Q1 | Q1 | Q4 | Q1* | |||
| '000 | '000 | '000 | '000 | '000 | '000 | '000 | '000 | % | |
| Civil service | 39.7 | 39.2 | 38.7 | 38.1 | 43.6 | 39.9 | 40.0 | -3.6 | -8.3 |
| Defence | 9.8 | 9.8 | 9.7 | 9.7 | 9.5 | 9.5 | 9.5 | - | - |
| Garda Siochana | 13.7 | 13.3 | 13.0 | 12.8 | 12.8 | 13.2 | 13.0 | +0.2 | +1.6 |
| Education | 111.9 | 110.3 | 111.2 | 110.9 | 112.0 | 112.0 | 112.6 | +0.6 | +0.5 |
| Regional bodies | 33.9 | 32.1 | 33.0 | 32.0 | 32.7 | 33.1 | 33.0 | +0.3 | +0.9 |
| Health | 128.8 | 123.6 | 118.7 | 119.6 | 123.1 | 125.6 | 127.5 | +4.4 | +3.6 |
| Semi-state | 51.4 | 49.7 | 51.2 | 51.4 | 52.8 | 53.1 | 53.5 | +0.7 | +1.3 |
| Total public sector | 389.2 | 378.0 | 375.6 | 374.5 | 386.6 | 386.3 | 389.2 | +2.6 | +0.7 |
| Total public sector excluding semi- state bodies | 337.7 | 328.3 | 324.4 | 323.1 | 333.8 | 333.3 | 335.7 | +1.9 | +0.6 |
| Semi-state by sub-sector | |||||||||
| Non Commercial Semi-state bodies | 10.1 | 9.9 | 12.6 | 12.2 | 12.1 | 12.5 | 12.6 | +0.5 | +4.1 |
| Commercial Semi-state bodies | 41.3 | 39.7 | 38.6 | 39.2 | 40.7 | 40.6 | 40.9 | +0.2 | +0.5 |
| ¹ Source: Earnings, Hours and Employment Costs Survey. Public Sector employment includes all those who received a payment which would include both full-time and part-time employees as well as contract workers. Total public sector numbers are also published by the Department of Public Expenditure and Reform on a quarterly basis. Those differ in coverage from the estimates in Table A1 as Department of Public Expenditure and Reform estimates are based on full-time equivalents which will change over time based on both changes in working hours and number of persons employed. | |||||||||
| * Preliminary Estimates | |||||||||
| Table A1 Estimates of average weekly earnings by broad occupational categories1 | ||||||
| Occupation by NACE groups | 2014 | 2015 | 2016 | Quarterly change | Annual change | |
| Q4 | Q4 | Q3 | Q4 | |||
| € | € | € | € | % | % | |
| Managers, professionals and associated professionals | ||||||
| B-E | 1,454.07 | 1,475.48 | 1,494.94 | 1,501.23 | +0.4 | +1.7 |
| B-N, R-S | 1,259.83 | 1,288.37 | 1,298.46 | 1,316.26 | +1.4 | +2.1 |
| O-Q | 1,153.66 | 1,141.17 | 1,155.75 | 1,159.88 | +0.4 | +1.6 |
| Total (B-S) | 1,173.25 | 1,197.45 | 1,213.26 | 1,223.53 | +0.8 | +2.1 |
| Clerical, sales and service employees | ||||||
| B-E | 721.50 | 770.97 | 770.36 | 783.85 | +1.7 | +1.6 |
| B-N, R-S | 457.90 | 460.87 | 473.03 | 475.33 | +0.5 | +3.0 |
| O-Q | 516.10 | 537.15 | 547.08 | 548.50 | +0.3 | +2.1 |
| Total (B-S) | 468.33 | 470.33 | 482.22 | 484.48 | +0.5 | +2.9 |
| Production, transport, craft and other manual workers | ||||||
| B-E | 693.51 | 710.21 | 713.65 | 718.91 | +0.7 | +1.2 |
| B-N, R-S | 508.92 | 526.25 | 526.81 | 533.82 | +1.3 | +1.4 |
| O-Q | 436.25 | 442.75 | 448.58 | 464.60 | +3.4 | +4.7 |
| Total (B-S) | 495.87 | 501.43 | 502.89 | 511.50 | +1.7 | +2.0 |
| 1 These estimates have been generated using a sub sample of EHECS respondents and therefore caution is advised when interpreting these results. See background notes. | ||||||
| Table A2 Response rates in selected sectors by quarter1 | ||||||||||||||||
| NACE Principal Activity | Employer Response Rate % | Respondent Enterprises Final Q4 2016 | Respondent Enterprises Preliminary Q1 2017 | Employee Response Rate % | ||||||||||||
| Final Q4 2015 | Preliminary Q4 2016 | Final Q4 2016 | Preliminary Q1 2017 | Final Q4 2015 | Preliminary Q4 2016 | Final Q4 2016 | Preliminary Q1 2017 | |||||||||
| B-E | Industry | 64.9 | 54.3 | 64.9 | 55.0 | 724 | 620 | 83.8 | 72.3 | 85.2 | 74.0 | |||||
| F | Construction | 44.0 | 35.7 | 43.1 | 40.9 | 137 | 133 | 70.5 | 60.2 | 71.1 | 58.3 | |||||
| G | Wholesale and retail trade; repair of motor vehicles and motorcycles | 62.8 | 54.6 | 64.9 | 54.8 | 904 | 756 | 78.3 | 71.8 | 85.1 | 77.2 | |||||
| H | Transportation and storage | 59.3 | 43.6 | 55.8 | 43.8 | 159 | 124 | 89.0 | 76.2 | 89.6 | 74.8 | |||||
| I | Accommodation and food services | 52.5 | 42.9 | 54.6 | 45.9 | 477 | 412 | 70.6 | 60.6 | 73.0 | 63.1 | |||||
| J | Information and communication | 67.6 | 62.9 | 71.7 | 55.5 | 248 | 208 | 84.0 | 79.2 | 87.9 | 77.1 | |||||
| K-L | Financial, insurance and real estate | 70.8 | 59.5 | 71.6 | 61.3 | 235 | 204 | 90.3 | 84.2 | 93.4 | 85.3 | |||||
| M | Professional, scientific and technical activites | 57.0 | 50.6 | 61.4 | 55.7 | 293 | 268 | 78.6 | 71.6 | 83.9 | 72.6 | |||||
| N | Administrative and support service activities | 68.8 | 49.2 | 61.8 | 50.6 | 307 | 265 | 88.2 | 73.6 | 85.6 | 75.8 | |||||
| O | Public administration and defence | 90.8 | 79.4 | 87.3 | 88.9 | 117 | 120 | 99.1 | 96.2 | 97.3 | 96.9 | |||||
| P | Education | 69.9 | 65.7 | 75.0 | 69.0 | 183 | 165 | 90.4 | 93.6 | 97.1 | 89.5 | |||||
| Q | Human health and social work | 73.8 | 65.6 | 73.1 | 68.4 | 549 | 519 | 91.1 | 86.0 | 92.5 | 89.0 | |||||
| R-S | Arts, entertainment, recreation and other service activities | 65.2 | 52.2 | 62.5 | 56.4 | 268 | 229 | 86.0 | 70.1 | 84.9 | 76.4 | |||||
| Total | 63.7 | 53.7 | 64.0 | 55.4 | 4,601 | 4,023 | 86.1 | 79.0 | 88.5 | 80.4 | ||||||
| 1 This table presents the response rates achieved by sector. Greater caution should be taken in the interpretation of estimates for sectors with lower response rates as these sectors could be subject to greater revisions if response levels are increased for final estimates. | ||||||||||||||||
| Table A3 Preliminary data versus final data1 | ||||||||||||
| NACE Principal Activity | Preliminary Q4 2016 | Final Q4 2016 | Percentage Change | |||||||||
| Average weekly earnings | Average hourly earnings | Average weekly hours | Average weekly earnings | Average hourly earnings | Average weekly hours | Average weekly earnings | Average hourly earnings | Average weekly hours | ||||
| B-E | Industry | 863.17 | 22.57 | 38.3 | 867.93 | 22.46 | 38.6 | +0.6 | -0.5 | +0.8 | ||
| F | Construction | 750.82 | 20.38 | 36.8 | 751.49 | 20.42 | 36.8 | +0.1 | +0.2 | - | ||
| G | Wholesale and retail trade; repair of motor vehicles and motorcycles | 563.83 | 18.13 | 31.1 | 572.06 | 18.39 | 31.1 | +1.5 | +1.4 | - | ||
| H | Transportation and storage | 769.91 | 21.47 | 35.9 | 772.61 | 21.55 | 35.8 | +0.4 | +0.4 | -0.3 | ||
| I | Accommodation and food services | 339.66 | 12.68 | 26.8 | 335.22 | 12.60 | 26.6 | -1.3 | -0.6 | -0.7 | ||
| J | Information and communication | 1,063.30 | 29.39 | 36.2 | 1,048.15 | 29.13 | 36.0 | -1.4 | -0.9 | -0.6 | ||
| K-L | Financial, insurance and real estate | 1,021.00 | 28.98 | 35.2 | 1,017.38 | 28.87 | 35.2 | -0.4 | -0.4 | - | ||
| M | Professional, scientific and technical activities | 874.13 | 25.72 | 34.0 | 885.17 | 25.73 | 34.4 | +1.3 | - | +1.2 | ||
| N | Administrative and support service | 529.18 | 17.32 | 30.6 | 531.58 | 17.21 | 30.9 | +0.5 | -0.6 | +1.0 | ||
| O | Public administration and defence | 929.42 | 25.22 | 36.8 | 921.77 | 25.20 | 36.6 | -0.8 | -0.1 | -0.5 | ||
| P | Education | 812.76 | 33.78 | 24.1 | 812.63 | 33.76 | 24.1 | - | -0.1 | - | ||
| Q | Human health and social work | 689.29 | 22.28 | 30.9 | 685.15 | 22.22 | 30.8 | -0.6 | -0.3 | -0.3 | ||
| R-S | Arts, entertainment, recreation and other service activities | 474.97 | 16.83 | 28.2 | 475.91 | 16.70 | 28.5 | +0.2 | -0.8 | +1.1 | ||
| Total | 716.07 | 22.16 | 32.3 | 716.86 | 22.15 | 32.4 | +0.1 | - | +0.3 | |||
| Public/Private Sector | ||||||||||||
| Private sector | 658.30 | 20.44 | 32.2 | 660.01 | 20.44 | 32.3 | +0.3 | - | +0.3 | |||
| Public sector | 921.74 | 28.20 | 32.7 | 920.13 | 28.23 | 32.6 | -0.2 | +0.1 | -0.3 | |||
| Size of Enterprise | ||||||||||||
| Less than 50 employees | 574.75 | 18.65 | 30.8 | 573.12 | 18.60 | 30.8 | -0.3 | -0.3 | - | |||
| 50-250 employees | 647.32 | 20.04 | 32.3 | 655.68 | 20.15 | 32.5 | +1.3 | +0.5 | +0.6 | |||
| Greater than 250 employees | 845.51 | 25.31 | 33.4 | 847.39 | 25.35 | 33.4 | +0.2 | +0.2 | - | |||
| 1 See background notes. | ||||||||||||
Introduction
The Earnings, Hours and Employment Costs Survey (EHECS) replaced the four-yearly Labour Costs Survey, and also replaced all other CSO short-term earnings inquiries. The EHECS results are comparable across sectors and include more detail on components of earnings and labour costs than was previously available.
Legislation
The survey information is collected by the Central Statistics Office (CSO) under the S.I. No 140 of 2013 Statistics (Labour Costs Surveys) Order 2013. The information collected is treated as strictly confidential in accordance with the Statistics Act 1993. The survey results meet the requirements for Labour Costs statistics set out in Council Regulation (EC) 530/1999.
Business Register
The CSO’s Business Register provides the register of relevant enterprises for the survey. An enterprise is defined as the smallest legally independent unit.
Business Classification
The business classification used for the EHECS is based on the Statistical Classification of Economic Activities in the European Community (NACE Rev.2). The NACE code of each enterprise included in the survey was determined from the predominant activity of the enterprise, based on information provided in this or other CSO inquiries.
Nace Classification
NACE Rev.2 is the latest classification system for economic activities, updated from NACE Rev 1.1. A major revision of NACE was conducted between 2000 and 2007, in order to ensure that the NACE classification system remained relevant for the economy. The main changes that affected the release were the reclassification of some industrial enterprises from industry to services (principally in the software and publishing sectors) and the inclusion of air conditioning supply, sewerage, water management and remediation activities in industry. See web link to NACE coder.
http://www.cso.ie/px/u/NACECoder/NACE Items/search nace.asp
Coverage
The survey results relate to enterprises in the Nace Rev 2 Sections B–E (Industry), F (Construction), G (Wholesale & retail trade: repair of motor vehicles & motorcycles), H (Transportation & storage), I (Accommodation & food services activities), J (Information & communication), K-L (Financial, insurance & real estate activities), M (Professional, scientific & technical activities), N (Administrative & support services activities), O (Public administration & defence), P (Education), Q (Human health & social work activities) and R-S (Arts, entertainment, recreation & other service activities) with 3 or more employees. The data was collected at the enterprise level.
NACE Rev.2 Sections A (Agriculture, forestry and fishing), T (Activities of households as employers) and U (Activities of extraterritorial organisations and bodies) are not covered in the survey as most employment in these sectors is not enterprise based.
All enterprises with 50 or more employees and a sample of those with 3 to 49 employees are surveyed each quarter. The sample is based on the proportion of companies in each NACE 2 digit economic sectors in the 3 to 49 size classes (3 to 9, 10 to 19 and 20 to 49).
Earnings in the public sector are calculated before the deduction of the pension levy that was introduced in March 2009.
Quarters 1 and 2 of 2011 and 2016 include temporary Census field staff in all outputs. Due to the large numbers involved a table is published which illustrates the effects of the field staff on earnings, hours and employment.
Data Collection
The survey is conducted by post and questionnaires are issued in the last week of the relevant quarter. Some returns are received electronically. All returns are scrutinised for accuracy. Where appropriate, firms are queried by telephone, email or post regarding incompleteness, apparent inconsistencies, etc. Information about the survey is on the CSO website and all questionnaires and instructions are available electronically there.
Differences with discontinued sources
The EHECS is not directly comparable with other discontinued short-term earnings surveys such as the Quarterly Industrial Inquiry (QII), the Quarterly Services Inquiry (QSI) and the Quarterly Earnings and Hours worked in Construction (QEC). The main differences are:
The EHECS collects data on the entire reference quarter while the QII, QSI and QEC only collected data for a reference week in the quarter.
Registered Employment:
Registered employment refers to the employment of respondent enterprises at the end of the reference quarter. For non-respondent enterprises and enterprises not in the sample, registered employment refers to the employment from the Business Register. The Business Register base enterprise employment on data from the latest revenue P35 files. The Business Register has a lag of between 12 and 18 months between the current quarter and the latest revenue P35 file. For this reason the Business Register is not a suitable measure of short term trends in employment. Thus, sectoral registered employment is adjusted to reflect the trends of the QNHS sectoral employment. The QNHS is designed to measure short term changes in employment.
Average Employment
For respondent enterprises average employment refers to the average of the quarters opening employment and closing employment. This variable is used as the denominator in calculating average earnings per person and average paid hours per person.
All Employees
All persons who have a direct employment contract with an enterprise as employees, who receive wages or salaries. Persons not working for salary e.g. family members, directors, partners, outside pieceworker’s, etc. are not considered employees but other persons engaged. These workers are included separately but not used in the calculation of derived variables. All employment figures are rounded to the nearest hundred.
Full-time Employees
Employees whose regular working hours are the same as the collectively agreed or customary hours worked in the enterprise, irrespective of the duration of the employment contract. Full-time employment often comes with benefits that are not typically offered to part-time, temporary, or flexible workers, such as annual leave, sick leave, and health insurance.
Part-time Employees
Employees whose regular working hours are less than the collectively agreed or customary hours worked in the enterprise. The definition of part-time varies from enterprise to enterprise but in general part-time employees work 80% or less of the regular hours of the enterprise.
Apprentices/Trainees
All persons, both full-time or part-time, whose wages or salaries are governed by the fact that they work either under an apprenticeship contract or as part of a training program.
Category of employees by occupation
For some enterprises information was collected separately for three occupational groups. The three groups are:
1. Managers, Administrators, Professionals and Associate Professionals.
2. Clerical, Sales and Service workers.
3. Production, Transport workers, Craft & Tradespersons and other Manual workers.
Wages and Salaries
All wages and salaries payments are gross (i.e. before deduction of income tax and employees’ PRSI contributions and levies such as the public sector pension levy). In the analysis, the total wages and salaries are divided into:
- Regular earnings: payments made regularly at each pay period during the year, excluding all irregular and overtime earnings.
- Overtime earnings: payment for hours worked in excess of normal hours.
- Total earnings excluding irregular earnings: regular earnings + overtime earnings.
- Irregular earnings: bonuses which are not paid regularly at each pay period. For example: end of quarter or year productivity bonus.
- Apprentices/Trainees earnings: total of apprentices & trainees' regular wages and salaries, overtime and irregular bonuses and allowances.
- Total earnings: total of regular earnings, overtime earnings and irregular earnings.
Other Labour Costs
Other labour costs are costs to the employer, in addition to wages and salaries, of employing labour. They include the below categories:
- Statutory social contributions: statutory employers’ PRSI including the social security contributions for apprentices/trainees.
- Non-statutory social contributions: payments made by enterprises on behalf of their employees which include pension fund contributions, life assurance premiums, income continuance insurance as well as other employee related payments.
- Other expenses: other employee related payments e.g. study grants, etc.
- Benefits in kind (BIK); net cost of all goods and services made available to employees by the employer. For example, payments for private use of company cars, stock options & share purchase schemes, voluntary sickness insurance, staff housing and other free or subsidised benefits (e.g. canteen facilities, childcare provision, health costs). BIK is included as earnings by Eurostat for the Labour Costs Survey and the Labour Costs Index.
- Redundancy payments.
- Subsidies and refunds: amounts received by enterprises intended to refund part or all of the cost of wages and salaries and training costs. These may include training subsidies from SOLAS or Job Bridge as well as refunds from the Department of Social Protection (DSP) for sick and maternity leave. These are deducted from the firms’ labour costs in the analysis.
Paid Hours
- Regular paid hours: These are normal working hours of employees, usually specified in the contract of employment and should include paid leave e.g. paid sick leave and annual leave.
- Overtime paid hours: Hours worked in excess of contracted hours.
- Total paid hours: Sum of regular paid hours and overtime paid hours.
Job Vacancies
Respondents are asked to provide the number of job vacancies in their firm as at the last working day of the quarter. A job vacancy is defined as a newly created post, an unoccupied post or post about to become vacant in the near future, where the employer is actively looking for (i.e. advertising, contacting employment agencies, etc.) and willing to recruit a suitable candidate immediately or very soon. The posts must be open to external candidates, although it may be filled by an internal candidate. Due to one off recruitments by individual firms and a low number of firms reporting vacancies, the job vacancies series can be volatile and should be interpreted with caution. Job vacancy information is collected by the Central Statistics Office under EU regulation (EC) No. 453/2008. For more information on job vacancies please see the link below.
http://ec.europa.eu/eurostat/web/labour-market/job-vacancies
Job Vacancy Rate
The job vacancy rate (JVR) measures the proportion of total posts that are vacant, according to the definition of job vacancy above, expressed as a percentage as follows
Job Vacancy Rate = ( Number of job vacancies / Number of occupied jobs + Number of job vacancies ) * 100
National Minimum Wage (NMW)
The National Minimum Wage Act 2000 became law on the 1st April 2000. Enterprises are asked to indicate the number of employees in receipt of the NMW at the end of each quarter. A detailed guide to the Act is available from the Department of Jobs, Enterprise and Innovation at www.djei.ie. Employees earning less than the minimum wage due to age or training status are also included. These rates do not apply to close relatives of the employer or apprentices other than apprentice hairdressers.
Employment
The sum of full-time employees and part-time employees on the last day of the quarter plus the average number of apprentices engaged during the quarter.
Average Weekly Earnings
Total earnings for the quarter divided by the average number of persons employed during the quarter divided by 13 (number of weeks in a quarter).
Average Hourly Earnings
The sum of regular earnings, irregular earnings, and overtime earnings for the quarter divided by total paid hours for the quarter.
Average Hourly Irregular Earnings
Total irregular earnings in the quarter divided by total paid hours for the quarter.
Average Weekly Paid Hours
Total paid hours for the quarter divided by the average number of persons employed during the quarter divided by 13 (number of weeks in a quarter). Unpaid hours worked (including unpaid overtime) and unpaid leave are excluded.
Average Hourly Other Labour Costs
The sum of other labour costs divided by total paid hours for the quarter. Other labour costs include redundancy payments, employers’ contributions to social security, other social costs, benefit in kind and other labour costs. Subsidies and refunds received were deducted.
Average Hourly Total Labour Costs
Hourly labour costs are total labour costs divided by the total number of hours paid during the quarter.
Annual Data
Annualised results are available as a separate release, details of which are available on the CSO website.
http://www.cso.ie/en/releasesandpublications/er/elca/earningsandlabourcostsannualdata2015/
Production of EHECS Data
All enterprises with 50 or more employees are surveyed quarterly as well as a sample of enterprises which have between 3 and 49 employees inclusive. For enterprises with 3 to 49 employees inclusive, a weighting factor (the reciprocal of the sampling fraction) is used to weight the estimates to the total population for both employees and enterprises. The CSO's Business Register forms the basis of the sampling frame used for weighting the sample data to the population. Decay factors are calculated for each size class and sector to adjust the non-sampled element of the register for the respondent non-relevant enterprises.
Imputation is carried out for non-respondents in the greater than 50 employees’ categories. Where an enterprise responded in the previous quarter ratio-imputation is used to estimate figures for the current quarter. For enterprises that did not respond in the previous four quarters a stratum average imputation method is used to estimate the missing variables. These estimates are based on respondent enterprises of a similar size and activity.
After imputation, all enterprises with 50 or more employees are accounted for and included in the final dataset. All enterprises employing between 3 and 49 employees are allocated grossing factors to represent the entire population for their relevant industry sector and size class in the quarter. All enterprises' data are contained in the final quarterly dataset which is tabulated to produce the aggregates which are published in the Earnings and Labour Costs quarterly release.
Interpretation of Results
The series presented in this release and all estimates deriving from the EHECS survey are primarily of use as an indicator of trends in average earnings across different classifications. However, in interpreting the trends and in undertaking direct comparison of the average level of earnings across sectors, some caution in interpretation is warranted. For example, the results presented here are based on raw earnings levels. To get a true picture of differences in earnings levels of different employees, comparisons should take account of differences in the characteristics of employees, such as length of service, educational attainment level, nature of work, etc., none of which are available via EHECS. The additional information available from the National Employment Survey (NES) allows for a more detailed analysis of differences in earnings levels and should be referred to by users seeking more detailed information on earnings determinants than is available from EHECS.
It should be noted that all earnings are gross amounts before deductions for PRSI, tax and other levies. This is particularly relevant to the public sector since March 2009 when the pension levy was introduced.
Changes in the composition of employees in a given sector or group has an effect on the average levels of earnings and paid hours over time. For example, if the proportion of part-time employees increases within a sector then it would be expected that the average weekly earnings and paid hours would fall in that sector even if the hourly pay rates were unchanged. Similarly if the contracted weekly paid hours for a sector increased, this would have no effect on average weekly earnings but would reduce the average hourly earnings of the sector.
Estimated averages do not reflect differences in characteristics of the job or the employees, and since EHECS collects aggregate data from each enterprise it is not possible to correct for such differences using EHECS data.
Seasonal Adjustment
To correct for typical seasonal patterns, the series presented in Table 4 have been seasonally adjusted. Since Quarter 1 2015 seasonal adjustment of earnings and labour costs data is completed by applying the X-13-ARIMA model, developed by the U.S. Census Bureau.
Seasonal adjustment is conducted using the direct approach, where each individual series (average weekly earnings, average weekly paid hours, average hourly earnings, average hourly irregular earnings, average hourly other labour costs and average hourly total labour costs) is independently adjusted for each sector.
As a result of the direct seasonal adjustment approach employed, it should be noted that the sum of any component series may not be equal to seasonally adjusted series to which these components belong. For example, the seasonally adjusted average hourly earnings and seasonally adjusted other labour costs will not necessarily add up to the seasonally adjusted average total labour costs.
The X-13 ARIMA method has the X-11 moving averages process at its core, but builds on this by providing options for pre-treating the series using a regARIMA approach for prior adjustment and series extension. In essence this methodology will estimate seasonal factors while taking account of calendar effects (e.g timing of Easter), outliers, temporary changes and level shifts.
All earnings series are updated quarterly with the entire seasonally adjusted series from Q1 2008 as part of the concurrent approach. A comprehensive review of the seasonal adjustment specification is carried annually where revisions to the entire series are made. Revisions to the series are typically very minor in scale.
Occupational Category Estimates
From Q2 2010 a sub-sample of EHECS respondents has been used to generate earnings and hours estimates by three broad occupational categories.
Results are derived by utilising a matched sample of enterprises between consecutive quarters to generate quarterly updates to the previous quarters earnings. An estimated series is included in table A1. Given the number of enterprises involved it is only possible to produce reliable estimates when the sectors are grouped. Earnings for the broad occupational groups are therefore presented by the following amalgamations:
Review of Preliminary Versus Final Data
A detailed review of preliminary estimates and final data was undertaken to ascertain the extent of change between both sets of results. The review focused on response rates, scale of revision at NACE sectoral level and significant changes in trends. The findings of the review indicate that the preliminary figures can be accepted as a suitable indicator for quarterly trends. Analysis of the results for individual NACE sectors highlighted that the change from preliminary to final data was broadly in the range of plus or minus 5%. However, as response rates can impact on the quality of data at the sectoral level, it is advisable to be aware of this when interpreting preliminary results. In the quarterly release table A3 contains the differences between preliminary and final data for the most recent reported quarter, while table A2 highlights response rates.
Labour Cost Index (LCI)
Results of EHECS are compiled and transmitted to Eurostat for inclusion in the Labour Cost Index. The quarterly Labour Cost Index (LCI) shows the short-term development of the total hourly costs incurred by the employers of maintaining their employees. In other words, the LCI measures the costs arising from the production factor 'labour'. The LCI covers the economic activities of industry and services (including public administration). The reference year of the index is 2008. The labour cost index data is collected by EU Member States and is transmitted to Eurostat. In addition to the index numbers, Eurostat provides annual and quarterly growth rates of labour cost. Further labour cost index information and data is available through the Eurostat website:
http://ec.europa.eu/eurostat/web/labour-market/labour-costs/database
Public Sector Employment
There are two CSO surveys which can potentially provide information on public sector employment. The Quarterly National Household Survey (QNHS) can provide estimates based on all respondents who are in employment being asked whether they work in the public sector or not. The EHECS, which is the source of the quarterly Earnings and Labour Costs data, provides estimates based on responses from the employer. Specifically in the case of EHECS there is a response level of close to 80% for public sector employers over time.
Based on the higher response levels and lower levels of subjectivity associated with EHECS the CSO believes it offers a more reliable source for public sector number estimates over time and the CSO publishes data from EHECS as the primary series on public sector numbers. Table 8e contains the estimates of public sector numbers broken down by the different high level areas within the public sector.
Public Sector Organisations
Public sector organisations consists of the following:
Financial Crisis Related Bodies
Nationalised banks are in temporary public ownership resulting from the financial crisis, their employment and earnings data are excluded from Public Sector earnings and employment figures, this is in order to maintain the stability of the series. Their data is reflected in the appropriate NACE sector.
 Hide Background Notes
Scan the QR code below to view this release online or go to
http://www.cso.ie/en/releasesandpublications/er/elcq/earningsandlabourcostsq42016finalq12017preliminaryestimates/
 Show Table 1 Average weekly earnings by economic sector and other characteristics and quarter
 Hide Table 1 Average weekly earnings by economic sector and other characteristics and quarter