
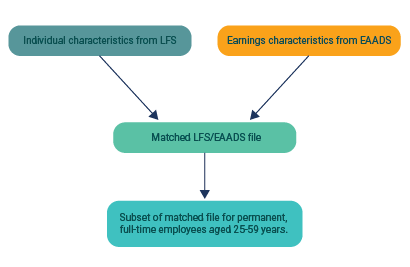
The analysis in this research paper is based on matching the individual characteristics of respondents to the CSO’s Labour Force Survey (LFS) with corresponding earnings data from the Earnings Analysis using Administrative Data Sources (EAADS).
This is a continuation of the approach taken for the 2011-2014 analysis. This approach was taken in the absence of the National Employment Survey (NES), as the CSO sought an alternative source of data which would provide information on the earnings of employees in both the public and private sectors. The LFS provided a consistent source of information on the individual attributes of the employees surveyed, and it was linked to the EAADS to provide information on earnings for each individual employee.
Earnings data was taken from the P35 data used to compile the CSO’s publication Earnings Analysis from Administrative Data Sources (EAADS) which provides analysis of earnings data for PAYE individuals for the period 2015 to 2018. The relevant variables used are:
When creating the EAADS dataset a number of records were removed from the analysis file based on the criteria below:
As some individuals had multiple employments across more than one sector/occupation, it was necessary to identify their principal employment – this was done by selecting the employment with the highest annual earnings on the EAADS file. The impact of this is that in the matching process for 2018, for example, a total of approximately 210,000 secondary employments were dropped from the EAADS file (2.46 million employments). These secondary employments were mainly in the Wholesale & Retail sector, Administrative & Support Services sector and the Health sector (approximately 31,000, 28,000 and 27,000 employments respectively). Also, approximately 14,000 secondary employments were dropped from the Education sector representing instances where employees in this sector receive small additional incomes in the course of teaching duties.
Quarterly data from the LFS was combined to create an annual pooled dataset for each year for the period 2015 to 2018. The dataset only contains persons who are in employment and have no missing values for the variables listed below. Only one record of employment per person is taken.
The following variables were used in order to create a file containing the relevant employee characteristics for matching with the EAADS data:
The CSOPPSN was used as the common identifier between both the LFS and EAADS data. The matched LFS dataset contains the following variables:
|
CSOPPSN |
EAADS/LFS |
|
Gender |
LFS |
|
Public/Private sector status |
EAADS |
|
NACE Principal Business Activity |
EAADS |
|
Age |
LFS |
|
Nationality |
LFS |
|
Gross Annual Earnings |
EAADS |
|
Weeks Worked |
EAADS |
|
Weekly Earnings |
EAADS |
|
Supervisor status |
LFS |
|
Full-time/Part-time status |
LFS |
|
Temporary/Permanent status |
LFS |
|
Shift work status |
LFS |
|
Usual Hours worked |
LFS |
|
Overtime Hours |
LFS |
|
Length of service with current employer |
LFS |
|
Union Membership Status |
LFS |
|
Occupation (UK SOC 10) |
LFS |
|
Grossing Factor |
LFS |
|
Highest level of education |
LFS |
|
Firm Size class (1-99 & 100 +) |
LFS |
The LFS grossing factor was calibrated to the EAADS population using parameters for both:
The public sector pension-related deduction (known as the pension levy) was introduced with effect from 1st March 2009 via the Financial Emergency Measures in the Public Interest Act 2009, which was originally enacted by the Oireachtas in February 2009. The rates and bands have been adjusted on several occasions since they were introduced.
The results of these analyses contained in this report are presented both with and without the public sector pension levy.
The two methods used in this analysis are:
In keeping with other published analysis examining the public/private sector pay differential (including previous analysis of NES data), the models used in this analysis concentrate on permanent, full-time employees aged between 25 and 59 years.
(a) OLS regression
An ordinary least square (OLS) regression was used to model the natural log of weekly earnings on a set of explanatory variables that account for some of the variations in earnings. Details of the OLS methodology are available in Detailed OLS Results chapter. This standard OLS model is widely used in the analysis of gender and public/private wage gaps in both the national and international literature. The approach adopted in this report is similar to that used in Belman and Heywood (2004) and used the following explanatory variables:
* Age-squared was used as an explanatory variable to capture the non-linear relationship between earnings and age.
The approach is sometimes referred to as a hybrid approach (Belman and Heywood (1996), Bender and Elliott (2007)) in that it accounts both for differences in the characteristics of the employees in the two sectors, and for differences in the characteristics of the workplace. Models both including and excluding size of the local unit as an explanatory variable were considered in this analysis.
(b) Quantile Regression
OLS regression is limited in the information that it can provide about earnings as it only estimates average earnings corresponding to the various explanatory variables. Quantile regression is used when an estimate at various points in the distribution is required (quantiles or percentiles) rather than simply estimating the mean. It is widely used in the literature on the public/private sector wage gap as it allows us to examine how the public sector differential varies across the earnings distribution.
Learn about our data and confidentiality safeguards, and the steps we take to produce statistics that can be trusted by all.