
This publication is categorised as a CSO Frontier Series Output. Particular care must be taken when interpreting the statistics in this release as it may use new methods which are under development and/or data sources which may be incomplete, for example new administrative data sources.
Following a recent amendment to Regulation (EU) No 691/2011 on environmental economic accounts, it will be mandatory to report ecosystem accounts to Eurostat in line with SEEA-EA for seven different ecosystem services beginning in 2026. Although a methodology was proposed, the flood control ecosystem service was not included in the amendment so it did not undergo testing by member states (i.e. as no reporting is required). However, given the importance of the service in Ireland, the CSO has elected to develop the methodology and compile accounts. Therefore, Ireland is one of the first countries to test the proposed methodology. At the time of this publication, the methodology is still subject to revision and in some cases, modifications have been made to the proposed methods.
The flood control ecosystem service is based on a geospatial model developed by the European Joint Research Centre. In this model, the service flow of flood control is defined as "the extent of economic assets in floodplains protected by upstream ecosystems and benefitting therefore from the upstream runoff retention (in kilometres squared or hectares)."
It is important to highlight the use of the word ‘protected’ in the above definition. The flood control ecosystem service does not imply that a given economic asset which lies in a floodplain is entirely protected from flood events if it is located downstream of ecosystems, but rather that this economic asset is benefitting from some form of flood mitigation as a result of the presence of upstream ecosystems. It must also be noted that the model does not consider existing flood defence measures such as dams, dykes etc. The flood control service quantifies the ability of ecosystems to provide flood control by themselves, which supports the flood mitigation attributed to any existing defence measures.
The breakdown of the supply of the service is required for each ecosystem type described at level 1 in the new EU ecosystem typology. The use of the service is distributed between different economic units (households, governments and industries) which are classified based on land cover type.
The flood control service is dependent on the directional relationship between the following two factors, Service Providing Areas, and Service Demanding Areas. The locations and extents of these factors are estimated using a geospatial model which incorporates numerous data sources.
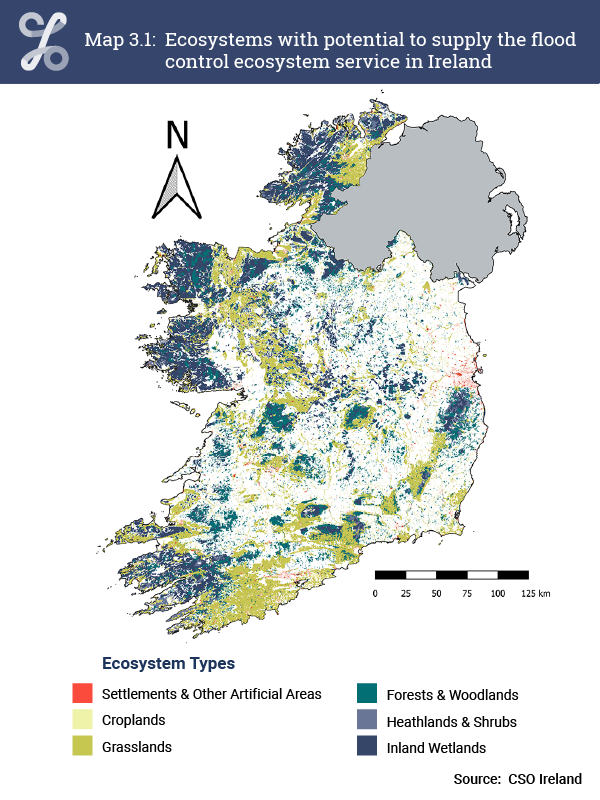
Service Providing Areas are defined as areas where potential for the flood control ecosystem service emerges. These areas are delineated using a potential runoff retention indicator, which is a dimensionless indicator between 0 and 100 which acts as an estimate for how much water runoff is generated at a given location during flooding. Service Providing Areas are defined as areas which meet a defined threshold value of the potential runoff retention indicator. Map 3.1 shows the modelled extent of ecosystems (3.1 million hectares) which could provide flood control.
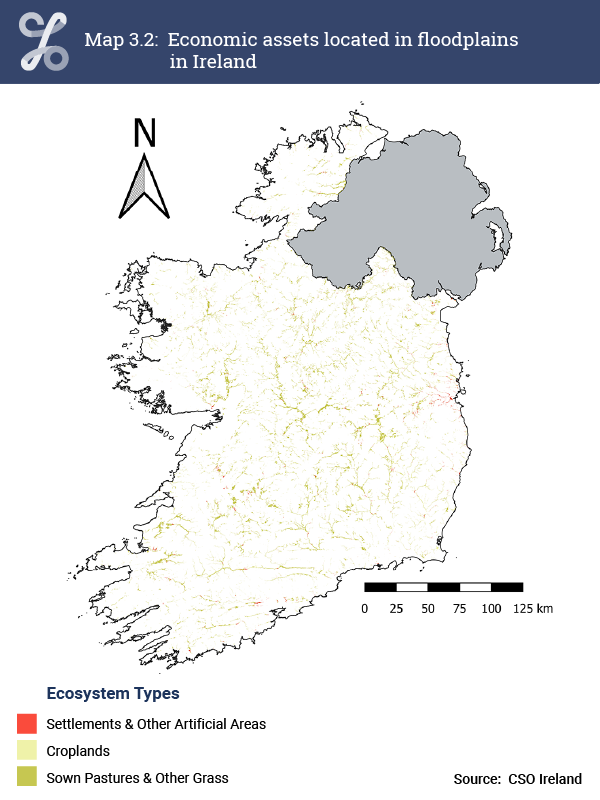
Service Demanding Areas are defined as economic assets which lie in floodplains. Economic assets are identified by the following Ecosystem Types: Settlements & Other Artificial Areas, Croplands, and Sown Pastures & Other Grass. These Ecosystem Types are derived from the EU ecosystem typology which provides a crosswalk from the land covers in the Corine Land Cover dataset into groupings for each ecosystem type. There were 262,800 hectares of economic assets located in floodplains (Map 3.2). This included Settlements & Other Artificial Areas (14,200 hectares), Croplands (16,400 hectares) and Sown Pastures & Other Grass (232,200 hectares).
The flood control service is calculated (in hectares) by considering the portion of the upstream area of the Service Demanding Area which is covered by Service Providing Areas. For example, if we consider the upstream area of a single hectare of the Service Demanding Area and find that half of this area is covered by Service Providing Areas, then half a hectare of economic assets in floodplains are benefitting from flood control by upstream ecosystems. Repeating this procedure for the entire demanding area estimates the total extent of economic assets in floodplains which are benefitting from upstream flood control by upstream ecosystems.
Learn about our data and confidentiality safeguards, and the steps we take to produce statistics that can be trusted by all.