
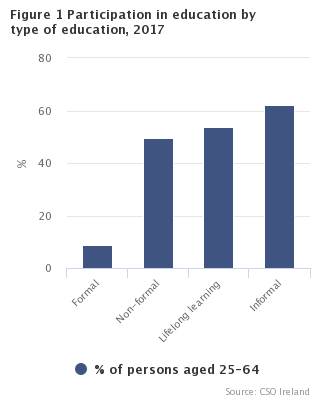
Over half of adults (53.9%) reported participating in lifelong learning (formal and/or non-formal education). Just over one in twelve adults (8.6%) participated in formal education in the last 12 months. Those who were unemployed were over three times more likely to participate in formal education than those in employment (28.2% versus 7.6%). Almost half of adults aged 25-64 (49.7%) received non-formal education. Employed persons were more likely to have participated in non-formal education than those who were unemployed (59.3% versus 38.3%). See Table 1a and Figure 1.
Younger persons are more likely to participate in lifelong learning than older persons. Over six in ten adults (63.4%) aged 25-34 participated in lifelong learning compared with only four in ten (40.5%) aged 55-64. As the highest level of education attained increased so did the participation rates in lifelong learning; only a quarter (24.7%) of those who had attained primary level or below were participating in lifelong learning while the corresponding figure for those who had attained third level honours degree or above was 71.7%. A higher proportion of persons in employment participated in lifelong learning than those who were unemployed (62.6% versus 52.9%).
Fewer than six in ten adults in employment (59.3%) participated in non-formal education while 63.9% received some form of informal education. Professionals were most likely to have participated in lifelong learning with four out of every five adults (81.4%) engaging in formal and/or non-formal education. In contrast, those in the skilled trades were the least likely to participate in lifelong learning with only two out of five adults (41.0%) participating in lifelong learning in the last 12 months. Those working in the Administrative and support services sector were most likely to be in receipt of formal education (14.1%) while those in Transportation and storage sector were the least likely to have participated (2.8%). Those in the Education sector were most likely to be in receipt of non-formal education (76.9%) while those working in the Agriculture, forestry and fishing sector were the least likely (30.6%). See Table 1b.
Over half (55.1%) of those participating in formal education were pursuing third level courses with 17.6% pursuing non-honours degree courses and 37.5% pursuing honours degree or above courses. See Table 2a.
Business, administration and law was the most common field of education for those participating in formal education (27.1%) followed by Health and welfare (18.0%). The most popular reason for participation in formal education was to Improve my career prospects, reported by just over six in ten adults (61.8%), followed by Increase my possibilities of getting/changing a job (41.2%). Almost a third of adults (32.1%) reported that the outcome from their participation in formal education was Better performance in their present job. See Table 2b, Table 2c, Table 2d, Table 2e, Figure 2, Figure 3a and Figure 3b.
| Male | Female | |
| Business, administration and law | 22.7 | 30.1 |
| Health and welfare | 12.3 | 22.1 |
| Other | 13.2 | 11.5 |
| Education | 3.6 | 11.4 |
| Engineering, manufacturingand construction | 13.3 | 2.8 |
| Information and communicationtechnologies | 7.6 | 6.2 |
| Generic programmes and qualifications | 10.3 | 2.5 |
| Art and humanities | 2.6 | 6.2 |
| Natural sciences, mathematics and statistics | 6.8 | 1.6 |
| Agriculture, forestry, fisheries and veterinary | 4.7 | 1.5 |
| Services | 2.3 | 2.1 |
| Social sciences, journalism and information | 0.8 | 2 |
| X-axis label | Male | Female |
|---|---|---|
| To improve my career prospects | 62.4 | 61.4 |
| To increase my possibilities of getting/changing a job | 36.5 | 44.6 |
| To do my job better | 30.1 | 31.1 |
| X-axis label | Male | Female |
|---|---|---|
| To increase knowledge/ skills in a subject of interest | 38.7 | 38.3 |
| To obtain certification | 32.6 | 30.1 |
| To get knowledge/skills useful in everyday life | 27.4 | 25.9 |
Health and Welfare was by far the most common field of education for those participating in non-formal education (34.5%) while Business, administration and law was the next most common field of education (15.7%). The most popular reason for participation in non-formal education was a job-related reason, To do my job better, with six in ten adults (60.2%) reporting it. Interestingly, the most popular outcome for non-formal education was Better performance in present job with 61.2% choosing it. It was three times higher than the next popular outcome which was Personal related reasons at 16.8%. See Table 3a, Table 3b, Table 3c, Table 3d, Table 3e and Figure 4.
| Male | Female | |
| Health and welfare | 26.3 | 42 |
| Business, administration and law | 16.4 | 15.1 |
| Information and communication technologies | 12.7 | 7.9 |
| Education | 4.7 | 11.6 |
| Services | 9.6 | 6 |
| Engineering, manufacturing and construction | 12.5 | 1.8 |
| Generic programmes and qualifications | 6.5 | 5.8 |
| Art and humanities | 4 | 4.2 |
| Other | 3.2 | 2.7 |
| Agriculture, forestry, fisheries and veterinary | 2.8 | 0.8 |
| Natural sciences, mathematics and statistics | 0.8 | 0.9 |
| Social sciences, journalism and information | 0.5 | 1.2 |
Examining the demand for lifelong learning, we can see that 32.4% of adults had some form of unmet demand, where they either participated in lifelong learning and wanted to participate more (18.9%) or wanted to but did not participate (13.5%). Females are more likely to report some form of unmet demand with 35.8% of females reporting this compared with 29.0% of males. See Table 5a and Figure 5.
| Demand | Male | Female |
|---|---|---|
| Met demand | 36.2 | 33.7 |
| Partially met demand | 17.4 | 20.4 |
| Unmet demand | 11.6 | 15.4 |
| No demand | 34.6 | 30.2 |
Nationally, the most common difficulty to accessing education was Did not have time due to family responsibilities (43.7%). The most popular difficulty to accessing lifelong learning for those aged 25-34 was Training was too expensive or the cost was difficult to afford which was reported by almost one in four (38.9%). Over one in ten adults (11.0%) who were unemployed said that there was No suitable education or training activity available. See Table 5c.
When asked about the main difficulty to accessing lifelong learning, four in ten females (39.9%) reported Did not have time due to family responsibilities as the main difficulty compared to one in five males (21.6%). The main difficulty for males was Training conflicted with work schedule/was organised at inconvenient time reported by over a fifth of men (26.1%). It was only reported as the main difficulty by one in eight females (12.5%). See Table 5d and Figure 6.
| Male | Female | |
| Did not have time due to family responsibilities | 21.6 | 39.9 |
| Training conflicted with work schedule and/or was organised at inconvenient time | 26.1 | 12.5 |
| Training was too expensive or the cost was difficult to afford | 19.3 | 17.2 |
| Respondent's health or age | 5.9 | 7.5 |
| None of the reasons given | 7.5 | 5.4 |
Over six in ten (62.1%) of all persons aged 25-64 reported participating in informal education. Learning using computers (online or offline) was the most popular approach for informal education participation with over four fifths of adults (82.2%) who engaged in informal education reported it. Younger persons are more likely than older persons to learn using a computer with 88.2% of those aged 25-34 selecting this compared to 74.7% of those aged 55-64. Almost one in four (23.5%) of those with a third level honours degree or higher reported to learn using guided tours in museums, historical or natural or industrial sites. This is almost three times more than those with a primary education or below where only 7.9% reported this type of informal learning. See Table 6 and Figure 7.
| X-axis label | Male | Female |
|---|---|---|
| Using computers | 82.9 | 81.4 |
| Using printed materials | 51.9 | 55.4 |
| From a family member, friend or colleague | 36.8 | 36.4 |
| Using televison/ radio/video | 34 | 35.1 |
| Visiting learning centres | 15.8 | 21.6 |
| From a guided tour | 16.1 | 20 |
English was reported as the most popular mother tongue language (87.1%) with Polish (2.5%) and Irish (1.2%) coming second and third respectively. While overall 51.0% of adults reported knowing at least one other language (other than their mother tongue), there is a stark difference when looking at citizenship of the respondent. Over 86% of those who are non-Irish report knowing at least one other language compared to 44.2% of adults with Irish citizenship. See Table 7a, Table 7b and Figure 8.
The most popular other language is Irish where four in ten adults (41.6%) reported it as their best-known second language. This was followed by French and English (20.0% and 16.0% respectively). Even though Irish was reported as the best-known second language, almost two thirds of adults (62.6%) only claim a basic level of skill in the language. In contrast, almost two thirds of adults (63.3%) who claimed English was their best-known second language reported that they were proficient in it. See Table 7c and 7d.
| X-axis label | Male | Female |
|---|---|---|
| No other language | 52.8 | 45.3 |
| One language | 28.5 | 31.1 |
| Two languages | 13.2 | 17.8 |
| Three languages or more | 5.5 | 5.8 |
Participation in lifelong learning among adults in Ireland (53.9%) was higher the EU-28 average of 45.1% and Ireland ranked 6th among the 28 countries. The Netherlands reported the highest participation rate in lifelong learning in 2016 (64.1%) while Romania reported the lowest (7.0%). Participation rates in Ireland were nearly similar for males (53.6%) and females (54.1%). Sweden had the highest rate of female participation in lifelong learning (68.2%) while the Netherlands had the highest male participation at 64.7%. See Table 8a and Figure 9.
| Lifelong learning participation over the last 12 months | EU-28 Average | |
| Netherlands | 64.1 | 45.1 |
| Sweden | 63.8 | 45.1 |
| Austria | 59.9 | 45.1 |
| Hungary | 55.7 | 45.1 |
| Finland | 54.1 | 45.1 |
| Ireland | 53.9 | 45.1 |
| United Kingdom | 52.1 | 45.1 |
| Germany | 52 | 45.1 |
| France | 51.3 | 45.1 |
| Denmark | 50.4 | 45.1 |
| Cyprus | 48.1 | 45.1 |
| Luxembourg | 48.1 | 45.1 |
| Latvia | 47.5 | 45.1 |
| Czech Republic | 46.1 | 45.1 |
| Portugal | 46.1 | 45.1 |
| Slovakia | 46.1 | 45.1 |
| Slovenia | 46.1 | 45.1 |
| Belgium | 45.2 | 45.1 |
| Estonia | 44 | 45.1 |
| Spain | 43.4 | 45.1 |
| Italy | 41.5 | 45.1 |
| Malta | 36.3 | 45.1 |
| Croatia | 31.8 | 45.1 |
| Lithuania | 27.9 | 45.1 |
| Poland | 25.5 | 45.1 |
| Bulgaria | 24.6 | 45.1 |
| Greece | 16.7 | 45.1 |
| Romania | 7 | 45.1 |
Participation in formal education among adults in Ireland (8.6%) was higher than the EU-28 average of 5.8% and Ireland ranked 7th among the 28 countries. Participation rates in formal education in Ireland were higher for females (9.9%) than males (7.2%). Finland reported the highest participation rate in formal education (14.2%) while Slovakia reported the lowest (1.5%). See Table 8b.
Participation in non-formal education among adults in Ireland (49.7%) was higher than the EU-28 average of 42.6% and Ireland ranked 7th among the 28 countries. Participation rates in non-formal education in Ireland were slightly lower for females (49.4%) than males (50.0%). Participation in informal education among adults in Ireland (62.1%) was greater than the EU-28 average of 60.5% and Ireland ranked 20th among the 28 countries. See Table 8c, Table 8d and Figure 10.
| Informal education participation over the last 12 months | EU-28 Average | |
| Cyprus | 96.1 | 60.5 |
| Croatia | 91.9 | 60.5 |
| Portugal | 88.5 | 60.5 |
| Latvia | 82.1 | 60.5 |
| Estonia | 79.6 | 60.5 |
| Austria | 79.3 | 60.5 |
| Sweden | 78.6 | 60.5 |
| Slovakia | 75.1 | 60.5 |
| Italy | 74.4 | 60.5 |
| Netherlands | 73.2 | 60.5 |
| Denmark | 70.8 | 60.5 |
| Czech Republic | 70.2 | 60.5 |
| Finland | 68.7 | 60.5 |
| Luxembourg | 68.7 | 60.5 |
| France | 68.5 | 60.5 |
| United Kingdom | 66.2 | 60.5 |
| Slovenia | 66 | 60.5 |
| Romania | 64.2 | 60.5 |
| Belgium | 62.7 | 60.5 |
| Ireland | 62.1 | 60.5 |
| Spain | 58.7 | 60.5 |
| Bulgaria | 50.8 | 60.5 |
| Greece | 47.2 | 60.5 |
| Germany | 43.5 | 60.5 |
| Malta | 42 | 60.5 |
| Hungary | 40.6 | 60.5 |
| Poland | 31 | 60.5 |
| Lithuania | 22.4 | 60.5 |
| Table 1a Persons aged 25-64, classified by those who participated in an educational activity in the last 12 months, 20171 | ||||||
| % of persons | ||||||
| Demographic profile | Formal | Non-formal | Lifelong learning | Informal | Unweighted Sample | |
| State | 8.6 | 49.7 | 53.9 | 62.1 | 4,863 | |
| Sex | ||||||
| Male | 7.2 | 50.0 | 53.6 | 61.6 | 2,213 | |
| Female | 9.9 | 49.4 | 54.1 | 62.7 | 2,650 | |
| Age group | ||||||
| 25-34 year olds | 14.7 | 56.3 | 63.4 | 69.4 | 828 | |
| 35-44 year olds | 9.6 | 53.7 | 58.3 | 62.0 | 1,391 | |
| 45-54 year olds | 5.9 | 47.3 | 50.0 | 60.9 | 1,371 | |
| 55-64 year olds | 2.9 | 38.9 | 40.5 | 54.9 | 1,273 | |
| Region | ||||||
| Border | 5.4 | 37.7 | 41.5 | 54.9 | 480 | |
| Dublin | 11.9 | 56.8 | 62.6 | 72.1 | 1,251 | |
| Mid-East | 5.4 | 46.6 | 49.7 | 51.9 | 615 | |
| Midland | 5.4 | 51.8 | 54.6 | 45.7 | 252 | |
| Mid-West | 9.5 | 50.3 | 54.1 | 77.8 | 584 | |
| South-East | 8.3 | 44.9 | 48.5 | 57.0 | 426 | |
| South-West | 7.7 | 47.4 | 50.6 | 58.0 | 756 | |
| West | 8.2 | 48.6 | 52.7 | 57.3 | 499 | |
| Highest level of educational attainment | ||||||
| Primary or below | 2.0 | 23.1 | 24.7 | 43.6 | 341 | |
| Lower secondary | 2.0 | 28.0 | 29.6 | 47.9 | 654 | |
| Higher secondary | 4.3 | 39.0 | 41.3 | 55.0 | 941 | |
| Post Leaving Certificate | 7.3 | 48.3 | 52.6 | 63.9 | 799 | |
| Third Level non honours degree | 11.7 | 55.8 | 62.8 | 64.2 | 531 | |
| Third Level honours degree or higher | 13.9 | 66.2 | 71.7 | 72.5 | 1,597 | |
| Principal economic status | ||||||
| At work | 7.6 | 59.3 | 62.6 | 63.9 | 3,469 | |
| Unemployed | 28.2 | 38.3 | 52.9 | 65.6 | 299 | |
| Student | 5.1 | 30.0 | 33.6 | 60.6 | 201 | |
| Home duties | 2.6 | 8.5 | 10.9 | 47.2 | 270 | |
| Other | 4.8 | 17.7 | 21.5 | 55.3 | 623 | |
| Citizenship | ||||||
| Irish | 7.9 | 50.5 | 54.1 | 61.4 | 4,320 | |
| Non-Irish | 12.0 | 45.7 | 52.5 | 65.7 | 543 | |
| Degree of Urbanisation | ||||||
| Densely-populated area | 12.6 | 55.7 | 61.4 | 72.2 | 1,629 | |
| Intermediate area | 6.9 | 47.4 | 50.7 | 49.7 | 969 | |
| Thinly-populated area | 5.9 | 45.7 | 48.9 | 58.9 | 2,265 | |
| Deprivation Index | ||||||
| First Quintile - Very disadvantaged | 11.1 | 49.0 | 55.1 | 63.5 | 925 | |
| Second Quintile - Disadvantaged | 6.8 | 44.3 | 47.7 | 61.1 | 983 | |
| Third Quintile | 7.1 | 46.8 | 49.5 | 59.9 | 928 | |
| Fourth Quintile | 8.1 | 49.6 | 54.4 | 54.6 | 946 | |
| Fifth Quintile (least deprived) | 9.7 | 58.3 | 62.0 | 71.2 | 1,081 | |
| 1 See Background Notes for definition of survey population and lifelong learning. | ||||||
| Table 1b Persons aged 25-64 in employment, classified by those who participated in an educational activity in the last 12 months, 20171 | ||||||
| % of persons | ||||||
| Employment characteristics | Formal | Non-formal | Lifelong learning | Informal | Unweighted Sample | |
| State | 7.6 | 59.3 | 62.6 | 63.9 | 3,469 | |
| Professional status of job | ||||||
| Self-employed without employees | 2.5 | 36.3 | 37.3 | 62.0 | 433 | |
| Self-employed with employees | 3.9 | 47.4 | 49.3 | 61.8 | 183 | |
| Employee | 8.5 | 63.3 | 66.9 | 64.4 | 2,840 | |
| Family worker | *2 | * | * | * | 11 | |
| NACE Principal Activity | ||||||
| A | Agriculture, Forestry and Fishing | 4.2 | 30.6 | 31.0 | 56.5 | 165 |
| B-E | Industry | 7.2 | 58.1 | 61.0 | 58.5 | 387 |
| F | Construction | 2.8 | 45.6 | 47.6 | 60.3 | 221 |
| G | Wholesale and retail trade; repair of motor vehicles and motorcycles | 5.5 | 44.8 | 47.9 | 60.2 | 427 |
| H | Transportation and storage | 2.6 | 60.5 | 60.9 | 53.5 | 153 |
| I | Accommodation and food services | 6.8 | 38.3 | 44.4 | 58.3 | 184 |
| J | Information and communication | 7.7 | 72.2 | 75.4 | 65.3 | 179 |
| K-L | Financial, insurance and real estate | 13.8 | 68.4 | 74.3 | 66.6 | 176 |
| M | Professional, scientific and technical activities | 12.1 | 62.7 | 67.7 | 71.8 | 202 |
| N | Administrative and support services | 14.1 | 49.7 | 58.5 | 64.8 | 159 |
| O | Public administration and defence | 7.8 | 72.6 | 75.3 | 66.9 | 213 |
| P | Education | 9.5 | 76.9 | 79.5 | 74.9 | 342 |
| Q | Human health and social work | 8.0 | 76.0 | 77.5 | 67.8 | 488 |
| R-S | Arts, entertainment, recreation and other service activities | 5.0 | 52.8 | 55.7 | 61.9 | 162 |
| Broad occupational group | ||||||
| 1. | Managers, directors and senior officials | 5.3 | 54.3 | 57.1 | 62.5 | 273 |
| 2. | Professionals | 10.4 | 78.6 | 81.4 | 73.1 | 772 |
| 3. | Associate professional and technical | 9.5 | 66.3 | 69.9 | 69.3 | 472 |
| 4. | Administrative and secretarial | 8.0 | 56.4 | 60.8 | 65.2 | 375 |
| 5. | Skilled trades | 3.0 | 39.5 | 41.0 | 56.5 | 514 |
| 6. | Caring, leisure and other services | 9.0 | 68.7 | 72.0 | 62.5 | 303 |
| 7. | Sales and customer service | 8.5 | 49.5 | 52.8 | 62.0 | 208 |
| 8. | Process, plant and machine operatives | 4.8 | 53.9 | 57.3 | 52.2 | 271 |
| 9. | Elementary | 7.1 | 42.4 | 48.0 | 55.7 | 272 |
| Is the job full or part time | ||||||
| Full-time | 7.3 | 61.1 | 63.8 | 64.5 | 2,816 | |
| Part-time | 9.2 | 50.8 | 56.4 | 60.7 | 653 | |
| Length of service in current job | ||||||
| 0 to 1 years | 14.0 | 63.3 | 69.8 | 68.2 | 609 | |
| 2 to 4 years | 9.4 | 58.5 | 63.6 | 67.7 | 631 | |
| 5 to 9 years | 6.4 | 58.0 | 60.0 | 62.4 | 511 | |
| 10 to 14 years | 5.7 | 63.1 | 64.7 | 63.0 | 598 | |
| Over 15 years | 3.1 | 56.5 | 57.4 | 60.5 | 1,085 | |
| 1 See Background Notes for definition of survey population and lifelong learning. | ||||||
| 2 Asterisks * in cells indicate percentages are based on a very small unweighted sample [under 30 observations] and are, therefore, subject to disclosure control. | ||||||
| Table 2a Persons aged 25-64 who participated in formal education, classified by the level of education participation, 20171 | ||||||
| % of persons | ||||||
| Demographic Profile | Higher secondary or below | Post Leaving Certificate | Third Level non honours degree | Third Level honours degree or higher | Unweighted sample | |
| State | 14.6 | 30.3 | 17.6 | 37.5 | 334 | |
| Sex | ||||||
| Male | 17.3 | 23.4 | 25.0 | 34.3 | 122 | |
| Female | 12.7 | 35.2 | 12.4 | 39.7 | 212 | |
| Age group | ||||||
| 25-34 | 15.1 | 20.4 | 22.5 | 42.1 | 106 | |
| 35-44 | 15.1 | 36.7 | 12.2 | 35.9 | 113 | |
| 45-54 | 5.0 | 38.5 | 21.8 | 34.7 | 79 | |
| 55-64 | [32.8]2 | [40.6] | [3.6] | [23.1] | 36 | |
| Highest level of educational attainment | ||||||
| Higher secondary or below | 22.3 | 58.6 | 8.8 | 10.3 | 50 | |
| Post Leaving Certificate | 15.4 | 55.1 | 16.9 | 12.5 | 55 | |
| Third Level non honours degree | [15.8] | [34.7] | [35.4] | [14.1] | 46 | |
| Third Level honours degree or higher | 12.2 | 16.0 | 15.4 | 56.4 | 183 | |
| Principal economic status | ||||||
| At work | 12.3 | 26.4 | 21.5 | 39.8 | 228 | |
| Unemployed | 19.5 | 31.1 | 10.2 | 39.1 | 61 | |
| Other | [17.0] | [55.4] | [11.2] | [16.4] | 45 | |
| Citizenship | ||||||
| Irish | 13.8 | 31.8 | 17.5 | 37.0 | 285 | |
| Non-Irish | [17.4] | [25.4] | [18.2] | [39.0] | 49 | |
| Degree of Urbanisation | ||||||
| Densely-populated area | 14.5 | 22.7 | 19.1 | 43.7 | 156 | |
| Intermediate area | 10.4 | 40.7 | 23.9 | 24.9 | 55 | |
| Thinly-populated area | 17.0 | 38.7 | 11.7 | 32.6 | 123 | |
| Deprivation Index - by quintile | ||||||
| First Quintile - Very disadvantaged | 15.7 | 37.1 | 19.4 | 27.8 | 69 | |
| Second Quintile - Disadvantaged | 14.6 | 22.9 | 17.9 | 44.6 | 52 | |
| Third Quintile - Average | 11.2 | 41.8 | 18.9 | 28.1 | 59 | |
| Fourth Quintile - Affluent | 17.1 | 24.5 | 17.3 | 41.0 | 61 | |
| Fifth Quintile - Very affluent | 13.7 | 24.7 | 15.0 | 46.7 | 93 | |
| 1 See Background Notes for definition of survey population. Participation in the formal education occurred in the 12 months prior to the interview. | ||||||
| 2 Figures in parentheses [ ] indicate percentages are based on a small unweighted sample [between 30 and 50] and are, therefore, subject to a wide margin of error. | ||||||
| Table 2b Persons aged 25-64 who participated in formal education, classified by the field of education participation, 20171 | ||||||||||||||
| % of persons | ||||||||||||||
| Demographic Profile | Generic programmes and qualifications | Education | Art and humanities | Social sciences, journalism and information | Business, administration and law | Natural sciences, mathematics and statistics | Information and communication technologies | Engineering, manufacturing and construction | Agriculture, forestry, fisheries and veterinary | Health and welfare | Services | Other2 | Unweighted sample | |
| State | 5.7 | 8.2 | 4.7 | 1.5 | 27.1 | 3.7 | 6.7 | 7.1 | 2.8 | 18.0 | 2.2 | 12.2 | 334 | |
| Sex | ||||||||||||||
| Male | 10.3 | 3.6 | 2.6 | 0.8 | 22.7 | 6.8 | 7.6 | 13.3 | 4.7 | 12.3 | 2.3 | 13.2 | 122 | |
| Female | 2.5 | 11.4 | 6.2 | 2.0 | 30.1 | 1.6 | 6.2 | 2.8 | 1.5 | 22.1 | 2.1 | 11.5 | 212 | |
| Age group | ||||||||||||||
| 25-34 | 6.6 | 8.1 | 1.7 | 0.6 | 30.0 | 5.9 | 10.4 | 8.9 | 1.8 | 15.2 | 1.4 | 9.3 | 106 | |
| 35-44 | 6.8 | 8.4 | 7.8 | 0.6 | 28.6 | 1.5 | 2.9 | 6.5 | 5.5 | 15.2 | 0.9 | 15.3 | 113 | |
| 45-54 | 2.2 | 9.9 | 3.5 | 2.2 | 20.5 | 4.1 | 6.4 | 5.4 | 0.0 | 27.1 | 6.4 | 12.3 | 79 | |
| 55-64 | [3.3]3 | [2.8] | [11.2] | [9.4] | [17.7] | [0.0] | [3.8] | [3.4] | [3.5] | [26.8] | [2.8] | [15.3] | 36 | |
| Highest level of educational attainment | ||||||||||||||
| Higher secondary or below | 6.8 | 13.4 | 5.2 | 0.0 | 11.2 | 3.6 | 2.6 | 12.7 | 3.7 | 17.5 | 5.2 | 18.1 | 50 | |
| Post Leaving Certificate | 3.4 | 7.4 | 4.7 | 1.5 | 25.7 | 4.0 | 6.9 | 8.9 | 4.4 | 17.5 | 2.8 | 12.9 | 55 | |
| Third Level non honours degree | [0.0] | [3.2] | [7.5] | [2.8] | [30.4] | [2.3] | [10.0] | [6.4] | [0.8] | [19.8] | [1.0] | [15.8] | 46 | |
| Third Level honours degree or higher | 7.4 | 8.4 | 3.8 | 1.5 | 30.5 | 4.1 | 6.9 | 5.5 | 2.8 | 17.8 | 1.6 | 9.7 | 183 | |
| Principal economic status | ||||||||||||||
| At work | 4.6 | 7.8 | 3.1 | 1.8 | 30.1 | 2.3 | 6.7 | 9.4 | 3.0 | 18.2 | 2.0 | 11.0 | 228 | |
| Unemployed | 7.3 | 8.6 | 9.8 | 1.2 | 19.6 | 8.6 | 6.5 | 3.1 | 2.5 | 17.1 | 1.6 | 14.3 | 61 | |
| Other | [8.5] | [9.6] | [2.0] | [0.0] | [26.4] | [0.0] | [7.8] | [2.6] | [2.6] | [20.0] | [5.1] | [15.4] | 45 | |
| Citizenship | ||||||||||||||
| Irish | 4.5 | 9.1 | 4.6 | 1.9 | 27.0 | 2.8 | 3.7 | 7.6 | 3.7 | 22.0 | 1.9 | 11.2 | 285 | |
| Non-Irish | [9.5] | [4.9] | [5.0] | [0.0] | [27.2] | [6.8] | [17.1] | [5.5] | [0.0] | [4.9] | [3.1] | [15.9] | 49 | |
| Degree of Urbanisation | ||||||||||||||
| Densely-populated area | 7.6 | 6.6 | 7.3 | 1.3 | 32.4 | 5.0 | 9.5 | 5.0 | 0.0 | 10.6 | 2.7 | 12.1 | 156 | |
| Intermediate area | 0.8 | 18.3 | 1.2 | 0.0 | 17.7 | 5.7 | 5.6 | 7.9 | 7.7 | 24.0 | 1.9 | 9.2 | 55 | |
| Thinly-populated area | 4.7 | 5.9 | 1.8 | 2.7 | 22.1 | 0.5 | 2.4 | 10.6 | 5.5 | 28.4 | 1.4 | 14.0 | 123 | |
| Deprivation Index | ||||||||||||||
| First Quintile - Very disadvantaged | 5.6 | 8.6 | 8.4 | 0.8 | 25.6 | 2.9 | 10.3 | 0.0 | 5.5 | 17.0 | 1.6 | 13.6 | 69 | |
| Second Quintile - Disadvantaged | 3.8 | 5.6 | 2.1 | 1.7 | 18.6 | 0.0 | 8.7 | 13.7 | 3.9 | 27.4 | 1.7 | 12.6 | 52 | |
| Third Quintile - Average | 6.3 | 11.5 | 0.5 | 2.8 | 21.0 | 2.0 | 10.1 | 14.0 | 3.1 | 16.0 | 1.9 | 10.7 | 59 | |
| Fourth Quintile - Affluent | 2.6 | 9.4 | 2.3 | 1.7 | 30.5 | 4.8 | 2.4 | 8.5 | 0.3 | 18.1 | 4.4 | 14.9 | 61 | |
| Fifth Quintile - Very affluent | 9.0 | 6.1 | 7.1 | 1.0 | 35.3 | 7.4 | 2.8 | 4.9 | 1.2 | 14.4 | 1.4 | 9.4 | 93 | |
| 1 See Background Notes for definition of survey population. Field of education refers to post secondary courses only. | ||||||||||||||
| 2 Other includes formal educational courses unable to code and not stated. | ||||||||||||||
| 3 Figures in parentheses [ ] indicate percentages are based on a small unweighted sample [between 30 and 50] and are, therefore, subject to a wide margin of error. | ||||||||||||||
| Table 2c Persons aged 25-64 who participated in formal education, classified by the reason for education participation, 20171,2 | |||||||||||||
| % of persons | |||||||||||||
| Demographic Profile | To do my job better | To improve my career prospects | To be less likely to lose my job | To increase my possibilities of getting a job, or changing a job/profession | To start my own business | I was obliged to participate | To get knowledge/skills useful in my everyday life | To increase my knowledge/skills on a subject that interests me | To obtain certification | To meet people/for fun | Other3 | Unweighted sample | |
| State | 30.7 | 61.8 | 3.7 | 41.2 | 3.8 | 4.3 | 26.5 | 38.5 | 31.1 | 6.2 | 2.2 | 334 | |
| Sex | |||||||||||||
| Male | 30.1 | 62.4 | 3.9 | 36.5 | 4.3 | 5.1 | 27.4 | 38.7 | 32.6 | 5.1 | 0.0 | 122 | |
| Female | 31.1 | 61.4 | 3.5 | 44.6 | 3.6 | 3.7 | 25.9 | 38.3 | 30.1 | 7.0 | 3.8 | 212 | |
| Age group | |||||||||||||
| 25-34 | 34.1 | 63.0 | 4.7 | 40.0 | 3.3 | 5.0 | 24.0 | 35.7 | 34.0 | 2.6 | 3.4 | 106 | |
| 35-44 | 26.7 | 71.8 | 1.5 | 42.8 | 2.6 | 3.0 | 25.0 | 36.2 | 25.1 | 5.7 | 1.1 | 113 | |
| 45-54 | 34.0 | 52.5 | 6.6 | 46.4 | 7.2 | 5.0 | 30.7 | 46.2 | 42.7 | 12.1 | 2.1 | 79 | |
| 55-64 | [20.5]4 | [29.5] | [0.0] | [28.4] | [4.6] | [4.4] | [39.2] | [47.5] | [13.0] | [16.3] | [0.9] | 36 | |
| Highest level of educational attainment | |||||||||||||
| Higher secondary or below | 24.3 | 56.5 | 3.2 | 37.7 | 6.1 | 0.6 | 23.0 | 31.9 | 31.2 | 13.1 | 0.7 | 50 | |
| Post Leaving Certificate | 21.2 | 62.4 | 3.3 | 48.2 | 3.7 | 7.7 | 20.8 | 37.5 | 24.4 | 7.1 | 0.0 | 55 | |
| Third Level non honours degree | [31.7] | [63.1] | [0.5] | [45.2] | [1.8] | [3.2] | [26.2] | [48.9] | [41.1] | [8.3] | [0.0] | 46 | |
| Third Level honours degree or higher | 34.3 | 62.6 | 4.7 | 39.4 | 3.9 | 4.7 | 28.9 | 37.6 | 30.2 | 3.7 | 3.7 | 183 | |
| Principal economic status | |||||||||||||
| At work | 41.6 | 64.4 | 4.1 | 34.1 | 1.8 | 6.4 | 23.0 | 37.1 | 30.9 | 4.3 | 0.7 | 228 | |
| Unemployed | 12.7 | 59.3 | 3.8 | 58.7 | 8.1 | 0.0 | 39.5 | 48.4 | 38.0 | 8.4 | 6.6 | 61 | |
| Other | [3.4] | [50.2] | [0.0] | [43.2] | [6.6] | [1.3] | [15.0] | [20.3] | [13.5] | [13.3] | [0.7] | 45 | |
| Citizenship | |||||||||||||
| Irish | 30.1 | 61.4 | 2.5 | 39.4 | 4.1 | 5.6 | 22.6 | 37.3 | 31.2 | 7.8 | 1.2 | 285 | |
| Non-Irish | [32.7] | [63.3] | [7.6] | [47.5] | [2.9] | [0.0] | [39.7] | [42.5] | [30.8] | [0.8] | [5.8] | 49 | |
| Degree of Urbanisation | |||||||||||||
| Densely-populated area | 30.1 | 67.2 | 4.1 | 45.4 | 3.3 | 3.5 | 30.4 | 44.3 | 33.7 | 4.9 | 3.1 | 156 | |
| Intermediate area | 27.3 | 43.1 | 3.4 | 32.9 | 10.4 | 1.5 | 17.9 | 29.6 | 27.5 | 8.5 | 3.0 | 55 | |
| Thinly-populated area | 33.4 | 61.6 | 2.9 | 37.9 | 1.5 | 7.1 | 23.9 | 32.5 | 28.4 | 7.4 | 0.2 | 123 | |
| Deprivation Index | |||||||||||||
| First Quintile - Very disadvantaged | 29.2 | 55.7 | 1.7 | 29.8 | 4.4 | 1.5 | 20.1 | 26.5 | 25.2 | 2.9 | 2.9 | 69 | |
| Second Quintile - Disadvantaged | 23.7 | 56.3 | 0.0 | 40.0 | 0.0 | 5.9 | 21.5 | 27.2 | 16.0 | 3.6 | 8.7 | 52 | |
| Third Quintile - Average | 41.6 | 68.9 | 6.7 | 40.1 | 1.1 | 8.6 | 22.8 | 35.0 | 33.4 | 3.9 | 0.0 | 59 | |
| Fourth Quintile - Affluent | 35.0 | 69.6 | 4.8 | 43.3 | 9.4 | 4.6 | 33.2 | 47.3 | 38.2 | 13.0 | 0.8 | 61 | |
| Fifth Quintile - Very affluent | 26.0 | 60.8 | 5.2 | 53.4 | 3.1 | 3.1 | 33.9 | 53.9 | 40.0 | 7.3 | 0.0 | 93 | |
| 1 See Background Notes for definition of survey population. Participation in formal education occurred in the 12 months prior to the interview. | |||||||||||||
| 2 Note that more than one reason may have been selected by respondents. | |||||||||||||
| 3 Other includes reasons not listed and not stated. | |||||||||||||
| 4 Figures in parentheses [ ] indicate percentages are based on a small unweighted sample [between 30 and 50] and are, therefore, subject to a wide margin of error. | |||||||||||||
| Table 2d Persons aged 25-64 who participated in formal education, classified by outcomes from the education participation, 20171,2 | ||||||||||
| % of persons | ||||||||||
| Demographic Profile | Getting a (new) job | Higher salary/wages | Promotion in the job | New tasks | Better performance in present job | Personal-related reasons | No outcome yet | Other3 | Unweighted sample | |
| State | 22.1 | 13.2 | 11.0 | 16.5 | 32.1 | 23.4 | 29.4 | 6.9 | 334 | |
| Sex | ||||||||||
| Male | 17.5 | 12.4 | 10.9 | 18.7 | 29.5 | 14.6 | 32.2 | 8.1 | 122 | |
| Female | 25.3 | 13.7 | 11.2 | 15.0 | 33.9 | 29.5 | 27.4 | 6.0 | 212 | |
| Age group | ||||||||||
| 25-34 | 28.6 | 21.3 | 14.9 | 18.8 | 35.5 | 23.1 | 23.2 | 5.2 | 106 | |
| 35-44 | 18.6 | 6.5 | 8.1 | 9.4 | 26.9 | 19.4 | 35.4 | 9.7 | 113 | |
| 45-54 | 16.4 | 10.8 | 10.6 | 24.6 | 38.0 | 31.6 | 33.4 | 3.2 | 79 | |
| 55-64 | [12.9]4 | [1.2] | [2.5] | [16.4] | [21.4] | [24.4] | [28.5] | [13.1] | 36 | |
| Highest level of educational attainment | ||||||||||
| Higher secondary or below | 15.3 | 0.0 | 1.5 | 15.8 | 23.4 | 12.9 | 39.4 | 6.2 | 50 | |
| Post Leaving Certificate | 27.7 | 12.3 | 10.6 | 15.7 | 27.7 | 17.1 | 37.8 | 1.7 | 55 | |
| Third Level non honours degree | [14.6] | [16.5] | [15.9] | [14.1] | [30.3] | [28.8] | [21.7] | [12.4] | 46 | |
| Third Level honours degree or higher | 24.4 | 15.8 | 12.2 | 17.5 | 35.8 | 26.2 | 26.8 | 6.8 | 183 | |
| Principal economic status | ||||||||||
| At work | 24.4 | 19.1 | 16.9 | 23.8 | 46.4 | 24.8 | 18.2 | 4.6 | 228 | |
| Unemployed | 19.4 | 2.4 | 0.0 | 1.7 | 7.2 | 22.7 | 49.2 | 9.0 | 61 | |
| Other | [13.7] | [1.2] | [0.0] | [6.0] | [0.0] | [15.0] | [53.3] | [17.1] | 45 | |
| Citizenship | ||||||||||
| Irish | 19.5 | 9.8 | 11.1 | 15.8 | 32.0 | 22.7 | 32.6 | 5.6 | 285 | |
| Non-Irish | [30.7] | [24.5] | [10.7] | [18.7] | [32.5] | [25.9] | [18.4] | [11.1] | 49 | |
| Degree of Urbanisation | ||||||||||
| Densely-populated area | 28.3 | 16.5 | 11.3 | 14.6 | 26.7 | 25.8 | 28.3 | 8.7 | 156 | |
| Intermediate area | 16.2 | 8.7 | 9.6 | 18.8 | 30.6 | 13.2 | 40.0 | 1.0 | 55 | |
| Thinly-populated area | 13.9 | 9.4 | 11.3 | 18.6 | 42.6 | 24.3 | 25.8 | 6.6 | 123 | |
| Deprivation Index | ||||||||||
| First Quintile - Very disadvantaged | 37.4 | 20.1 | 11.9 | 21.4 | 31.7 | 19.2 | 23.7 | 5.6 | 69 | |
| Second Quintile - Disadvantaged | 11.3 | 7.7 | 8.3 | 15.3 | 30.2 | 23.1 | 34.0 | 13.7 | 52 | |
| Third Quintile - Average | 16.0 | 12.1 | 13.5 | 22.9 | 43.2 | 28.2 | 26.3 | 2.7 | 59 | |
| Fourth Quintile - Affluent | 12.8 | 13.9 | 14.9 | 12.9 | 35.0 | 19.3 | 30.8 | 12.7 | 61 | |
| Fifth Quintile - Very affluent | 24.3 | 9.4 | 7.1 | 10.4 | 23.8 | 28.1 | 33.3 | 2.0 | 93 | |
| 1 See Background Notes for definition of survey population. Participation in formal education occurred in the 12 months prior to the interview. | ||||||||||
| 2 Note that more than one outcome may have been selected by respondents. | ||||||||||
| 3 Other includes outcomes not listed and not stated. | ||||||||||
| 4 Figures in parentheses [ ] indicate percentages are based on a small unweighted sample [between 30 and 50] and are, therefore, subject to a wide margin of error. | ||||||||||
| Table 2e Persons aged 25-64 who participated in formal education, classified by details about the formal educational activity, 20171 | ||
| Participation in formal activity in the last 12 months | % of persons | |
| Number of formal education activities participated in during the last 12 months | ||
| One activity | 88.3 | |
| Two activities or more | 11.7 | |
| Method of the most recent formal education activity | ||
| Traditional teaching method (e.g. classroom) | 77.0 | |
| Distance learning | 23.0 | |
| Who paid for the most recent formal education activity | ||
| Fully paid by yourself | 45.1 | |
| Partly paid by yourself and partly paid by somebody else | 11.7 | |
| Fully paid by somebody else | 32.5 | |
| Free actvity | 10.4 | |
| Not stated | 0.2 | |
| Current use of the skills or knowledge acquired from the most recent formal education activity | ||
| A lot | 48.0 | |
| A fair amount | 19.2 | |
| Very little | 12.5 | |
| Not at all | 20.2 | |
| Not stated | 0.1 | |
| Expected use of the skills or knowledge acquired from the most recent formal education activity | ||
| A lot | 79.0 | |
| A fair amount | 15.4 | |
| Very little | 3.3 | |
| Not at all | 1.6 | |
| Not stated | 0.6 | |
| Unweighted sample | 334 | |
| 1 See Background Notes for definition of survey population. | ||
| Table 3a Persons aged 25-64 who participated in non-formal education, classified by the type of non-formal activity, 20171 | |
| Non-formal activity participated in the last 12 months | % of persons |
| Course | 61.7 |
| Workshop/seminar | 31.9 |
| On the job training | 32.4 |
| Private lessons | 9.4 |
| Unweighted sample | 2,315 |
| 1 See Background Notes for definition of survey population. Participation in the non-formal education occurred in the 12 months prior to the interview. Respondents may have selected more than one type of non-formal activity. | |
| Table 3b Persons aged 25-64 who participated in non-formal education, classified by the field of the activity, 20171 | ||||||||||||||
| % of persons | ||||||||||||||
| Demographic Profile | Generic programmes and qualifications | Education | Art and humanities | Social sciences, journalism and information | Business, administration and law | Natural sciences, mathematics and statistics | Information and communication technologies | Engineering, manufacturing and construction | Agriculture, forestry, fisheries and veterinary | Health and welfare | Services | Other2 | Unweighted sample | |
| State | 6.2 | 8.2 | 4.1 | 0.8 | 15.7 | 0.9 | 10.2 | 7.0 | 1.7 | 34.5 | 7.7 | 3.0 | 3,585 | |
| Sex | ||||||||||||||
| Male | 6.5 | 4.7 | 4.0 | 0.5 | 16.4 | 0.8 | 12.7 | 12.5 | 2.8 | 26.3 | 9.6 | 3.2 | 1,660 | |
| Female | 5.8 | 11.6 | 4.2 | 1.2 | 15.1 | 0.9 | 7.9 | 1.8 | 0.8 | 42.0 | 6.0 | 2.7 | 1,925 | |
| Age group | ||||||||||||||
| 25-34 | 7.0 | 9.4 | 4.5 | 1.2 | 14.7 | 0.1 | 12.8 | 6.1 | 1.1 | 29.7 | 9.8 | 3.5 | 698 | |
| 35-44 | 4.6 | 7.6 | 2.9 | 1.0 | 19.3 | 1.0 | 9.5 | 9.1 | 1.0 | 34.4 | 7.1 | 2.5 | 1,163 | |
| 45-54 | 6.7 | 8.2 | 4.3 | 0.4 | 14.2 | 1.1 | 10.4 | 6.6 | 1.6 | 37.5 | 5.8 | 3.1 | 1,014 | |
| 55-64 | 7.0 | 7.4 | 5.6 | 0.6 | 12.2 | 1.4 | 6.3 | 4.5 | 4.8 | 39.2 | 8.1 | 2.7 | 710 | |
| Region | ||||||||||||||
| Border | 3.1 | 6.6 | 5.4 | 0.0 | 5.6 | 0.0 | 9.0 | 5.8 | 1.8 | 48.3 | 11.4 | 3.0 | 247 | |
| Dublin | 8.6 | 6.9 | 5.0 | 1.4 | 24.6 | 0.2 | 13.8 | 6.4 | 0.7 | 25.3 | 5.4 | 1.9 | 1,100 | |
| Mid-East | 6.9 | 7.9 | 2.8 | 0.0 | 15.1 | 1.2 | 11.6 | 7.9 | 1.8 | 31.9 | 8.9 | 4.1 | 427 | |
| Midland | 0.7 | 12.1 | 1.7 | 0.0 | 6.0 | 0.0 | 3.9 | 6.2 | 3.5 | 56.7 | 8.2 | 1.1 | 185 | |
| Mid-West | 2.1 | 6.6 | 2.6 | 0.5 | 9.9 | 0.4 | 7.2 | 8.8 | 2.1 | 43.7 | 10.4 | 5.6 | 445 | |
| South-East | 2.3 | 9.3 | 3.6 | 0.1 | 11.7 | 1.2 | 6.1 | 6.4 | 1.5 | 43.3 | 9.2 | 5.3 | 304 | |
| South-West | 6.2 | 9.3 | 4.7 | 0.9 | 10.2 | 2.0 | 7.7 | 8.1 | 3.4 | 33.3 | 10.4 | 3.8 | 506 | |
| West | 8.2 | 12.3 | 4.0 | 1.6 | 9.7 | 2.8 | 8.5 | 5.9 | 2.5 | 37.3 | 5.8 | 1.4 | 371 | |
| Highest level of educational attainment | ||||||||||||||
| Higher secondary or below | 8.2 | 2.0 | 3.4 | 0.2 | 7.8 | 1.5 | 10.1 | 8.0 | 2.6 | 37.4 | 15.1 | 3.5 | 844 | |
| Post Leaving Certificate | 5.5 | 3.9 | 1.9 | 0.7 | 10.5 | 0.0 | 5.6 | 10.6 | 4.6 | 41.1 | 10.7 | 4.8 | 554 | |
| Third Level non honours degree | 5.5 | 4.2 | 2.9 | 0.2 | 13.0 | 1.6 | 10.5 | 3.6 | 1.1 | 46.2 | 7.1 | 4.1 | 481 | |
| Third Level honours degree or higher | 5.7 | 12.9 | 5.2 | 1.3 | 20.9 | 0.6 | 11.4 | 6.4 | 0.8 | 28.4 | 4.2 | 1.9 | 1,706 | |
| Principal economic status | ||||||||||||||
| At work | 6.2 | 8.3 | 3.5 | 0.9 | 16.0 | 0.8 | 10.0 | 7.4 | 1.7 | 35.2 | 7.5 | 2.6 | 3,213 | |
| Unemployed | 6.9 | 10.1 | 6.0 | 0.0 | 17.6 | 2.3 | 17.8 | 2.5 | 1.7 | 16.3 | 10.5 | 8.2 | 129 | |
| Other | 4.3 | 5.2 | 15.0 | 1.3 | 7.0 | 0.9 | 7.3 | 1.4 | 3.3 | 37.8 | 9.7 | 6.8 | 243 | |
| Citizenship | ||||||||||||||
| Irish | 6.2 | 8.7 | 3.7 | 1.0 | 14.6 | 1.0 | 9.4 | 7.4 | 1.8 | 35.6 | 7.7 | 2.9 | 3,242 | |
| Non-Irish | 5.7 | 5.3 | 6.9 | 0.0 | 22.7 | 0.2 | 15.6 | 3.8 | 1.2 | 27.0 | 8.2 | 3.3 | 343 | |
| Degree of Urbanisation | ||||||||||||||
| Densely-populated area | 7.9 | 6.8 | 5.4 | 1.5 | 21.7 | 0.5 | 13.4 | 6.1 | 0.5 | 28.3 | 5.9 | 2.1 | 1,377 | |
| Intermediate area | 4.4 | 11.6 | 2.5 | 0.7 | 11.8 | 0.7 | 9.5 | 7.2 | 3.7 | 35.0 | 9.1 | 3.8 | 685 | |
| Thinly-populated area | 4.9 | 8.5 | 3.2 | 0.1 | 10.3 | 1.4 | 6.7 | 7.9 | 2.3 | 41.7 | 9.3 | 3.7 | 1,523 | |
| Deprivation Index | ||||||||||||||
| First Quintile - Very disadvantaged | 2.8 | 7.1 | 5.7 | 0.6 | 11.4 | 0.3 | 10.7 | 6.0 | 3.2 | 41.7 | 7.3 | 3.1 | 682 | |
| Second Quintile - Disadvantaged | 5.7 | 12.4 | 3.1 | 0.7 | 11.0 | 0.6 | 8.7 | 8.7 | 2.1 | 34.3 | 10.9 | 1.9 | 645 | |
| Third Quintile - Average | 8.2 | 7.5 | 2.9 | 0.1 | 14.2 | 1.9 | 8.5 | 8.1 | 1.5 | 36.0 | 7.4 | 3.7 | 648 | |
| Fourth Quintile - Affluent | 4.0 | 9.7 | 3.9 | 0.2 | 13.2 | 0.7 | 11.6 | 6.8 | 0.9 | 35.6 | 9.6 | 3.8 | 677 | |
| Fifth Quintile - Very affluent | 9.0 | 5.9 | 4.5 | 2.1 | 24.7 | 0.7 | 11.0 | 5.8 | 1.2 | 27.6 | 4.9 | 2.6 | 933 | |
| 1 See Background Notes for definition of survey population. Field of education refers to post secondary activities only. | ||||||||||||||
| 2 Other includes non-formal educational activities which were unable to code and not stated. | ||||||||||||||
| Table 3c Persons aged 25-64 who participated in non-formal education, classified by the reason for the non-formal activity, 20171,2 | ||||||||||||||||
| % of persons | ||||||||||||||||
| Demographic Profile | To do my job better | To improve my career prospects | To be less likely to lose my job | To increase my possibilities of getting or changing a job | To start own business | Because of organisational/ technological changes at work | Required by the employer/law | To get knowledge/ skills useful in everyday life | To increase knowledge/ skills in a subject of interest | To obtain certification | To meet people/for fun | For health reasons | To do voluntary work better | Other3 | Unweighted sample | |
| State | 60.2 | 25.6 | 4.7 | 12.8 | 2.4 | 10.8 | 36.9 | 27.2 | 25.2 | 14.1 | 4.9 | 6.0 | 1.7 | 1.1 | 3,585 | |
| Sex | ||||||||||||||||
| Male | 62.0 | 29.0 | 5.8 | 14.6 | 3.3 | 12.6 | 38.8 | 26.6 | 23.1 | 16.0 | 4.2 | 4.8 | 1.8 | 0.8 | 1,660 | |
| Female | 58.5 | 22.6 | 3.7 | 11.2 | 1.5 | 9.2 | 35.2 | 27.7 | 27.1 | 12.3 | 5.5 | 7.0 | 1.5 | 1.4 | 1,925 | |
| Age group | ||||||||||||||||
| 25-34 | 61.8 | 37.4 | 6.9 | 20.0 | 4.2 | 11.4 | 33.5 | 29.7 | 29.0 | 14.6 | 6.5 | 5.4 | 0.6 | 0.6 | 698 | |
| 35-44 | 63.0 | 26.2 | 5.0 | 11.5 | 2.1 | 9.9 | 36.6 | 23.8 | 23.3 | 12.5 | 3.5 | 5.5 | 1.5 | 0.9 | 1,163 | |
| 45-54 | 59.6 | 18.5 | 3.1 | 10.0 | 1.2 | 13.2 | 39.3 | 27.3 | 23.0 | 15.9 | 4.4 | 6.4 | 3.0 | 1.8 | 1,014 | |
| 55-64 | 52.0 | 12.8 | 2.4 | 6.2 | 1.2 | 8.0 | 40.3 | 29.5 | 25.5 | 13.8 | 5.5 | 7.7 | 2.2 | 1.4 | 710 | |
| Region | ||||||||||||||||
| Border | 47.3 | 21.6 | 6.3 | 14.7 | 0.2 | 5.6 | 42.2 | 27.5 | 20.5 | 23.3 | 7.6 | 6.4 | 0.4 | 0.0 | 247 | |
| Dublin | 61.8 | 32.9 | 4.3 | 18.4 | 4.3 | 15.3 | 34.0 | 31.6 | 35.2 | 14.3 | 6.2 | 5.2 | 1.5 | 1.0 | 1,100 | |
| Mid-East | 66.9 | 22.6 | 4.5 | 9.1 | 0.5 | 3.9 | 29.0 | 19.1 | 15.2 | 10.8 | 2.9 | 5.4 | 1.6 | 2.7 | 427 | |
| Midland | 46.9 | 14.8 | 5.8 | 7.5 | 0.7 | 8.4 | 47.9 | 28.5 | 24.4 | 19.2 | 2.0 | 12.5 | 2.7 | 0.6 | 185 | |
| Mid-West | 59.5 | 26.4 | 6.1 | 10.4 | 2.2 | 5.9 | 42.4 | 24.5 | 18.8 | 15.9 | 2.8 | 6.0 | 2.0 | 0.4 | 445 | |
| South-East | 58.2 | 17.8 | 3.6 | 7.9 | 2.8 | 10.6 | 38.0 | 24.2 | 14.3 | 6.6 | 4.1 | 5.6 | 1.7 | 2.0 | 304 | |
| South-West | 59.8 | 17.9 | 4.8 | 9.6 | 1.4 | 12.3 | 32.0 | 23.1 | 18.7 | 13.1 | 4.0 | 3.0 | 1.5 | 1.1 | 506 | |
| West | 63.4 | 24.8 | 4.2 | 8.5 | 0.6 | 10.3 | 47.7 | 29.7 | 25.3 | 13.8 | 6.4 | 9.5 | 2.6 | 0.3 | 371 | |
| Highest level of educational attainment | ||||||||||||||||
| Higher secondary or below | 55.2 | 28.6 | 6.4 | 16.7 | 5.6 | 6.8 | 42.3 | 25.7 | 19.2 | 16.7 | 6.4 | 6.2 | 1.5 | 1.2 | 844 | |
| Post Leaving Certificate | 58.1 | 23.9 | 5.8 | 14.3 | 2.0 | 9.0 | 44.8 | 25.7 | 17.8 | 17.6 | 2.4 | 7.9 | 1.3 | 0.5 | 554 | |
| Third Level non honours degree | 59.7 | 21.1 | 3.6 | 9.7 | 0.6 | 6.6 | 42.8 | 29.7 | 23.8 | 16.5 | 2.9 | 7.6 | 2.2 | 1.1 | 481 | |
| Third Level honours degree or higher | 62.9 | 26.2 | 4.1 | 11.8 | 1.7 | 14.0 | 31.1 | 27.5 | 29.9 | 11.4 | 5.5 | 4.9 | 1.7 | 1.2 | 1,706 | |
| Principal economic status | ||||||||||||||||
| At work | 64.2 | 25.2 | 5.1 | 11.1 | 1.4 | 11.7 | 39.9 | 26.2 | 23.6 | 14.4 | 3.5 | 5.6 | 1.3 | 0.7 | 3,213 | |
| Unemployed | 26.4 | 49.6 | 1.2 | 48.8 | 21.1 | 1.3 | 6.6 | 41.3 | 44.0 | 11.0 | 18.5 | 4.6 | 2.3 | 2.3 | 129 | |
| Other | 11.3 | 10.3 | 0.0 | 13.0 | 2.9 | 1.4 | 6.5 | 33.6 | 39.6 | 9.9 | 19.1 | 16.1 | 9.5 | 7.8 | 243 | |
| Citizenship | ||||||||||||||||
| Irish | 59.6 | 23.4 | 4.1 | 11.3 | 2.3 | 10.6 | 38.1 | 27.3 | 24.3 | 14.0 | 4.6 | 5.8 | 1.8 | 1.2 | 3,242 | |
| Non-Irish | 64.0 | 40.0 | 8.7 | 22.7 | 2.6 | 12.3 | 29.2 | 26.5 | 31.1 | 14.8 | 6.6 | 7.5 | 0.8 | 0.5 | 343 | |
| Degree of Urbanisation | ||||||||||||||||
| Densely-populated area | 59.6 | 31.1 | 4.4 | 16.9 | 3.6 | 14.6 | 35.8 | 31.3 | 33.3 | 13.3 | 6.0 | 5.4 | 1.4 | 1.0 | 1,377 | |
| Intermediate area | 62.3 | 19.9 | 5.4 | 9.6 | 1.0 | 6.9 | 33.8 | 24.3 | 18.7 | 13.1 | 2.8 | 5.7 | 1.8 | 2.4 | 685 | |
| Thinly-populated area | 60.0 | 21.7 | 4.8 | 9.4 | 1.5 | 8.0 | 39.6 | 23.5 | 18.4 | 15.4 | 4.5 | 6.9 | 1.9 | 0.6 | 1,523 | |
| Deprivation Index | ||||||||||||||||
| First Quintile - Very disadvantaged | 55.6 | 21.7 | 4.6 | 9.8 | 1.9 | 7.7 | 35.6 | 28.1 | 21.3 | 14.0 | 4.3 | 6.5 | 1.9 | 1.4 | 682 | |
| Second Quintile - Disadvantaged | 57.2 | 21.8 | 4.4 | 8.4 | 1.3 | 11.6 | 38.1 | 20.2 | 22.3 | 13.2 | 3.4 | 3.5 | 1.8 | 1.2 | 645 | |
| Third Quintile - Average | 61.9 | 24.5 | 4.9 | 10.3 | 1.1 | 9.0 | 37.0 | 23.5 | 21.8 | 12.0 | 5.5 | 6.1 | 1.4 | 0.5 | 648 | |
| Fourth Quintile - Affluent | 59.3 | 27.9 | 6.4 | 14.1 | 2.0 | 13.1 | 39.4 | 30.3 | 25.4 | 18.1 | 4.0 | 7.0 | 2.1 | 2.1 | 677 | |
| Fifth Quintile - Very affluent | 64.8 | 30.1 | 3.7 | 18.5 | 4.5 | 12.1 | 35.2 | 31.2 | 31.9 | 13.2 | 6.5 | 6.4 | 1.4 | 0.5 | 933 | |
| 1 See Background Notes for definition of survey population. | ||||||||||||||||
| 2 Note that more than one reason may have been selected by respondents. | ||||||||||||||||
| 3 Other includes non-formal educational activities which were unable to code and not stated. | ||||||||||||||||
| Table 3d Persons aged 25-64 who participated in non-formal education, classified by the outcome of the non-formal activity, 20171,2 | ||||||||||
| % of persons | ||||||||||
| Demographic Profile | Getting a (new) job | Promotion in the job | Higher salary/wages | New tasks | Better performance in present job | Personal-related reasons | No outcome yet | Other3 | Unweighted sample | |
| State | 6.7 | 6.6 | 5.7 | 12.4 | 61.2 | 16.8 | 11.0 | 10.1 | 3,585 | |
| Sex | ||||||||||
| Male | 7.8 | 6.2 | 6.8 | 12.6 | 64.2 | 14.4 | 11.7 | 9.7 | 1,660 | |
| Female | 5.7 | 7.0 | 4.8 | 12.3 | 58.5 | 19.1 | 10.4 | 10.5 | 1,925 | |
| Age group | ||||||||||
| 25-34 | 10.7 | 9.2 | 11.0 | 17.1 | 62.9 | 17.5 | 11.7 | 7.9 | 698 | |
| 35-44 | 7.0 | 7.6 | 5.6 | 13.0 | 61.2 | 14.3 | 9.4 | 10.8 | 1,163 | |
| 45-54 | 4.7 | 4.3 | 2.2 | 8.6 | 62.9 | 16.4 | 12.2 | 11.6 | 1,014 | |
| 55-64 | 1.5 | 3.1 | 1.4 | 8.3 | 55.3 | 21.6 | 11.5 | 10.6 | 710 | |
| Region | ||||||||||
| Border | 1.2 | 3.3 | 2.2 | 6.8 | 46.8 | 16.0 | 19.9 | 16.9 | 247 | |
| Dublin | 9.1 | 8.8 | 8.4 | 15.4 | 63.5 | 21.1 | 12.4 | 5.6 | 1,100 | |
| Mid-East | 3.5 | 4.4 | 4.4 | 11.3 | 61.4 | 11.5 | 7.1 | 14.4 | 427 | |
| Midland | 1.9 | 4.1 | 2.5 | 11.9 | 54.1 | 16.0 | 9.1 | 22.9 | 185 | |
| Mid-West | 5.3 | 5.5 | 2.8 | 10.5 | 63.3 | 18.7 | 8.2 | 11.0 | 445 | |
| South-East | 10.0 | 10.0 | 4.7 | 8.7 | 60.4 | 13.1 | 8.8 | 12.1 | 304 | |
| South-West | 7.8 | 6.6 | 6.0 | 10.4 | 60.6 | 12.6 | 11.6 | 8.5 | 506 | |
| West | 4.8 | 3.0 | 4.7 | 13.3 | 63.4 | 14.1 | 10.7 | 10.2 | 371 | |
| Highest level of educational attainment | ||||||||||
| Higher secondary or below | 10.9 | 4.6 | 6.8 | 13.7 | 58.4 | 14.8 | 12.6 | 12.4 | 844 | |
| Post Leaving Certificate | 6.7 | 7.9 | 6.0 | 9.6 | 59.3 | 12.3 | 12.5 | 13.0 | 554 | |
| Third Level non honours degree | 2.8 | 4.4 | 4.7 | 9.1 | 61.7 | 14.1 | 8.1 | 12.9 | 481 | |
| Third Level honours degree or higher | 6.1 | 7.6 | 5.5 | 13.6 | 62.7 | 19.6 | 10.8 | 7.7 | 1,706 | |
| Principal economic status | ||||||||||
| At work | 5.3 | 6.9 | 5.2 | 12.2 | 65.0 | 13.9 | 10.1 | 10.0 | 3,213 | |
| Unemployed | 35.9 | 6.2 | 21.2 | 22.4 | 30.9 | 43.1 | 26.6 | 4.0 | 129 | |
| Other | 5.1 | 0.4 | 1.4 | 8.1 | 13.7 | 50.1 | 13.7 | 18.8 | 243 | |
| Citizenship | ||||||||||
| Irish | 5.9 | 6.0 | 4.9 | 11.9 | 60.9 | 16.8 | 11.1 | 10.8 | 3,242 | |
| Non-Irish | 11.8 | 10.7 | 11.5 | 16.0 | 63.0 | 16.9 | 10.7 | 5.5 | 343 | |
| Degree of Urbanisation | ||||||||||
| Densely-populated area | 9.3 | 8.9 | 8.3 | 14.4 | 61.4 | 20.4 | 12.0 | 7.1 | 1,377 | |
| Intermediate area | 5.3 | 4.2 | 3.7 | 14.3 | 62.0 | 13.5 | 8.3 | 11.6 | 685 | |
| Thinly-populated area | 4.2 | 5.0 | 3.6 | 9.3 | 60.6 | 14.2 | 11.1 | 13.0 | 1,523 | |
| Deprivation Index | ||||||||||
| First Quintile - Very disadvantaged | 8.3 | 5.5 | 3.4 | 12.0 | 58.9 | 15.0 | 9.0 | 10.8 | 682 | |
| Second Quintile - Disadvantaged | 5.2 | 5.9 | 3.7 | 11.7 | 57.9 | 18.7 | 12.5 | 10.9 | 645 | |
| Third Quintile - Average | 3.8 | 4.3 | 4.0 | 7.8 | 59.8 | 14.3 | 14.8 | 9.8 | 648 | |
| Fourth Quintile - Affluent | 5.8 | 5.7 | 6.6 | 15.6 | 59.9 | 13.8 | 10.4 | 13.2 | 677 | |
| Fifth Quintile - Very affluent | 9.2 | 10.0 | 9.2 | 14.1 | 66.8 | 20.8 | 9.4 | 7.1 | 933 | |
| 1 See Background Notes for definition of survey population. Participation in the non-formal education occurred in the 12 months prior to the interview. | ||||||||||
| 2 Note that more than one outcome may have been selected by respondents. | ||||||||||
| 3 Other includes non-formal educational activities which were unable to coded and not stated. | ||||||||||
| Table 3e Persons aged 25-64 who participated in non-formal education, classified by details about the activity, 20171 | ||
| Participation in non-formal activity in the last 12 months | % of persons | |
| The count of all the non formal events entered | ||
| One activity | 19.7 | |
| Two activities | 23.7 | |
| Three activities | 18.3 | |
| Four activities | 13.0 | |
| Five activities or more | 25.3 | |
| Method of the randomly chosen non-formal education activity | ||
| Traditional teaching method (e.g. classroom) | 87.1 | |
| Distance learning | 12.7 | |
| Not stated | 0.2 | |
| Current use of the skills or knowledge acquired from the randomly chosen non-formal education activity | ||
| A lot | 57.5 | |
| A fair amount | 24.8 | |
| Very little | 12.3 | |
| Not at all | 5.3 | |
| Not stated | 0.1 | |
| Expected use of the skills or knowledge acquired from the randomly chosen non-formal education activity | ||
| A lot | 65.0 | |
| A fair amount | 23.9 | |
| Very little | 8.2 | |
| Not at all | 2.6 | |
| Not stated | 0.3 | |
| Unweighted sample | 3,585 | |
| 1 See Background Notes for definition of survey population. | ||
| Table 4 Persons aged 25-64, classified by whether they received guidance on educational possibilities, 20171 | |||
| Details on the guidance received in the last 12 months | % of persons | ||
| Did you receive information on learning activities? | |||
| Yes | 29.4 | ||
| No | 70.5 | ||
| Was the information received free? | |||
| Yes | 28.3 | ||
| No | 1.1 | ||
| No information received | 70.6 | ||
| Unweighted sample | 4,863 | ||
| Of those who received free information on learning activities: | |||
| The type of free information received on learning activities2 | |||
| Information/advice on learning possibilities | 85.1 | ||
| Assessment of skills and competences | 12.9 | ||
| Information on recognition for skills or competencies for prior learning | 12.8 | ||
| Other type of information | 12.0 | ||
| The source of free information received on learning activities2 | |||
| Education or training institutions | 67.8 | ||
| Employment services | 10.5 | ||
| Employer or employer organisations | 17.9 | ||
| Trade unions or work council | 1.9 | ||
| Other institutions/organisations | 24.5 | ||
| The mode of delivery of the free information received on learning activities2 | |||
| Face to face interaction | 30.3 | ||
| Interaction with a person through internet, phone, e-mail or any other media | 55.6 | ||
| Interaction with a computer based application for information or advice/help (including online self-assessment tools) | 23.1 | ||
| No interaction, only information through dedicated material (e.g. books, posters, websites, leaflet, TV programme) | 16.6 | ||
| None of the above but other | 1.3 | ||
| Unweighted sample | 1,319 | ||
| 1 See Background Notes for definition of survey population. | |||
| 2 Note that more than one category may have been selected by the respondent. | |||
| Table 5a Persons aged 25-64, classified by their demand for lifelong learning and sex, 20171 | |||
| % of persons | |||
| Demand | Male | Female | All persons |
| Met demand | 36.2 | 33.7 | 34.9 |
| Partially met demand | 17.4 | 20.4 | 18.9 |
| Unmet demand | 11.6 | 15.4 | 13.5 |
| No demand | 34.6 | 30.2 | 32.4 |
| Not stated | 0.2 | 0.3 | 0.3 |
| Unweighted sample | 2,213 | 2,650 | 4,863 |
| 1 See Background Notes for definition of survey population and demand. | |||
| Table 5b Persons aged 25-64 who stated that they wanted to participate more in lifelong learning, classified by the number of difficulties identified, 20171 | |
| Number of difficulties identified | % of persons |
| One difficulty | 63.2 |
| Two difficulties | 24.6 |
| Three difficulties | 8.5 |
| Four difficulties or more | 3.6 |
| Total | 100.0 |
| Unweighted sample | 1,558 |
| 1 See Background Notes for definition of survey population. Participation in lifelong learning occurred in the 12 months prior to the interview. | |
| Table 5c Persons aged 25-64 who stated that they wanted to participate more in lifelong learning, classified by difficulties identified, 20171,2 | ||||||||||||||
| % of persons | ||||||||||||||
| Demographic profile | Did not have the prerequisites (e.g. entry qualifications) | Training was too expensive or the cost was difficult to afford | Lack of employer's support or lack of public services support | Training conflicted with work schedule/was organised at inconvenient time | Training took place at a distance hard to reach | No access to a computer or internet for distance learning | Did not have time due to family responsibilities | Respondent's health or age | Other personal reasons | No suitable education or training activity available | Reluctant to commit due to previous negative learning experiences | Other3 | Unweighted Sample | |
| State | 3.8 | 28.2 | 6.8 | 28.8 | 8.3 | 1.2 | 43.7 | 8.7 | 9.3 | 6.8 | 1.7 | 6.3 | 1,558 | |
| Sex | ||||||||||||||
| Male | 4.3 | 30.1 | 8.7 | 36.3 | 7.4 | 1.4 | 34.6 | 7.3 | 7.6 | 8.0 | 2.5 | 7.5 | 631 | |
| Female | 3.5 | 26.7 | 5.2 | 22.8 | 9.0 | 1.1 | 50.8 | 9.8 | 10.6 | 5.9 | 1.0 | 5.4 | 927 | |
| Age group | ||||||||||||||
| 25-34 | 4.1 | 38.9 | 7.0 | 28.1 | 7.3 | 0.6 | 35.8 | 4.5 | 8.1 | 8.2 | 1.0 | 4.8 | 281 | |
| 35-44 | 3.7 | 26.7 | 7.4 | 30.7 | 7.6 | 0.9 | 52.7 | 6.8 | 9.7 | 4.8 | 1.5 | 5.0 | 512 | |
| 45-54 | 3.6 | 25.4 | 7.4 | 28.7 | 10.2 | 2.5 | 46.0 | 10.1 | 7.8 | 6.7 | 2.5 | 8.4 | 463 | |
| 55-64 | 3.9 | 17.2 | 3.8 | 25.6 | 8.6 | 1.0 | 33.0 | 18.0 | 13.3 | 9.0 | 1.9 | 8.5 | 302 | |
| Region | ||||||||||||||
| Border | 10.8 | 27.6 | 5.2 | 17.3 | 19.6 | 3.0 | 34.6 | 16.7 | 11.2 | 11.0 | 1.0 | 4.2 | 109 | |
| Dublin | 4.7 | 31.4 | 8.0 | 34.4 | 3.2 | 0.4 | 44.8 | 7.2 | 9.3 | 5.9 | 3.3 | 5.4 | 472 | |
| Mid-East | 1.5 | 23.6 | 5.2 | 19.9 | 6.5 | 1.0 | 45.8 | 6.4 | 8.8 | 3.1 | 0.0 | 8.6 | 178 | |
| Midland | 1.4 | 24.0 | 5.8 | 20.9 | 6.2 | 0.0 | 35.1 | 8.3 | 6.0 | 13.5 | 1.8 | 19.1 | 64 | |
| Mid-West | 4.9 | 28.0 | 6.9 | 22.8 | 13.9 | 1.5 | 47.1 | 12.7 | 11.9 | 7.5 | 0.7 | 3.1 | 204 | |
| South-East | 2.7 | 32.3 | 8.2 | 29.0 | 7.1 | 1.4 | 34.7 | 8.6 | 12.7 | 8.7 | 2.2 | 2.5 | 152 | |
| South-West | 3.7 | 23.9 | 3.8 | 34.0 | 12.6 | 2.1 | 40.6 | 5.4 | 6.6 | 5.6 | 0.3 | 7.9 | 211 | |
| West | 0.8 | 27.6 | 8.3 | 30.5 | 11.8 | 2.3 | 54.2 | 11.7 | 7.9 | 8.0 | 0.8 | 7.1 | 168 | |
| Highest level of educational attainment | ||||||||||||||
| Primary or below | 18.9 | 15.2 | 2.0 | 14.9 | 7.2 | 2.3 | 32.1 | 25.2 | 26.3 | 12.3 | 6.7 | 6.5 | 75 | |
| Lower secondary | 8.3 | 31.9 | 5.7 | 18.7 | 7.7 | 1.9 | 37.4 | 16.4 | 8.9 | 6.5 | 4.1 | 5.3 | 193 | |
| Higher secondary | 3.1 | 25.0 | 4.6 | 22.1 | 4.6 | 1.2 | 41.2 | 13.0 | 7.7 | 7.2 | 1.0 | 10.1 | 258 | |
| Post Leaving Certificate | 2.6 | 33.7 | 7.6 | 26.5 | 13.8 | 1.9 | 44.7 | 9.5 | 9.9 | 7.0 | 3.2 | 2.7 | 275 | |
| Third Level non honours degree | 3.8 | 34.7 | 7.7 | 32.0 | 13.0 | 0.5 | 50.9 | 5.3 | 10.0 | 5.1 | 1.0 | 7.1 | 190 | |
| Third Level honours degree or higher | 1.9 | 25.5 | 7.8 | 35.7 | 6.3 | 0.9 | 44.8 | 3.7 | 7.9 | 6.6 | 0.4 | 6.3 | 567 | |
| Principal economic status | ||||||||||||||
| At work | 3.3 | 28.4 | 8.8 | 38.9 | 7.8 | 0.9 | 45.1 | 3.3 | 6.9 | 6.7 | 1.4 | 6.0 | 1,064 | |
| Unemployed | 7.9 | 52.8 | 3.2 | 6.1 | 12.7 | 2.0 | 24.5 | 3.5 | 11.7 | 11.0 | 4.0 | 11.1 | 111 | |
| Student | [0.0]4 | [9.9] | [0.0] | [2.4] | [8.8] | [0.7] | [34.9] | [24.9] | [22.0] | [7.4] | [0.0] | [12.6] | 49 | |
| Home duties | 5.9 | 17.0 | 2.6 | 0.8 | 8.1 | 5.4 | 4.0 | 74.7 | 17.5 | 3.4 | 6.2 | 5.8 | 100 | |
| Other | 3.7 | 19.2 | 0.9 | 4.4 | 8.1 | 0.8 | 69.5 | 7.4 | 15.0 | 5.9 | 0.0 | 3.8 | 234 | |
| Citizenship | ||||||||||||||
| Irish | 3.3 | 26.7 | 7.3 | 28.8 | 8.7 | 1.3 | 43.5 | 9.1 | 9.4 | 6.8 | 1.7 | 6.6 | 1,354 | |
| Non-Irish | 6.2 | 34.8 | 4.6 | 28.5 | 6.7 | 1.2 | 44.2 | 7.0 | 8.8 | 6.7 | 1.7 | 5.1 | 204 | |
| Degree of Urbanisation | ||||||||||||||
| Densely-populated area | 4.5 | 32.9 | 8.4 | 31.9 | 3.4 | 0.6 | 44.5 | 8.4 | 9.5 | 5.9 | 3.1 | 5.4 | 603 | |
| Intermediate area | 1.6 | 24.5 | 5.7 | 29.5 | 9.6 | 0.8 | 38.8 | 5.7 | 10.1 | 7.2 | 0.3 | 7.9 | 261 | |
| Thinly-populated area | 4.0 | 24.7 | 5.5 | 25.2 | 13.0 | 2.0 | 44.5 | 10.0 | 8.8 | 7.6 | 0.7 | 6.7 | 694 | |
| Deprivation Index | ||||||||||||||
| First Quintile - Very disadvantaged | 6.4 | 30.4 | 8.3 | 21.4 | 8.6 | 2.0 | 38.0 | 11.4 | 10.7 | 8.9 | 3.9 | 6.0 | 304 | |
| Second Quintile - Disadvantaged | 4.9 | 23.3 | 5.5 | 25.2 | 10.8 | 2.2 | 45.4 | 9.0 | 11.3 | 9.1 | 0.4 | 6.9 | 292 | |
| Third Quintile - Average | 5.0 | 26.1 | 5.3 | 28.2 | 10.2 | 0.9 | 44.3 | 7.7 | 7.7 | 5.6 | 1.2 | 5.5 | 291 | |
| Fourth Quintile - Affluent | 2.1 | 31.7 | 9.1 | 31.6 | 7.5 | 0.1 | 47.9 | 7.2 | 7.8 | 5.7 | 1.6 | 8.3 | 298 | |
| Fifth Quintile - Very affluent | 1.4 | 28.9 | 5.5 | 35.8 | 5.4 | 1.1 | 43.0 | 8.2 | 9.2 | 5.1 | 1.3 | 5.0 | 373 | |
| 1 See Background Notes for definition of survey population. | ||||||||||||||
| 2 Note that more than one difficulty may have been selected by respondents. | ||||||||||||||
| 3 Other includes difficulties unable to code and not stated. | ||||||||||||||
| 4 Figures in parentheses [ ] indicate percentages are based on a small unweighted sample [between 30 and 50] and are, therefore, subject to a wide margin of error. | ||||||||||||||
| Table 5d Persons aged 25-64 who stated that they wanted to participate more in educational activities, classified by the main difficulty identified and sex, 20171 | |||
| % of persons | |||
| Main difficulty | Male | Female | All persons |
| Did not have the prerequisites (e.g. entry qualifications) | 2.2 | 2.1 | 2.1 |
| Training was too expensive or the cost was difficult to afford | 19.3 | 17.2 | 18.1 |
| Lack of employer s support or lack of public services support | 3.7 | 2.3 | 2.9 |
| Training conflicted with work schedule and/or was organised at inconvenient time | 26.1 | 12.5 | 18.5 |
| Training took place at a distance hard to reach | 2.3 | 3.2 | 2.8 |
| No access to a computer or internet for distance learning | 0.9 | 0.1 | 0.4 |
| Did not have time due to family responsibilities | 21.6 | 39.9 | 31.8 |
| Respondent's health or age | 5.9 | 7.5 | 6.8 |
| Other personal reasons | 3.1 | 5.3 | 4.4 |
| No suitable education or training activity available | 5.7 | 4.4 | 5.0 |
| You were reluctant to commit due to previous negative learning experiences | 1.7 | 0.1 | 0.8 |
| Other2 | 7.5 | 5.4 | 6.3 |
| Total | 100.0 | 100.0 | 100.0 |
| Unweighted sample | 631 | 927 | 1,558 |
| 1 See Background Notes for definition of survey population. Participation in lifelong learning occurred in the 12 months prior to the interview. | |||
| 2 Other includes difficulties unable to code and not stated. | |||
| Table 6 Persons aged 25-64 who participated in informal learning, classified by the type of informal learning, 20171,2 | ||||||||
| % of persons | ||||||||
| Demographic profile | Visiting learning centres | Using printed material | From a family member, friend or colleague | Using televison/ radio/video | Using computers (online or offline) | From a guided tour | Unweighted Sample | |
| State | 18.7 | 53.7 | 36.6 | 34.6 | 82.2 | 18.1 | 2,938 | |
| Sex | ||||||||
| Male | 15.8 | 51.9 | 36.8 | 34.0 | 82.9 | 16.1 | 1,328 | |
| Female | 21.6 | 55.4 | 36.4 | 35.1 | 81.4 | 20.0 | 1,610 | |
| Age group | ||||||||
| 25-34 | 18.2 | 52.1 | 41.2 | 36.9 | 88.2 | 17.2 | 553 | |
| 35-44 | 19.5 | 56.3 | 36.8 | 33.6 | 83.6 | 17.2 | 857 | |
| 45-54 | 17.9 | 51.3 | 32.4 | 33.1 | 79.0 | 18.0 | 843 | |
| 55-64 | 19.6 | 55.2 | 34.9 | 34.6 | 74.7 | 21.0 | 685 | |
| Region | ||||||||
| Border | 12.0 | 48.9 | 27.7 | 27.9 | 80.0 | 8.5 | 247 | |
| Dublin | 24.2 | 58.9 | 38.7 | 37.2 | 86.5 | 22.8 | 884 | |
| Mid-East | 18.7 | 37.1 | 26.3 | 34.8 | 81.0 | 24.4 | 307 | |
| Midland | 17.1 | 44.7 | 25.1 | 20.8 | 74.9 | 11.9 | 118 | |
| Mid-West | 19.9 | 62.5 | 48.6 | 50.2 | 80.0 | 17.9 | 441 | |
| South-East | 16.8 | 63.0 | 49.4 | 41.8 | 85.8 | 18.4 | 247 | |
| South-West | 12.4 | 49.4 | 30.2 | 21.2 | 77.5 | 9.9 | 419 | |
| West | 13.5 | 50.1 | 36.9 | 28.5 | 79.1 | 14.5 | 275 | |
| Highest level of educational attainment | ||||||||
| Primary or below | 12.5 | 37.2 | 46.4 | 40.1 | 60.7 | 7.9 | 139 | |
| Lower secondary | 9.8 | 41.2 | 34.7 | 33.4 | 72.0 | 9.7 | 317 | |
| Higher secondary | 11.3 | 42.5 | 34.5 | 36.0 | 79.4 | 15.3 | 504 | |
| Post Leaving Certificate | 16.6 | 51.5 | 37.7 | 32.0 | 82.2 | 14.1 | 494 | |
| Third Level non honours degree | 19.1 | 54.1 | 38.4 | 34.2 | 84.5 | 19.0 | 334 | |
| Third Level honours degree or higher | 25.3 | 63.7 | 36.0 | 34.8 | 87.0 | 23.5 | 1,150 | |
| Principal economic status | ||||||||
| At work | 17.7 | 54.6 | 37.5 | 33.9 | 83.5 | 18.0 | 2,170 | |
| Unemployed | 24.2 | 53.6 | 38.2 | 35.5 | 85.5 | 16.5 | 180 | |
| Student | 21.8 | 54.8 | 29.1 | 32.2 | 76.1 | 26.3 | 117 | |
| Home duties | 18.7 | 44.9 | 33.1 | 45.3 | 66.5 | 14.2 | 132 | |
| Other | 21.1 | 50.7 | 31.3 | 34.8 | 77.3 | 19.7 | 338 | |
| Citizenship | ||||||||
| Irish | 18.6 | 53.3 | 36.9 | 34.4 | 80.9 | 17.4 | 2,585 | |
| Non-Irish | 19.6 | 55.6 | 35.3 | 35.2 | 88.0 | 21.2 | 353 | |
| Degree of Urbanisation | ||||||||
| Densely-populated area | 22.8 | 59.1 | 41.0 | 38.8 | 86.0 | 22.7 | 1,153 | |
| Intermediate area | 17.0 | 46.6 | 33.2 | 31.9 | 76.8 | 19.1 | 474 | |
| Thinly-populated area | 15.1 | 50.6 | 33.3 | 31.2 | 80.1 | 12.9 | 1,311 | |
| Deprivation Index | ||||||||
| First Quintile - Very disadvantaged | 19.4 | 58.6 | 42.4 | 37.2 | 81.8 | 16.2 | 569 | |
| Second Quintile - Disadvantaged | 17.5 | 50.8 | 30.0 | 30.5 | 80.1 | 14.0 | 592 | |
| Third Quintile - Average | 16.7 | 50.7 | 35.9 | 33.1 | 79.5 | 21.2 | 547 | |
| Fourth Quintile - Affluent | 17.2 | 53.4 | 32.4 | 31.8 | 82.8 | 15.8 | 517 | |
| Fifth Quintile - Very affluent | 21.9 | 54.5 | 40.7 | 38.8 | 85.7 | 22.1 | 713 | |
| 1 See Background Notes for definition of survey population. Participation in informal learning occurred in the 12 months prior to the interview. | ||||||||
| 2 Note that more than one type of informal learning may have been selected by respondents. | ||||||||
| Table 7a The top five mother tongues as reported, 20171 | ||
| Rank | Language | % who reported it as their mother tongue |
| 1 | English | 87.1 |
| 2 | Polish | 2.5 |
| 3 | Irish | 1.2 |
| 4 | Russian | 0.7 |
| 5 | Lithuanian | 0.7 |
| All other languages | 7.6 | |
| 1 See Background Notes for definition of mother tongue. | ||
| Table 7b The number of languages other than mother tongue known, 20171 | |||||||
| % of persons | |||||||
| Demographic Profile | No other language | One language | Two languages | Three languages or more | Unweighted sample | ||
| State | 49.0 | 29.9 | 15.6 | 5.6 | 4,863 | ||
| Sex | |||||||
| Male | 52.8 | 28.5 | 13.2 | 5.5 | 2,213 | ||
| Female | 45.3 | 31.1 | 17.8 | 5.8 | 2,650 | ||
| Age group | |||||||
| 25-34 | 41.6 | 33.0 | 18.7 | 6.7 | 828 | ||
| 35-44 | 46.0 | 29.3 | 17.3 | 7.4 | 1,391 | ||
| 45-54 | 53.2 | 29.2 | 13.2 | 4.5 | 1,371 | ||
| 55-64 | 57.1 | 27.6 | 12.2 | 3.1 | 1,273 | ||
| Region | |||||||
| Border | 60.8 | 30.0 | 7.2 | 2.0 | 480 | ||
| Midland | 38.1 | 31.4 | 21.4 | 9.1 | 1,251 | ||
| West | 52.3 | 29.0 | 14.5 | 4.2 | 615 | ||
| Dublin | 50.3 | 34.2 | 11.9 | 3.6 | 252 | ||
| Mid-East | 49.4 | 28.0 | 17.0 | 5.6 | 584 | ||
| Mid-West | 53.6 | 28.0 | 14.1 | 4.3 | 426 | ||
| South-East | 60.5 | 25.5 | 10.7 | 3.3 | 756 | ||
| South-West | 44.9 | 33.5 | 15.5 | 6.1 | 499 | ||
| Highest level of educational attainment | |||||||
| Primary or below | 78.3 | 17.9 | 3.1 | 0.7 | 341 | ||
| Lower secondary | 76.1 | 18.1 | 4.6 | 1.2 | 654 | ||
| Higher secondary | 53.4 | 33.0 | 10.7 | 2.9 | 941 | ||
| Post Leaving Certificate | 53.2 | 28.6 | 13.7 | 4.4 | 799 | ||
| Third Level non honours degree | 41.1 | 34.7 | 17.6 | 6.6 | 531 | ||
| Third Level honours degree or higher | 33.1 | 33.0 | 24.2 | 9.7 | 1,597 | ||
| Principal economic status | |||||||
| At work | 47.9 | 30.0 | 16.2 | 5.9 | 3,469 | ||
| Unemployed | 48.9 | 28.4 | 14.7 | 7.9 | 299 | ||
| Student | 39.5 | 40.7 | 14.7 | 5.1 | 201 | ||
| Home duties | 62.9 | 25.7 | 9.4 | 2.0 | 270 | ||
| Other | 51.6 | 28.9 | 15.5 | 4.0 | 623 | ||
| Citizenship | |||||||
| Irish | 55.8 | 27.2 | 13.0 | 3.9 | 4,320 | ||
| Non-Irish | 13.9 | 43.3 | 28.4 | 14.4 | 543 | ||
| Of which: | |||||||
| United Kingdom | 53.7 | 32.1 | 8.6 | 5.7 | 102 | ||
| EU-15 excl. Ire & UK | 0.0 | 39.4 | 41.3 | 19.3 | 77 | ||
| EU-15 to EU-28 | 4.0 | 41.6 | 37.8 | 16.6 | 236 | ||
| Other | 11.5 | 56.2 | 18.2 | 14.0 | 126 | ||
| Degree of Urbanisation | |||||||
| Densely-populated area | 40.5 | 30.6 | 20.4 | 8.5 | 1,629 | ||
| Intermediate area | 56.4 | 27.3 | 12.0 | 4.2 | 969 | ||
| Thinly-populated area | 52.9 | 30.3 | 13.0 | 3.8 | 2,265 | ||
| Deprivation Index - by quintile | |||||||
| First Quintile - Very disadvantaged | 47.7 | 31.5 | 14.9 | 5.9 | 925 | ||
| Second Quintile - Disadvantaged | 47.8 | 33.9 | 13.3 | 5.0 | 983 | ||
| Third Quintile - Average | 53.7 | 27.8 | 13.6 | 5.0 | 928 | ||
| Fourth Quintile - Affluent | 49.1 | 29.5 | 15.9 | 5.6 | 946 | ||
| Fifth Quintile - Very affluent | 46.8 | 26.9 | 19.7 | 6.6 | 1,081 | ||
| 1 See Background Notes for definition of mother tongue. | |||||||
| Table 7c The top five best known language other than mother tongue, 20171 | ||
| Rank | Language | % who reported it as their best known second language |
| 1 | Irish | 41.6 |
| 2 | French | 20.0 |
| 3 | English | 16.0 |
| 4 | German | 7.3 |
| 5 | Spanish | 5.9 |
| All other languages | 9.2 | |
| 1 See Background Notes for definition of mother tongue. | ||
| Table 7d The best known language other than mother tongue, classified by skill level, 20171 | |||||
| % of persons | |||||
| Rank | Language | Basic | Good | Proficient | Total |
| 1 | Irish | 62.6 | 24.0 | 13.4 | 100.0 |
| 2 | French | 54.6 | 26.6 | 18.8 | 100.0 |
| 3 | English | 20.2 | 16.4 | 63.3 | 100.0 |
| 4 | German | 44.1 | 27.6 | 28.2 | 100.0 |
| 5 | Spanish | 51.1 | 23.4 | 25.5 | 100.0 |
| 1 See Background Notes for a definition of language skill level. | |||||
| Table 8a Percentage of persons aged 25-64 who participated in lifelong learning in the last 12 months, classified by sex, 20161,2 | |||
| % of persons | |||
| Country | Males | Females | Total |
| EU-283 | 44.9 | 45.4 | 45.1 |
| Austria | 61.1 | 58.8 | 59.9 |
| Belgium | 44.2 | 46.2 | 45.2 |
| Bulgaria | 24.5 | 24.7 | 24.6 |
| Croatia | 32.5 | 31.1 | 31.8 |
| Cyprus | 56.6 | 40.4 | 48.1 |
| Czech Republic | 49.5 | 42.6 | 46.1 |
| Denmark | 48.3 | 52.6 | 50.4 |
| Estonia | 37.0 | 50.7 | 44.0 |
| Finland | 48.0 | 60.2 | 54.1 |
| France | 48.7 | 53.8 | 51.3 |
| Germany | 51.8 | 52.2 | 52.0 |
| Greece | 15.9 | 17.5 | 16.7 |
| Hungary | 58.7 | 52.7 | 55.7 |
| Ireland | 53.6 | 54.1 | 53.9 |
| Italy | 44.0 | 39.1 | 41.5 |
| Latvia | 42.7 | 51.9 | 47.5 |
| Lithuania | 23.5 | 31.9 | 27.9 |
| Luxembourg | 48.1 | 48.1 | 48.1 |
| Malta | 36.7 | 35.7 | 36.3 |
| Netherlands | 64.7 | 63.5 | 64.1 |
| Poland | 25.2 | 25.7 | 25.5 |
| Portugal | 47.6 | 44.7 | 46.1 |
| Romania | 6.4 | 7.5 | 7.0 |
| Slovakia | 46.8 | 45.3 | 46.1 |
| Slovenia | 44.1 | 48.3 | 46.1 |
| Spain | 44.0 | 42.9 | 43.4 |
| Sweden | 59.5 | 68.2 | 63.8 |
| United Kingdom | 50.2 | 53.9 | 52.1 |
| Source: Eurostat, CSO. Data accessed from the Eurostat database in August 2018. | |||
| 1 See Background Notes for definition of survey population. | |||
| 2 The AES was conducted from July 2016 to December 2017 over Europe. Further details on the time covered for each individual country can be found on the Eurostat website. | |||
| 3 The EU28 figure was based on 27 countries excluding Ireland. A revised figure will be calculated incorporating the Irish dataset and be available on the Eurostat website shortly. | |||
| Table 8b Percentage of persons aged 25-64 who participated in formal education in the last 12 months, classified by sex, 20161,2 | |||
| % of persons | |||
| Country | Males | Females | Total |
| EU-283 | 5.2 | 6.3 | 5.8 |
| Austria | 5.9 | 6.5 | 6.2 |
| Belgium | 6.1 | 7.5 | 6.8 |
| Bulgaria | 2.6 | 3.2 | 2.9 |
| Croatia | 3.5 | 4.4 | 4.0 |
| Cyprus | 3.1 | 2.9 | 3.0 |
| Czech Republic | 2.4 | 2.6 | 2.5 |
| Denmark | 11.8 | 15.2 | 13.5 |
| Estonia | 5.3 | 7.0 | 6.2 |
| Finland | 12.4 | 16.1 | 14.2 |
| France | 2.5 | 4.2 | 3.4 |
| Germany | 3.8 | 3.2 | 3.5 |
| Greece | 3.1 | 4.3 | 3.7 |
| Hungary | 6.8 | 7.9 | 7.3 |
| Ireland | 7.2 | 9.9 | 8.6 |
| Italy | 2.7 | 3.2 | 3.0 |
| Latvia | 3.5 | 5.3 | 4.4 |
| Lithuania | 2.0 | 2.8 | 2.4 |
| Luxembourg | 8.3 | 8.8 | 8.6 |
| Malta | 5.8 | 8.6 | 7.2 |
| Netherlands | 7.8 | 10.2 | 9.0 |
| Poland | 3.5 | 5.2 | 4.4 |
| Portugal | 4.3 | 3.8 | 4.0 |
| Romania | 1.3 | 2.1 | 1.7 |
| Slovakia | :4 | 2.0 | 1.5 |
| Slovenia | 5.4 | 6.7 | 6.0 |
| Spain | 9.5 | 10.2 | 9.8 |
| Sweden | 10.2 | 17.6 | 13.8 |
| United Kingdom | 10.4 | 13.3 | 11.9 |
| Source: Eurostat, CSO. Data accessed from the Eurostat database in August 2018. | |||
| 1 See Background Notes for definition of survey population. | |||
| 2 The AES was conducted from July 2016 to December 2017 over Europe. Further details on the time covered for each individual country can be found on the Eurostat website. | |||
| 3 The EU28 figure was based on 27 countries excluding Ireland. A revised figure will be calculated incorporating the Irish dataset and be available on the Eurostat website shortly. | |||
| 4 Value is not available | |||
| Table 8c Percentage of persons aged 25-64 who participated in non-formal education in the last 12 months, classified by sex, 20161,2 | |||
| % of persons | |||
| Country | Males | Females | Total |
| EU-283 | 42.5 | 42.7 | 42.6 |
| Austria | 59.6 | 57.3 | 58.4 |
| Belgium | 40.6 | 42.2 | 41.4 |
| Bulgaria | 22.6 | 22.3 | 22.5 |
| Croatia | 30.9 | 28.7 | 29.8 |
| Cyprus | 55.6 | 39.4 | 47.2 |
| Czech Republic | 48.0 | 41.2 | 44.6 |
| Denmark | 42.3 | 45.2 | 43.8 |
| Estonia | 34.6 | 47.6 | 41.2 |
| Finland | 42.8 | 52.8 | 47.7 |
| France | 47.7 | 52.1 | 50.0 |
| Germany | 49.6 | 50.8 | 50.2 |
| Greece | 13.3 | 14.7 | 14.0 |
| Hungary | 55.9 | 49.2 | 52.5 |
| Ireland | 50.0 | 49.4 | 49.7 |
| Italy | 43.0 | 38.1 | 40.6 |
| Latvia | 41.4 | 49.6 | 45.7 |
| Lithuania | 22.3 | 30.4 | 26.5 |
| Luxembourg | 45.1 | 45.6 | 45.3 |
| Malta | 34.7 | 32.9 | 33.8 |
| Netherlands | 62.1 | 60.8 | 61.5 |
| Poland | 23.1 | 22.8 | 22.9 |
| Portugal | 45.7 | 43.2 | 44.4 |
| Romania | 5.4 | 5.7 | 5.6 |
| Slovakia | 46.1 | 43.9 | 45.0 |
| Slovenia | 42.2 | 45.2 | 43.6 |
| Spain | 39.8 | 38.4 | 39.1 |
| Sweden | 54.7 | 58.3 | 56.5 |
| United Kingdom | 46.3 | 48.7 | 47.5 |
| Source: Eurostat, CSO. Data accessed from the Eurostat database in August 2018. | |||
| 1 See Background Notes for definition of survey population. | |||
| 2 The AES was conducted from July 2016 to December 2017 over Europe. Further details on the time covered for each individual country can be found on the Eurostat website. | |||
| 3 The EU28 figure was based on 27 countries excluding Ireland. A revised figure will be calculated incorporating the Irish dataset and be available on the Eurostat website shortly. | |||
| Table 8d Percentage of persons aged 25-64 who participated in informal education in the last 12 months, classified by sex, 20161,2 | |||
| % of persons | |||
| Country | Males | Females | Total |
| EU-283 | 60.5 | 60.5 | 60.5 |
| Austria | 78.6 | 80.0 | 79.3 |
| Belgium | 63.1 | 62.4 | 62.7 |
| Bulgaria | 49.1 | 52.5 | 50.8 |
| Croatia | 90.9 | 93.0 | 91.9 |
| Cyprus | 94.9 | 97.1 | 96.1 |
| Czech Republic | 69.9 | 70.5 | 70.2 |
| Denmark | 68.4 | 73.3 | 70.8 |
| Estonia | 77.2 | 81.9 | 79.6 |
| Finland | 67.2 | 70.2 | 68.7 |
| France | 68.0 | 69.0 | 68.5 |
| Germany | 44.7 | 42.2 | 43.5 |
| Greece | 47.1 | 47.3 | 47.2 |
| Hungary | 39.4 | 41.7 | 40.6 |
| Ireland | 61.6 | 62.7 | 62.1 |
| Italy | 73.5 | 75.2 | 74.4 |
| Latvia | 79.0 | 85.0 | 82.1 |
| Lithuania | 19.0 | 25.5 | 22.4 |
| Luxembourg | 69.6 | 67.7 | 68.7 |
| Malta | 39.9 | 44.2 | 42.0 |
| Netherlands | 72.9 | 73.4 | 73.2 |
| Poland | 30.0 | 31.9 | 31.0 |
| Portugal | 87.1 | 89.8 | 88.5 |
| Romania | 64.9 | 63.6 | 64.2 |
| Slovakia | 73.4 | 76.8 | 75.1 |
| Slovenia | 63.4 | 68.7 | 66.0 |
| Spain | 58.7 | 58.7 | 58.7 |
| Sweden | 78.8 | 78.3 | 78.6 |
| United Kingdom | 68.8 | 63.7 | 66.2 |
| Source: Eurostat, CSO. Data accessed from the Eurostat database in August 2018. | |||
| 1 See Background Notes for definition of survey population. | |||
| 2 The AES was conducted from July 2016 to December 2017 over Europe. Further details on the time covered for each individual country can be found on the Eurostat website. | |||
| 3 The EU28 figure was based on 27 countries excluding Ireland. A revised figure will be calculated incorporating the Irish dataset and be available on the Eurostat website shortly. | |||
The main purpose of the Adult Education Survey (AES) is to produce reliable participation rates in further education for the adult population. Data is published on those aged 25 to 64 years old.
The survey produces figures on those who participated in further education broken down by gender, region, level of education, age, economic status and sectors and so on. It also explores how people access guidance on educational possibilities. It is also a source of information on the difficulties experienced by the adult population who wish to participate in education.
The basic legal act for the AES is the Regulation (EC) No 452/2008[1] of 23 April 2008. It concerns the production and development of statistics on education and lifelong learning. The implementing regulation (EU) No 1175/2014[2] details the exact requirements for the specific AES for 2016. Ireland received a derogation to delay implementation until 2017 (2014/773/EU)[3].
The 2017 AES survey is a follow up to a lifelong learning module which was delivered as part of the Quarterly National Household Survey (QNHS) in Q3 2011. Other modules on lifelong learning were asked as part of the QNHS in Q2 2003 and Q3 2008.
The Central Statistics Office wishes to thank the participating households for their co-operation in agreeing to take part in the Adult Education Survey and for facilitating the collection of the relevant data.
The Irish AES was heavily based on based on the EU regulation[2] and the model questionnaire provided by Eurostat[4].
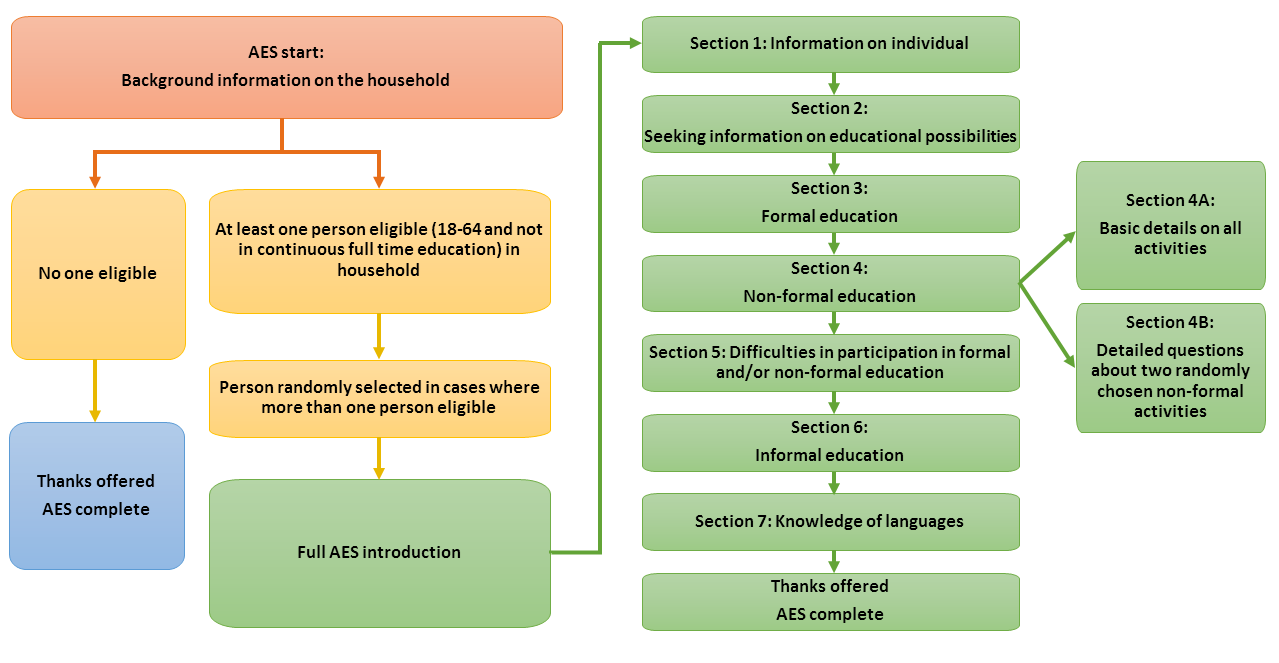
Overall the AES can be broken down into these sections:
The flow of the questionnaire is shown in the diagram below:
Figure A1: AES survey structure
 Survey coverage
The AES data was collected directly from private households. Institutional households, (e.g. nursing homes, barracks, boarding schools, hotels etc.) were not covered by the survey. A household was defined as a single person or group of people who usually reside together in the same accommodation and who share the same catering arrangements. The household members were not necessarily related by blood or marriage.
A person is defined as a "Usual Resident" of a private household if he or she:
(i) Lives regularly at the dwelling in question, and
(ii) Shares the main living accommodation (i.e. kitchen, living room or bathroom) with the other members of the household.
"Living regularly" means usually spending 4 nights a week in the dwelling. However, a member of a couple should be regarded as living regularly with the household if he/she regularly returns to his/her partner in the household for at least one night each week. However, if the person has (another) family (de-facto or otherwise) with which he/she spends the rest of the time then that person should not be included. Persons paying for both board (at least one meal a day) and lodging should be regarded as usual residents of the household.
See the survey manual for a more detailed breakdown of who is and is not included in the household definition: https://www.cso.ie/en/methods/education/adulteducationsurvey/
The sample was derived for the General Household Survey (GHS)[5]. It is a multi-stage cluster sample resulting in all households in Ireland having an equal probability of selection. The sample is stratified using administrative county and the Pobal HP (Haase and Pratschke) Deprivation Index (quintile).
A two-stage sample design is used. Firstly, 1,200 blocks are selected using Probability Proportional to Size (PPS) sampling. All occupied households on Census night 2016 within each block were eligible for selection in the Social Statistics Sample.
Secondly, households within blocks were selected using simple random sampling (SRS) without replacement for inclusion in the survey sample. This ensures each household in the sample frame has an equal probability of selection. A sample size of 11 households per block was allocated for the AES, giving a total sample size of 13,200 households.
One eligible individual within the household was randomly select to participate in the AES. Eligibility for AES participation is based on:
A pilot of the AES was done in May 2017 on a few selected areas around the country to validate the questionnaire, the training delivered and field systems. The full-scale survey started in July 2017 and field work continued until mid-January 2018. The AES is the first survey to be delivered using the General Household Survey (GHS).
The data was collected by a team of 100 Field Interviewers and 10 Field coordinators (each with a team of 10 interviewers). Interviewers were provided with a map of each of their interview areas as well as a listing of the address of each of the selected households. Interviewers were trained in May 2017 on the main concepts (formal, non-formal and informal education definitions) of the AES. In June 2017, a full training session including a thorough review of the questionnaire as it appeared on the laptop as well as a detailed examination of the more complex elements of the questionnaire. Additionally, the interviewers were experienced, as they were currently working on CSO surveys such as the Survey on Income and Living Conditions and the Quarterly National Household Survey (now named the Labour Force Survey). Interviewers received a manual with information such as detailed explanations about the questionnaire, definitions of the concepts involved and examples.
The survey field work was conducted using a team of face-to-face interviewers using Computer Assisted Personal Interviewing (CAPI). This enabled the use of extensive checks in the BLAISE interviewing software to make sure correct and coherent data was collected. It also ensured that respondents were only asked relevant questions, all applicable questions were answered (although it was possible for many questions to accept a “Don’t know” or “Refused to answer” reply) and specific answers were within valid ranges.
One person from each household selected was randomly chosen to continue with the AES. Information was collected directly from respondents - proxy responses from other members of the household were not accepted.
The AES was conducted nationwide during Q3 2017 and Q4 2017 i.e. from July to December 2017. Respondents were asked about different types of educational activities in the twelve months prior to interview.
The number of valid responses for the AES was 4,863 responses. The final status of the survey is detailed in Table A1.
Table A1 AES breakdown of survey response
| Household status | Nos. of Households | % of full sample |
| Full sample of households | 13,200 | 100.0% |
| Dropped households[6] | 1,740 | 13.2% |
| Surveyed households | 11,460 | 86.8% |
| % of surveyed households | ||
| Vacant | 846 | 7.4% |
| Not a housing unit | 59 | 0.5% |
| Attempted to contact | 10,555 | 92.1% |
| % of attempted to contact households | ||
| Refusal | 1,247 | 11.8% |
| Uncontactable | 1,866 | 17.7% |
| Other[7] | 214 | 2.0% |
| Interviewed households | 7,228 | 68.5% |
| of which: | ||
| Partial interviews | 129 | 1.2% |
| Completed interviews | 7,099 | 67.3% |
| of which: | ||
| Ineligible households[8] | 2,236 | 21.2% |
| Eligible households[9] | 4,863 | 46.1% |
Once the data was back in the CSO it was checked and if necessary queried with the field force. After the data collection phase was complete the field data was aggregated together. In certain cases, text strings (used as an “other” category for some questions) were re-coded to the proper category while further validation checks were done.
To provide national results, the survey results were weighted to represent the entire population. The process used was as follows:
Estimates for number of persons where there are less than 30 persons in a cell are too small to be considered reliable. These estimates are presented with an asterisk (*) in the relevant tables.
Where there are 30-49 persons in a cell, estimates are considered to have a wider margin of error and should be treated with caution. These cells are presented with parentheses [ ].
Percentage breakdowns exclude cases where the interviewee did not respond.
The sum of row or column percentages in the tables in this report may not add up to 100 due to rounding.
Always be aware, data are subject to sampling and other survey errors, which are relatively greater in respect of smaller values.
Education in the AES
In the AES, information is collected on participation in three types of education, namely formal education, non-formal education and informal education.
All three share the common attribute that the learning must be intentional.
Figure A1 is a useful graphic which gives an overall breakdown of educational activities. This graphic along with further information on the three main types of education can be found in the 2016 Classification of Learning Activities (CLA) report[11].
Figure A2 Classification of learning activities based on the three broad categories
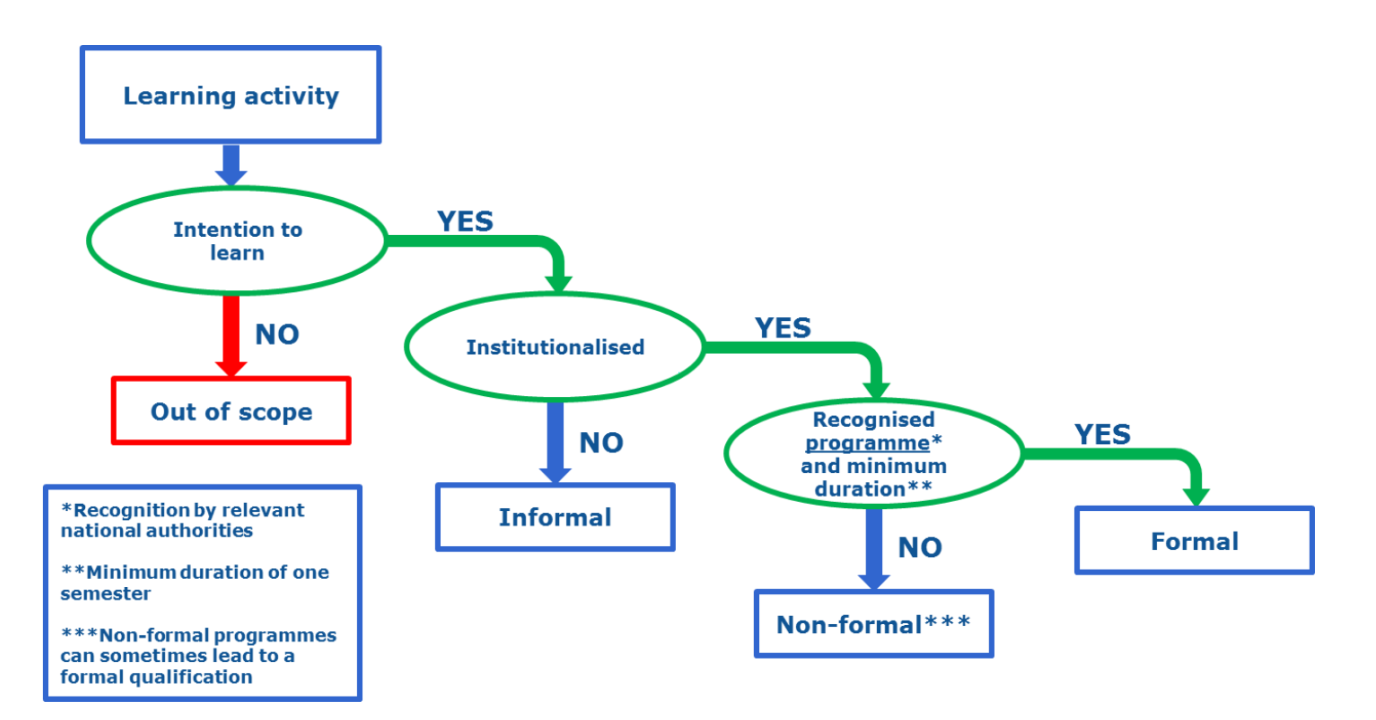
The following are the definitions of each of the three education types:
Formal education is defined as “education provided in the system of schools, colleges, universities and other formal educational institutions that normally constitutes a continuous ‘ladder’ of full-time education for children and young people, generally beginning at age five to seven and continuing up to 20 or 25 years old”. A learning activity is considered to be formal when:
Non-formal education refers to all organised learning activities outside regular or formal education which you participate in with the intention of improving your knowledge or skills in any area (including hobbies). A learning activity is considered to be non-formal when:
There are 4 distinct types included in the AES:
1. Courses at the workplace or in your free time.
Examples: language courses, computer courses, driving courses, management courses, cooking courses, gardening courses or painting courses.
2. Workshops or seminars at the workplace or in your free time.
Examples: Data workshop, inspiration day, study day, inspirational workshop, work information seminar, health seminar.
3. Planned periods of education, instruction or training directly at the workplace, organised by the employer with the aid of an instructor.
Examples: Training to operate a new machine or to learn new software (for one or two persons).
4. Private lessons with the aid of a teacher or tutor for whom this is a paid activity.
Examples: mathematics or piano lessons. A lesson should be included if provided by a professional teacher and excluded if provided by a friend, family member or colleague.
Those who participate in lifelong learning are defined as those who participate in either formal or non-formal education and training. It is an important measure for European policy. A key aim of EU2020 is by 2020, an average of at least 15% of adults should participate in lifelong learning[10].
It refers to activities that you have undertaken deliberately either at work or in your free time to improve your knowledge or skills. It can occur in the family, in the work place, and in the daily life of every person, on a self-directed, family-directed or socially directed basis. A learning activity is considered to be informal when:
It generally refers to activities different from those compulsory activities (including self-study and homework) reported previously under formal and non-formal education.
For those who reported that they had participated in formal education in the 12 months prior to interview were asked what subject(s) they studied. From this the field of education for formal education was derived.
Those who reported that they had participated in non-formal education and training in the 12 months prior to interview were asked to select the field of education for their most recent taught activity.
The fields of education are as follows:
These are based on the ISCED-F 2013 classification. Further information on the ISCED classification can be found here: http://uis.unesco.org/en/topic/international-standard-classification-education-isced
The four categories of demand are defined as:
Mother tongue is defined as the language or languages learned as a child. However, the respondent must still be reasonably fluent in any mother language selected. Reasonably fluent means that the respondent would agree with this statement:
"I can understand a wide range of demanding texts and use the language fluently. I have mastered the language almost completely.”
The ability to speak another language is categorised as follows:
1. I understand and can use a few words and phrases.
2. I can understand and use common everyday expressions. I can also understand and use basic sentences about me, my family or direct surroundings.
3. I can understand the gist if it is clearly spoken, and I can create a simple text. I can describe experience and events. I can communicate quite well.
4. I can understand a wide range of demanding texts and use the language fluently. I have mastered the language almost completely.
In the published tables, option 1 and 2 are recoded to “basic” in the skill level breakdown. Option 3 is reported as “good” and option 4 is considered “proficient”.
This classification is derived from a single question and refers to educational standards that have been attained and can be compared in some measurable way. The question is included in the AES is phrased as follows: “What is the highest level of education or training you have ever successfully completed?”
There are two methods of presenting results for educational attainment; the International Standard Classification of Education (ISCED) and the National Framework of Qualifications (NFQ).
ISCED:
UNESCO developed the International Standard Classification of Education (ISCED) to facilitate comparisons of education statistics and indicators across countries on the basis of uniform and internationally agreed definitions. The current revision of ISCED used in this release is ISCED 2011 (ISCED11).
For information on the ISCED11 classification, see: http://uis.unesco.org/en/topic/international-standard-classification-education-isced
NFQ:
The NFQ was launched in 2003 and it is now the single structure mechanism for recognising all education and training in Ireland. All framework awards now have an NFQ Level, numbered from 1 to 10, which tells you about the standard of learning and an NFQ Award-Type which tells you about the purpose, volume and progression opportunities associated with a particular award. Quality and Qualifications Ireland (QQI) has responsibility to develop, promote and maintain the Irish NFQ.
In this release educational attainment results are presented using a descriptive name and the corresponding NFQ levels.
For information on the NFQ see: http://www.qqi.ie/Articles/Pages/National-Framework-of-Qualifications-(NFQ).aspx
Table A2 Educational qualifications and corresponding ISCED 11 level, NFQ level and Educational attainment level
| Education Qualification | ISCED11 Level | NFQ Level | Educational Attainment Level | |
| No formal education or training | 0 | Primary or below | ||
| Pre-primary education/Primary education (or FETAC Certificate at NFQ level 1 or 2) | 100 | 1/2 | Primary or below | |
| Lower Secondary | Junior Certificate | 200 | 3 | Lower secondary |
| Intermediate Certificate | 200 | 3 | ||
| Group Certificate | 200 | 3 | ||
| FÁS Introductory Skills Certificate | 200 | 3 | ||
| NCVA Foundation Certificate | 200 | 3 | ||
| FETAC Certificate at NFQ level 3 | 200 | 3 | ||
| Equivalent Qualification at NFQ level 3 | 200 | 3 | ||
| Transition Year | 200 | Lower secondary | ||
| Higher Secondary | Leaving Certificate (Traditional) | 304 | 4/5 | Higher secondary |
| Leaving Certificate Vocational Programme (LCVP) | 303 | 4/5 | ||
| Leaving Certificate Applied (LCA) | 303 | 4/5 | ||
| Equivalent Qualification at NFQ level 4/5 | 300 | 4/5 | ||
| Technical or Vocational | Secretarial | 400 | 4/5 | Post leaving cert |
| Certificate in Hotel Operations | 400 | 4/5 | ||
| PLC (Post Leaving Certificate Course) | 400 | 4/5 | ||
| FÁS National Skills Certificate | 400 | 4/5 | ||
| FÁS Specific Skills Certificate | 400 | 4/5 | ||
| FETAC level Certificate at NFQ level 4 | 400 | 4 | ||
| FETAC level Certificate at NFQ level 5 | 400 | 5 | ||
| Equivalent qualification at NFQ level 4/5 | 400 | 4/5 | ||
| Advance Certificate | Completed apprenticeships | 400 | 6 | Post leaving cert |
| Teagasc farming or horticulture Certificate/Diploma | 400 | 6 | ||
| National Craft Certificate | 400 | 6 | ||
| FETAC advanced Certificate at NFQ level 6 | 400 | 6 | ||
| Equivalent Qualification at NFQ level 6 | 400 | 6 | ||
| Higher Certificate | National Certificate (NCEA/DIT/IOT) | 500 | 6 | Higher certificate and equivalent |
| Cadetship (army, air corps or naval service) | 500 | 6 | ||
| HETAC/DIT Higher Certificate at NFQ level 6 | 500 | 6 | ||
| Equivalent qualification at NFQ level 6 | 500 | 6 | ||
| Diploma | National Diploma (HETAC/NCEA e.g. 3 year diploma) | 500 | 7 | Ordinary degree or equivalent |
| Bachelor Degree (DIT) | 500 | 7 | ||
| Equivalent qualification at NFQ level 7 | 600 | 7 | ||
| Ordinary Bachelor Degree at NFQ level 7 | 600 | 7 | Ordinary degree or equivalent | |
| Honours Bachelor Degree, Graduate Diploma or Higher Diploma at NFQ level 8 | 600 | 8 | Honours bachelor degree or equivalent | |
| Professional (Honours Bachelor Degree equivalent or higher) | 600 | 8 | Honours bachelor degree or equivalent | |
| Post-Graduate (e.g. Post Graduate Diploma or Masters degree at NFQ level 9) | 700 | 9 | Postgraduate qualification | |
| Doctorate or higher (e.g. Doctoral Degree/higher Doctorate at NFQ level 10) | 800 | 10 | Postgraduate qualification | |
The regional classifications in this release are based on the NUTS (Nomenclature of Territorial Units) classification used by Eurostat. Until Q4 2017, the NUTS3 regions corresponded to the eight Regional Authorities established under the Local Government Act, 1991 (Regional Authorities) (Establishment) Order, 1993, which came into operation on 1 January 1994 while the NUTS2 regions, which were proposed by Government and agreed by Eurostat in 1999, were groupings of those historic NUTS3 regions.
However, the NUTS3 boundaries were amended on 21st of November 2016 under Regulation (EC) No. 2066/2016 and have come into force from Q1 2018. These new groupings are reflected in the CSO publications from Q1 2018 onwards. The changes resulting from the amendment are that County Louth has moved from the Border to the Mid-East and what was formerly South Tipperary has moved from the South-East to the Mid-West, resulting in the new NUTS2 and NUTS3 regions:
| Northern & Western NUTS2 Region | Southern NUTS2 Region | Eastern & Midland NUTS2 Region | |||
| Border | Cavan | Mid-West | Clare | Dublin | Dublin City |
| Donegal | Limerick City & County | Dun Laoghaire-Rathdown | |||
| Leitrim | Tipperary | Fingal | |||
| Monaghan | South Dublin | ||||
| Sligo | |||||
| South-East | Carlow | Mid-East | Kildare | ||
| West | Galway City | Kilkenny | Meath | ||
| Galway County | Waterford City & County | Wicklow | |||
| Mayo | Wexford | Louth | |||
| Roscommon | |||||
| Midland | Laois | ||||
| South-West | Cork City | Longford | |||
| Cork County | Offaly | ||||
| Kerry | Westmeath | ||||
The Principal Economic Status (PES) classification is based on a single question in which respondents are asked what is their usual situation regarding employment and given the following response categories:
This classification is created from an aggregation of population density estimates derived from the Census of Population. The categories included in each aggregate are explained below:
The Pobal Haase-Pratschke Deprivation Index is used to create the underlying sample and is used to analyse the data. The Index uses Census data to measure levels of disadvantage or affluence in a geographical area. More detailed information on the index can be found here: https://www.pobal.ie/research-analysis/
The results are presented by quintiles, five equal-sized groups of households, with the first quintile representing the least deprived/most affluent area and the fifth quintile representing the most disadvantaged areas.
The industry in which a person is engaged is determined (regardless of their occupation) by the main economic activity carried out in the local unit in which he or she works. The basis of the industrial classification is, in the case of employees, the business or profession of their employer and in the case of self-employed persons, the nature of their own business or profession.
In the AES, industry is coded using NACE – the General Industrial Classification of Economic Activities within the European Communities. The current version, NACE Rev. 2, is a 4-digit activity classification as defined in Council Regulation (EC) no 1893/2006. Fourteen NACE sub-categories are distinguished in this release.
| NACE code description | |||
| Total | All Sectors | K-L | Financial, insurance and real estate activities |
| B-E | Industry | M | Professional, scientific and technical activities |
| F | Construction | N | Administrative and support service activities |
| G | Wholesale and retail trade; repair of motor vehicles and motorcycles | O | Public Administration and defence; compulsory social security |
| H | Transportation and storage | P | Education |
| I | Accommodation and food service activities | Q | Human health and social work activities |
| J | Information and communication | R-S | Arts, entertainment, recreation and other service activities |
The structured classification for occupations allows for jobs to be grouped together based on their similarity in terms of the skill level and skill specialization required. The CSO uses the UK SOC2010 as the primary classification used in collecting the data. ISCO-08 is then derived from UK SOC2010 for publication.
Further information regarding SOC 2010 is available at the following link: http://www.cso.ie/shorturl.aspx/104
The CSO has published lifelong learning data for 2003 and 2008[12]. Care needs to be taken when comparing the results from 2003, 2008 and 2017:
The timing of the surveys is different. The 2003 survey was completed in Q2 (March-May), the 2008 survey was completed in Q3 (June-August) and the 2017 survey was conducted between July and December 2017. This may have an effect on the results.
The surveys are also not directly comparable because of the definition used of the person selected for the survey. In the 2003 survey, proxy responses were allowed while only direct responses to the questionnaire were allowed in the 2008 and 2017 survey.
In the 2008 survey all persons aged 25-64 were selected however in the 2017 survey only those who were not in continuous full-time education were surveyed.
The categories for some questions are different over the years.
For example, the question on informal learning only had four categories in 2003 (Professional books and magazines, Online internet based education, Educational broadcasting and offline computer material and Libraries and other information centres). In the 2008 survey there was an additional category added to the list (Other learning based on experience). In 2017, the informal education question was revised and had six categories to choose from:
Care must also be taken when comparing the Irish data to the European data. The time coverage of the survey was different for some countries as the AES was conducted over an 18-month time period (July 2016 to December 2017) over Europe. The data may also not be directly comparable because of the definition used for the person selected for the survey as Ireland selected those who were not in continuous full-time education. The method of delivery of the survey also varied between countries e.g. Sweden conducted the survey through telephone, Luxembourg conducted it through a web questionnaire and Latvia conducted a mix of web, telephone and face to face. Further details can be found on the Eurostat website[13].
The European Commission hosts a document database which is called Circa BC. It can be found here: https://circabc.europa.eu. Sign in registration is not necessary to access the public documentation for the AES. You can find the documentation by selecting browse categories on the left-hand side of the home page for Circa BC. Under the heading of European Commission, select Eurostat. Select the Education and Training Statistics option under the public access title. On the education and training statistics page select Library and then
→ Public
→ 5. Adult learning statistics
→ 1. Adult Education Survey (AES)
→ AES 2016
In this folder you can find national reports on quality, the manuals for delivery of the AES, model questionnaires and other documentation.
The AES data can be found at the link below (along with a screenshot to show where to find the data under the navigation tree structure – red boxes mark the relevant folders - see Figure A3):
http://ec.europa.eu/eurostat/web/education-and-training/data/database
Figure A3 Location of the AES datasets on the Eurostat website
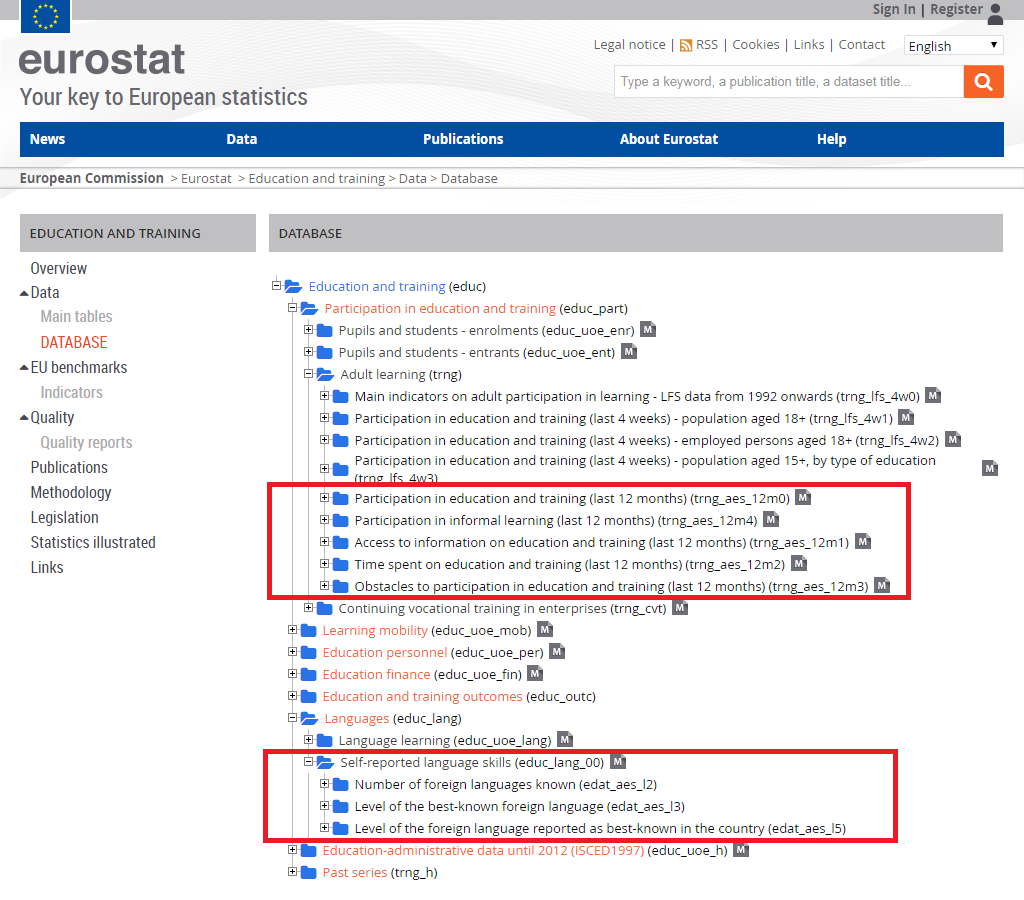
Some of the latest social modules published by the CSO are:
More historical social modules published are available at:
https://www.cso.ie/en/qnhs/releasesandpublications/qnhs-specialmodules/
http://www.cso.ie/en/qnhs/releasesandpublications/qnhs-specialmodules/qnhs-specialmodulesarchive/
 Hide Background Notes
Scan the QR code below to view this release online or go to
http://www.cso.ie/en/releasesandpublications/er/aes/adulteducationsurvey2017/
 Show Table 1a Persons aged 25-64, classified by those who participated in an educational activity in the last 12 months, 2017
 Hide Table 1a Persons aged 25-64, classified by those who participated in an educational activity in the last 12 months, 2017