This chapter presents information on the tourism sector of the Irish economy. The tourism and travel information covers earnings and expenditure from tourism and travel as well as detailing the number of trips to Ireland classified by area of residence and reason for journey. Details of foreign and domestic travel by Irish residents classified by region visited and reason for journey are also included.
| Table 20.1 Overseas trips to Ireland by non-residents - number of trips, average length of stay and expenditure by area of residence, 2012 - 2017 | ||||||
| '000 | ||||||
| 2012 | 2013 | 2014 | 2015 | 2016 | 2017 | |
| Total overseas trips to Ireland | 6,517 | 6,986 | 7,604 | 8,643 | 9,584 | 9,932 |
| Great Britain | 2,774 | 2,929 | 3,164 | 3,547 | 3,924 | 3,729 |
| France | 396 | 434 | 456 | 505 | 531 | 549 |
| Germany | 448 | 483 | 557 | 629 | 652 | 681 |
| Italy | 252 | 234 | 258 | 321 | 344 | 363 |
| Other Europe | 1,251 | 1,312 | 1,368 | 1,588 | 1,774 | 1,888 |
| USA & Canada | 1,017 | 1,158 | 1,329 | 1,514 | 1,808 | 2,101 |
| Australia & New Zealand | 155 | 187 | 190 | 207 | 204 | 208 |
| All other areas | 223 | 248 | 284 | 331 | 346 | 411 |
| Nights | ||||||
| Average length of stay in Ireland | 7.4 | 7.3 | 7.2 | 7.1 | 6.9 | 6.9 |
| Great Britain | 4.6 | 4.7 | 4.5 | 4.3 | 4.2 | 4.4 |
| France | 9.2 | 8.9 | 8.8 | 8.6 | 9.4 | 9.3 |
| Germany | 9.0 | 9.6 | 9.5 | 9.5 | 8.6 | 8.3 |
| Italy | 9.5 | 9.0 | 9.5 | 8.6 | 7.8 | 8.5 |
| Other Europe | 9.1 | 8.8 | 9.0 | 8.7 | 8.9 | 7.8 |
| USA & Canada | 8.5 | 8.2 | 7.4 | 7.7 | 7.2 | 6.9 |
| Australia & New Zealand | 11.6 | 11.8 | 12.5 | 12.3 | 12.5 | 12.6 |
| All other areas | 13.9 | 14.1 | 14.8 | 15.1 | 15.6 | 15.5 |
| €million | ||||||
| Total expenditure in Ireland (excluding fares) | 2,916 | 3,262 | 3,548 | 4,208 | 4,577 | 4,874 |
| Great Britain | 819 | 847 | 885 | 971 | 1,061 | 1,007 |
| France | 189 | 200 | 202 | 236 | 274 | 295 |
| Germany | 227 | 286 | 334 | 397 | 388 | 399 |
| Italy | 108 | 119 | 132 | 153 | 175 | 190 |
| Other Europe | 544 | 629 | 639 | 771 | 821 | 883 |
| USA & Canada | 742 | 822 | 935 | 1,197 | 1,335 | 1,523 |
| Australia & New Zealand | 133 | 168 | 177 | 200 | 204 | 207 |
| All other areas | 155 | 191 | 244 | 283 | 319 | 370 |
| Source: CSO | ||||||
Interactive table: StatBank link
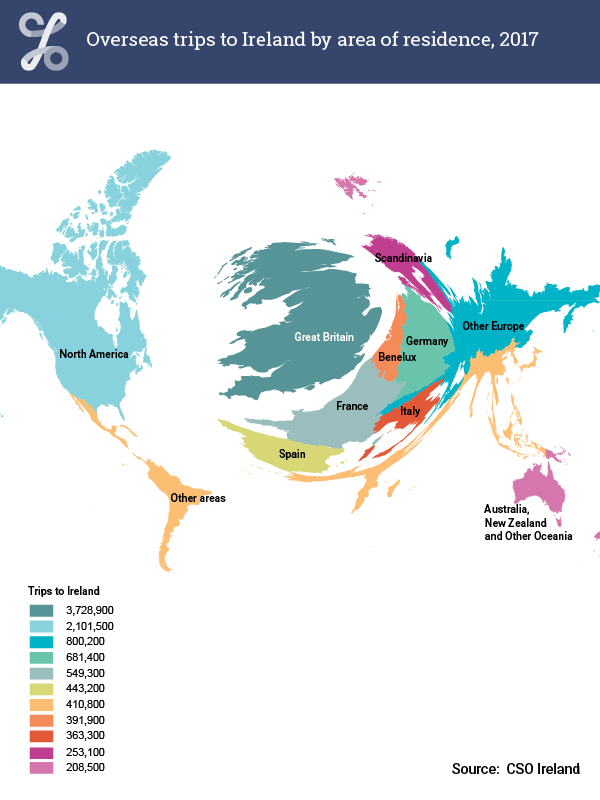
In 2017, 9.9 million overseas trips were made by non-residents to Ireland compared to 9.6 million trips in 2016, an increase of 3.6%. Residents of Great Britain took over 3.7 million trips to Ireland during 2017, a decrease of 195,000 trips (-5.0%) compared to 2016.
The average length of stay in Ireland by all overseas travellers remained the same at 6.9 nights in both 2016 and 2017. The most important overseas markets in terms of non-fare expenditure within Ireland in 2017 were USA and Canada (31.2%) and Great Britain (20.7%).
| 2012 | 2013 | 2014 | 2015 | 2016 | 2017 | |
| Great Britain | 2774000 | 2929000 | 3164000 | 3547000 | 3924000 | 3729000 |
| France, Germany, Italy | 1096000 | 1151000 | 1271000 | 1455000 | 1527000 | 1593000 |
| Other Europe | 1251000 | 1312000 | 1368000 | 1588000 | 1774000 | 1888000 |
| USA & Canada | 1017000 | 1158000 | 1329000 | 1514000 | 1808000 | 2101000 |
| Other Areas | 378000 | 435000 | 474000 | 538000 | 550000 | 619000 |
| Table 20.2 Overseas trips to Ireland by non-residents - number of trips, average length of stay and expenditure by reason for journey, 2012 - 2017 | ||||||
| '000 | ||||||
| 2012 | 2013 | 2014 | 2015 | 2016 | 2017 | |
| Total overseas trips to Ireland | 6,517 | 6,986 | 7,604 | 8,643 | 9,584 | 9,932 |
| Business | 1,182 | 1,242 | 1,282 | 1,441 | 1,539 | 1,478 |
| Visit to friends/relatives | 1,818 | 2,015 | 2,209 | 2,297 | 2,553 | 2,566 |
| Holiday/leisure/recreation | 2,832 | 3,059 | 3,324 | 4,001 | 4,388 | 4,710 |
| Other | 685 | 670 | 789 | 904 | 1,105 | 1,178 |
| Nights | ||||||
| Average length of stay in Ireland | 7.4 | 7.3 | 7.2 | 7.1 | 6.9 | 6.9 |
| Business | 5.0 | 5.4 | 5.6 | 5.3 | 5.7 | 6.1 |
| Visit to friends/relatives | 7.3 | 7.3 | 7.4 | 7.3 | 7.2 | 7.2 |
| Holiday/leisure/recreation | 6.6 | 6.6 | 6.6 | 6.5 | 6.4 | 6.4 |
| Other | 14.8 | 14.0 | 12.1 | 11.9 | 10.0 | 9.4 |
| €million | ||||||
| Total expenditure in Ireland (excluding fares) | 2,916 | 3,262 | 3,548 | 4,208 | 4,577 | 4,874 |
| Business | 529 | 580 | 587 | 675 | 724 | 766 |
| Visit to friends/relatives | 588 | 670 | 784 | 803 | 864 | 895 |
| Holiday/leisure/recreation | 1,513 | 1,687 | 1,823 | 2,330 | 2,547 | 2,758 |
| Other | 287 | 324 | 353 | 400 | 443 | 456 |
| Source: CSO | ||||||
Interactive table: StatBank link
The number of overseas trips to Ireland for the purpose of holiday/leisure/recreation increased by 322,000 trips to over 4.7 million trips between 2016 and 2017, a rise of 7.3%. However, over the same period, the number of business trips to Ireland dropped by 61,000 trips to almost 1.5 million trips, a decrease of 4.0%.
Excluding fares, expenditure by overseas travellers increased by 6.5% in 2017, from €4,577 million in 2016 to €4,874 million. Of this €4,874 million, 57% was spent by overseas travellers for holiday/leisure/recreation purposes, 18% by those travelling to visit friends and relatives, 16% by business travellers and the remaining 9% by those travelling for ‘Other’ reasons.
| Table 20.3 Outbound travel (overnight trips) by Irish residents - number of trips, number of nights, average length of stay and expenditure by region visited, 2012 - 2017 | ||||||
| '000 | ||||||
| 2012 | 2013 | 2014 | 2015 | 2016 | 2017 | |
| Total outbound - trips | 6,623 | 6,575 | 6,677 | 7,094 | 7,644 | 8,171 |
| EU1 | 5,647 | 5,614 | 5,735 | 6,161 | 6,597 | 7,116 |
| Other Europe2 | 194 | 191 | 142 | 181 | 142 | 151 |
| USA and Canada | 388 | 404 | 453 | 422 | 492 | 558 |
| Central, South & Other Americas | 74 | 39 | 32 | 40 | 55 | 30 |
| Asia | 177 | 133 | 173 | 165 | 222 | 221 |
| Africa | 66 | 78 | 87 | 80 | 66 | 63 |
| Australia, New Zealand & Oceania | 76 | 115 | 56 | 44 | 71 | 32 |
| Total outbound - nights | 53,112 | 51,985 | 53,652 | 53,515 | 56,748 | 57,698 |
| EU1 | 38,988 | 37,103 | 40,237 | 40,564 | 42,416 | 44,048 |
| Other Europe2 | 1,348 | 1,641 | 1,460 | 1,263 | 989 | 1,075 |
| USA and Canada | 5,838 | 5,691 | 6,295 | 5,877 | 6,334 | 6,929 |
| Central, South & Other Americas | 1,050 | 492 | 526 | 629 | 869 | 462 |
| Asia | 2,977 | 2,467 | 2,492 | 2,811 | 3,311 | 3,435 |
| Africa | 1,029 | 950 | 1,386 | 1,244 | 1,278 | 926 |
| Australia, New Zealand & Oceania | 1,883 | 3,642 | 1,256 | 1,127 | 1,550 | 822 |
| Nights | ||||||
| Average length of stay | 8.0 | 7.9 | 8.0 | 7.5 | 7.4 | 7.1 |
| EU1 | 6.9 | 6.6 | 7.0 | 6.6 | 6.4 | 6.2 |
| Other Europe2 | 7.0 | 8.6 | 10.3 | 7.0 | 7.0 | 7.1 |
| USA and Canada | 15.0 | 14.1 | 13.9 | 13.9 | 12.9 | 12.4 |
| Central, South & Other Americas | 14.1 | 12.6 | 16.5 | 15.8 | 15.7 | 15.3 |
| Asia | 16.8 | 18.6 | 14.4 | 17.0 | 14.9 | 15.6 |
| Africa | 15.5 | 12.1 | 16.0 | 15.5 | 19.4 | 14.6 |
| Australia, New Zealand & Oceania | 24.8 | 31.7 | 22.6 | 25.7 | 22.0 | 25.7 |
| €million | ||||||
| Total outbound - expenditure | 5,342.5 | 5,384.2 | 5,590.2 | 6,022.1 | 6,539.0 | 6,890.7 |
| EU1 | 3,590.5 | 3,456.2 | 3,831.3 | 4,185.9 | 4,438.2 | 4,830.9 |
| Other Europe2 | 138.1 | 173.1 | 156.4 | 158.1 | 122.4 | 149.7 |
| USA and Canada | 787.0 | 819.0 | 890.2 | 925.7 | 1,051.1 | 1,137.9 |
| Central, South & Other Americas | 142.1 | 77.0 | 88.6 | 96.1 | 150.5 | 73.7 |
| Asia | 346.2 | 371.6 | 347.0 | 368.5 | 472.4 | 477.0 |
| Africa | 120.0 | 111.4 | 142.3 | 168.4 | 117.5 | 122.3 |
| Australia, New Zealand & Oceania | 218.5 | 376.0 | 134.2 | 119.4 | 187.0 | 99.3 |
| 1From 1st July 2013, EU includes Croatia. | ||||||
| 2Other Europe includes Croatia until the 30th June 2013. | ||||||
| Source: CSO | ||||||
Interactive table: StatBank link
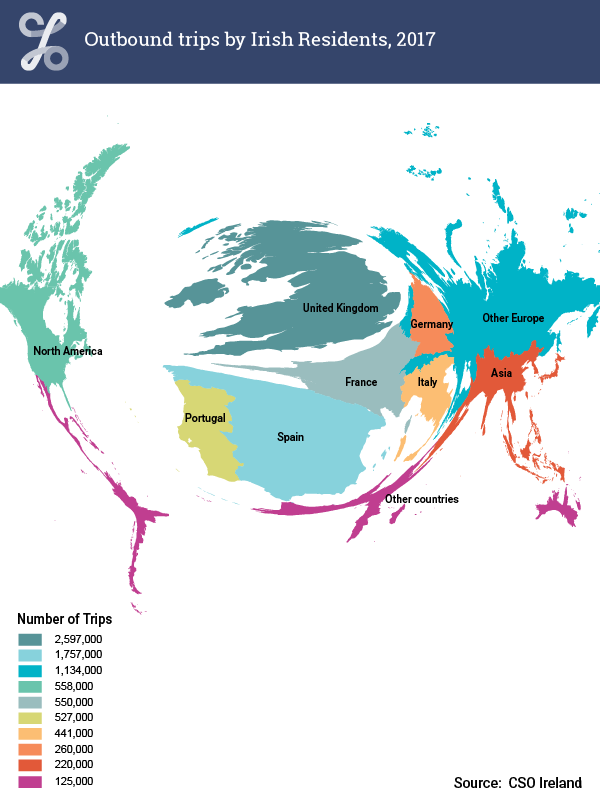
Almost 8.2 million outbound trips were undertaken by Irish residents in 2017. The average length of stay on outbound trips was 7.1 nights, varying from 6.2 nights within the European Union, 12.4 nights in USA and Canada and 25.7 nights in Australia, New Zealand and Oceania.
Total expenditure by Irish residents on outbound trips amounted to €6,891 million during 2017, of which over 70% was spent within the European Union.
| Table 20.4 Domestic travel (overnight trips) by Irish residents - number of trips, number of nights, average length of stay and expenditure by reason for journey, 2012 - 2017 | ||||||
| '000 | ||||||
| 2012 | 2013 | 2014 | 2015 | 2016 | 2017 | |
| Total domestic - trips | 8,291 | 8,413 | 8,991 | 9,125 | 9,359 | 9,626 |
| Holiday | 4,036 | 4,073 | 4,436 | 4,658 | 4,870 | 4,886 |
| Business | 350 | 364 | 453 | 407 | 431 | 426 |
| Visiting friends/relatives | 2,765 | 2,988 | 2,918 | 2,921 | 3,045 | 3,096 |
| Education & training | 155 | 142 | 128 | 167 | 157 | 218 |
| Sporting events | 295 | 269 | 396 | 331 | 296 | 335 |
| Work/looking for work | 130 | 84 | 101 | 80 | 84 | 68 |
| Other1 | 560 | 493 | 559 | 559 | 477 | 598 |
| Total domestic - nights | 23,703 | 24,195 | 26,086 | 25,267 | 25,589 | 25,539 |
| Holiday | 12,771 | 13,986 | 14,424 | 14,751 | 15,077 | 13,844 |
| Business | 693 | 616 | 904 | 672 | 764 | 745 |
| Visiting friends/relatives | 7,033 | 7,095 | 7,335 | 6,877 | 7,238 | 7,689 |
| Education & training | 1,046 | 721 | 745 | 952 | 772 | 1,218 |
| Sporting events | 567 | 495 | 755 | 630 | 574 | 669 |
| Work/looking for work | 442 | 266 | 368 | 259 | 220 | 288 |
| Other1 | 1,149 | 1,016 | 1,556 | 1,126 | 944 | 1,086 |
| Nights | ||||||
| Average length of stay | 2.9 | 2.9 | 2.9 | 2.8 | 2.7 | 2.7 |
| Holiday | 3.2 | 3.4 | 3.3 | 3.2 | 3.1 | 2.8 |
| Business | 2.0 | 1.7 | 2.0 | 1.6 | 1.8 | 1.7 |
| Visiting friends/relatives | 2.5 | 2.4 | 2.5 | 2.4 | 2.4 | 2.5 |
| Education & training | 6.8 | 5.1 | 5.8 | 5.7 | 4.9 | 5.6 |
| Sporting events | 1.9 | 1.8 | 1.9 | 1.9 | 1.9 | 2.0 |
| Work/looking for work | 3.4 | 3.2 | 3.6 | 3.2 | 2.6 | 4.2 |
| Other1 | 2.1 | 2.1 | 2.8 | 2.0 | 2.0 | 1.8 |
| €million | ||||||
| Total domestic - expenditure | 1,514.2 | 1,533.0 | 1,713.5 | 1,725.3 | 1,797.7 | 1,879.1 |
| Holiday | 876.2 | 947.2 | 992.8 | 1,070.4 | 1,135.8 | 1,129.2 |
| Business | 80.5 | 84.2 | 110.3 | 98.0 | 106.3 | 123.3 |
| Visiting friends/relatives | 289.6 | 284.8 | 327.0 | 296.5 | 297.0 | 353.1 |
| Education & training | 53.4 | 46.4 | 40.6 | 60.7 | 53.9 | 73.3 |
| Sporting events | 53.3 | 49.9 | 67.3 | 58.7 | 64.3 | 62.1 |
| Work/looking for work | 37.9 | 16.9 | 21.0 | 17.9 | 19.2 | 19.3 |
| Other1 | 123.4 | 103.6 | 154.5 | 123.1 | 121.2 | 118.7 |
| 1Other includes Health & Medical, Religious, Shopping and other reasons not elsewhere specified. | ||||||
| Source: CSO | ||||||
Interactive table: StatBank link
| Holiday | Business | Visiting Friends/Relatives | Education and Training | Sporting Events | Other incl. Work/Looking for Work | |
| 2012 | 4036 | 350 | 2765 | 155 | 295 | 690 |
| 2013 | 4073 | 364 | 2988 | 142 | 269 | 577 |
| 2014 | 4436 | 453 | 2918 | 128 | 396 | 660 |
| 2015 | 4658 | 407 | 2921 | 167 | 331 | 639 |
| 2016 | 4870 | 431 | 3045 | 157 | 296 | 561 |
| 2017 | 4886 | 426 | 3096 | 218 | 335 | 666 |
Irish residents took more than 9.6 million domestic trips in 2017. The average length of stay for domestic trips was 2.7 nights, resulting in a total of 25.5 million bed nights. Holidays accounted for half of all domestic trips (50.8%), while over 3 million trips (32.2%) were to visit friends or relatives.
Total expenditure by Irish residents on domestic trips for 2017 amounted to €1,879 million. A total of €1,129 million of this was accounted for by those on holidays, while spending by those visiting friends or relatives increased by almost a fifth in 2017.
Below we have included a collection of cartograms depicting inward and outward trips and expenditure. The cartograms use a map to present the data and are distorted to represent the size of the figures for each area.
Go to next chapter >>> Transport
Learn about our data and confidentiality safeguards, and the steps we take to produce statistics that can be trusted by all.