
In SILC, weights are applied to the data to ensure the results are reflective of the population as a whole. In 2025, the SILC Enforced Deprivation publication was released early, before the income data was fully processed, to provide more timely statistics on households. Following the processing of the income data and coherence checks with administrative data sources, the weights used for SILC 2025 data have been refined. Adjustments were made in the non-response process and the calibration boundaries, reducing the variance of the weights and improving the accuracy of the estimates.
As a result, estimates contained in the SILC 2025 Enforced Deprivation publication have been revised. Please see the information note which compares published and revised results.
Households that are excluded and marginalised from consuming goods and services which are considered the norm for other people in society, due to an inability to afford them, are considered to be deprived. A set of 11 basic deprivation indicators is used to identify those deemed to be deprived. See Survey on Income and Living Conditions Fact Sheet.
In 2025, the items with the highest deprivation rates were being unable to afford to replace any worn out furniture (16.0%), followed by being unable to afford a morning, afternoon or evening out in last fortnight (10.4%), and being unable to afford to get-together with family or friends for a drink or meal once a month (10.0%). See figure 2.1 and table 2.1.
In 2025, deprivation rates increased for four of the eleven deprivation items.
The largest year-on-year decreases (in percentage point terms) were seen in:
A comparison of the 2025 deprivation rates for the 11 deprivation items with the 2020 rates shows that the largest decrease (in percentage point terms) over the five-year period was for the percentage of people who went without heating at some time during the last 12 months through lack of money, which went down from 8.8% in 2020 to 7.5% in 2025. The largest increase over this period was seen in the proportion of people unable to afford a morning, afternoon, or evening out in the last fortnight, which increased from 7.5% in 2020 to 10.4% in 2025.
The proportion of people living in households unable to afford a roast joint (or its equivalent) once a week went up from 3.7% in 2024 to 4.8% in 2025. In 2025, 1.7% of people were unable to afford a meal with meat, chicken, fish (or vegetarian equivalent) every second day. The 2024 rate was marginally lower at 1.7%. See figure 2.2 and table 2.2.
Analysis of the deprivation rates by principal economic status shows that the percentage of people unable to work due to long-standing health problems who were unable to afford a roast joint (or its equivalent) once a week went up from 9.2% in 2024 to 23.2% in 2025. The corresponding rate for employed persons was almost unchanged, going from 2.6% in 2024 to 2.5% in 2025. See figure 2.3 and table 2.3.
The percentage of people unable to work due to long-standing health problems who were unable to afford a meal with meat, chicken, fish, (or vegetarian equivalent) every second day also increased in 2025 going from 4.3% in 2024 to 9.1% in 2025. The comparable rate for employed persons decreased from 1.7% in 2024 to 0.6% in 2025.
In 2025, 7.5% of people were unable to afford new (not second-hand clothes) up from 6.2% in 2024. In 2025, 1.2% were unable to afford a warm waterproof coat and one in fifty (2.3%) were unable to afford two pairs of properly fitting shoes that are suitable for daily activities. See figure 2.4 and table 2.4.
By household composition, three in ten (29.3%) people living in single-adult households with children were unable to afford new (not second-hand) clothes, six times the rate (5.2%) for people living in two-adult households with one to three children.
Of people who were living in a single-adult household with children, almost one in eleven (8.9%) were unable to afford a warm waterproof coat and 6.2% were unable to afford two pairs of properly fitting shoes in good condition that are suitable for daily activities in 2025.
Analysis by self-defined principal economic status shows that unemployed people and those unable to work due to long-standing health problems were least likely to be able to afford each of the clothing and footwear related deprivation items. Almost three in ten (29.4%) of unemployed persons and one in four (23.5%) people who are unable to work due to long-standing health problems were unable to afford new (not second-hand) clothes, compared with 3.6% of employed people in 2025.
Of people who were unable to work due to long-standing health problems in 2025, 5.5% were unable to afford a warm waterproof coat and 8.5% were unable to afford two pairs of properly fitting shoes in good condition that are suitable for daily activities. The comparable rates for employed respondents were 0.5% (unable to afford coat) and 1.2% (unable to afford shoes). See figure 2.5 and table 2.5.
The deprivation rate for each of the three housing related deprivation items decreased in 2025.
SILC data collection occurs during the first six months of the survey year. Taking the mid-point (March) of SILC data collection for survey years 2021 to 2025, prices on average, as measured by the Consumer Price Index (CPI), rose by
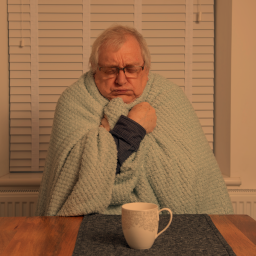
Increases in average prices, particularly energy prices in 2022 and 2023 are reflected in the increase in the deprivation rates for ‘Being without heating at some stage in the last year through lack of money‘ and ‘Being unable to keep the home adequately warm’ in 2022 and 2023. The 2024 and 2025 deprivation rates for these two deprivation items have decreased when compared with 2023 but remain higher than the 2021 rates. See figure 2.6 and table 2.6.
Analysis by household composition shows that people living in single-adult households with children were the most likely to have gone without heating at some time during the 12-month period prior to their interview through lack of money (e.g. had to go without a fire on a cold day or go to bed to keep warm or light the fire late because of lack of coal/fuel). One in four (24.0%) of these households went without heating through lack of money. See figure 2.7 and table 2.7.
By household composition, those living in single-adult households with children were also most likely to be unable to keep the home adequately warm (12.5%), while those living in three or more adult households had the lowest rate for this deprivation item (2.4%) in 2025.
Almost half (47.8%) of people living in single-adult households with children were unable to afford to replace worn out furniture.
By principal economic status, unemployed respondents and people unable to work due to long-standing health problems were least able to afford to keep their homes adequately warm in 2025. One in seven (13.9%) unemployed respondents and 13.5% of people unable to work due to long-standing health problems were unable to keep their home adequately warm. See figure 2.8 and table 2.8.
One in five (20.1%) unemployed persons and 19.1% of people unable to work due to long-standing health problems went without heating at some point in the last year. The comparable rates for retired people and the employed were 3.7% and 5.1% respectively.
People living in rented or rent-free accommodation were more likely to experience heating-related deprivation than those in owner-occupied homes. In 2025, 16.5% of people living in rented or rent-free accommodation went without heating at some point in the last year, more than four times the rate (3.5%) for those living in owner-occupied housing. One in ten (9.9%) people living in rented accommodation could not afford to keep their home adequately warm in 2025, more than four times the rate (2.0%) for those living in owner-occupied accommodation.
The proportion of people experiencing two of the three social-related deprivation items decreased in 2025.
In 2025, one in five (20.9%) people living in rented or rent-free accommodation were unable to afford to get-together with family or friends for a drink or meal once a month, and a similar percentage (23.4%) could not afford a morning, afternoon, or evening out in the last fortnight. The comparable rates for those living in owner-occupied dwellings were 5.1% and 4.4% respectively. See figure 2.10 and table 2.10.
At the national level, 3.6% of people could not afford to buy presents for family or friends at least once a year, down from 4.1% in 2024. Almost one in five (18.0%) of people living in single-adult households with children could not afford to buy presents for family or friends at least once a year. The comparable rates for people living in two-adult households with one to three children was 2.2%. See figure 2.11 and table 2.11.
The following section of this chapter will focus on four additional deprivation indicators, which are not used in calculating the national enforced deprivation rate. These four deprivation indicators are:
These four indicators are used by Eurostat (the statistical office of the European Union (EU)) to calculate EU material and social deprivation rates. See Background Notes for information on how Eurostat calculates the material and social deprivation rate and how this measure differs from the national enforced deprivation indicator
In the SILC survey, the respondent to the household questionnaire was asked ‘Can you afford to go for a week’s holiday, away from home each year, including stays in a second dwelling or stays with friends/relatives? Note: Please ensure that all people in the household (including children aged one year or more and below 16) are also considered for this question.’ The answer options to this question were:
The answer given by the respondent to the household questionnaire is assigned to all members of the survey household.
In 2025, one in five (20.5%) people could not afford a one-week holiday away from home, down from the 2024 rate of 22.9%. See figure 2.12 and table 2.12.
Analysis by household composition showed that over two in five (43.3%) of people living in single-adult households with children could not afford a one-week holiday away from home. The comparable rates for people living in two-adult households with one to three children was 20.7%. See figure 2.13 and table 2.13.
SILC survey respondents are asked ‘Do you regularly participate in a leisure activity (that costs money)?’ The answer options to this question are:
The percentage of people who were unable to afford to regularly participate in leisure activities that cost money dropped from 13.5% in 2024 to 12.2% in 2025. See figure 2.14 and table 2.14.
Analysis by household composition shows that two in five (39.0%) people living in single-adult households with children could not afford to regularly participate in leisure activities that cost money. The comparable rates for people living in two-adult households with one to three children was 12.7%.
SILC survey respondents are asked ‘Do you spend a small amount of money most weeks on yourself, for your own pleasure (buying/doing something for yourself)?’ The answer options to this question are:
The percentage of people who were unable to afford to spend a small amount of money most weeks on themselves, for their own pleasure (buying/doing something for themselves) increased from 9.7% in 2024 to 10.6% in 2025.
Analysis by self-defined principal economic status (PES) shows that the unemployed and people unable to work due to long-standing health problems had higher rates for this deprivation item when compared with other groups. One in four (26.5%) unemployed people and one in four (26.6%) people unable to work due to long-standing health problems were unable to afford to spend a small amount of money most weeks on themselves, for their own pleasure (buying/doing something for themselves) compared with 7.0% of employed. See figure 2.15 and table 2.15.
In the SILC survey, the respondent to the household questionnaire was asked ‘Does your household have a car or van for private use?’ Note: Company cars or vans that are not available for private use are not included.’ Answer options to this question were:
Households that answer ‘No’ to this question are then asked the follow-up question: ‘Why does your household not have a car or van for private use?’ The answer options to this question are:
The answer given by the household questionnaire respondent is assigned to all members of the survey household. All people in households where the household respondent answered ‘Cannot afford one’ are classified as being unable to afford a car or van for private use.
The percentage of people unable to afford a car or van rose from 3.8% in 2024 to 6.5% in 2025. See figure 2.16 and table 2.16.
Analysis by tenure status shows that 1.4% of people living in owner-occupied households were unable to afford a car or van for private use in 2025. The comparable rate for people living in rented or rent-free accommodation was less than one in five (18.1%). See figure 2.17 and table 2.17.
In the 2025 SILC survey, the respondent to the household questionnaire was asked ‘Can your household afford an unexpected expense €1,550 without borrowing? Note: If the payment was made on credit then the account should be debited within 1 month.’ For information on how €1,550 was calculated as the value for an unexpected expense in the 2025 questionnaire see Background Notes.
In 2025, three in ten (30.5%) people were living in households that were unable to afford an unexpected expense of €1,550 without borrowing.
Analysis by household composition shows that in 2025, over three in four (78.6%) people in single-adult households with children live in a household that could not afford an unexpected expense of €1,550 without borrowing. This compares with less than one in five (18.5%) people in two-adult households where at least one is aged 65 or over. See figure 2.18 and table 2.18.
More than half (58.6%) of people in rented or rent-free households live in a household that could not afford an unexpected expense of €1,550 without borrowing compared with less than one in five (18.0%) people living in owner-occupied households. See figure 2.19 and table 2.19.
Learn about our data and confidentiality safeguards, and the steps we take to produce statistics that can be trusted by all.

_clothes.png)


_2023_Infobytes_21.Holiday.png)
_2023_Infobytes_20.Event.png)

_2023_Infobytes_19.Car_(002).png)