

SDG 6.1.1 Proportion of population using safely managed drinking water services is indicated by data from the CSO, Census of Population 2016, and EPA (Environmental Protection Agency) monitoring data.
The Census 2016 data in Table 4.1 shows that virtually all households had a piped water supply.
Households connected to the public mains supply accounted for 77% of all households. Group water schemes accounted for 8% of domestic water supply, while private water sources accounted for 10% of households. See Tables 4.2 and 4.3.
The EPA Drinking Water Quality in Public Supplies 2019 report provides an overview of drinking water quality in Ireland for 2019, based on monitoring data from Irish Water, and the regulation of public supplies by the EPA.
In 2019, Irish Water monitored 787 public water supplies serving approximately 1.3 million households (CSO, Census 2016). Water quality across each of the three parameter categories has remained consistently high since Irish Water became responsible for public water supplies in 2014.
Microbiological parameters are the most important health indicators of drinking water quality, particularly E.coli. If bacteria are found in drinking water, it can mean that the disinfection treatment process is not working properly or that contamination has entered either the water reservoir or distribution pipes, after treatment. See Table 4.4.
The EPA Focus on Private Water Supplies 2019 report provides an overview of the quality of private drinking water supplies in Ireland for 2019, based on monitoring data from local authorities. Private wells, of which there are approximately 180,000 in the country, are not regulated under the Drinking Water Regulations, and the quality of these supplies is not assessed in these annual EPA reports. See Table 4.5.
SDG 6.2.1 Proportion of population using safely managed sanitation services, including a hand-washing facility with soap and water is indicated by data from the CSO, Census of Population 2016.
The Census 2016 data in Table 4.6 shows that virtually all households had a sewerage facility, indicating access to safely managed sanitation services.
Households connected to the public sewerage schemes accounted for 67% of all households. Individual septic tanks accounted for 26% of domestic sewerage facilities, while other sewerage systems accounted for 4% of households with 3% not stated. See Tables 4.7 and 4.8.
SDG 6.3.1 Proportion of wastewater safely treated is reported by the Environmental Protection Agency (EPA).
The EPA Urban Waste Water Treatment in 2019 report provides an overview of urban waste water treatment in Ireland during 2019. Extracts from the EPA Urban Waste Water Treatment in 2019 report are provided here in relation to indicator SDG 6.3.1.
More than a billion litres of waste water is collected every day in Ireland’s public sewers and treated at over 1,100 treatment plants. The treated effluent is then released back into the environment, mostly to rivers, estuaries or coastal waters. The type of treatment is summarised below:
The figures show the type of treatment that the plant was designed to provide (e.g. primary treatment, secondary treatment). However, in some cases the treated waste water discharged from these plants did not meet the standards required by the EPA, or the standards expected from these type of treatment plants.
By 2019, 98.6% of urban waste water received at least primary treatment. See Table 4.9.
Why is it important to treat waste water?
The objective of waste water treatment is to collect the waste water generated within communities and remove polluting material so that the treated water can be released safely back into the water environment.
Untreated or poorly treated waste water can be contaminated with harmful bacteria and viruses and can pose a health risk to people who come into contact with infected water. It can damage aquatic ecosystems by decreasing the level of oxygen in the water and releasing nutrients that can lead to excessive and unwanted growth of algae and aquatic plants.
Compliance with European Union requirements
Large urban areas collectively generate 92% of Ireland’s urban waste water. The European Union’s Urban Waste Water Treatment Directive sets requirements for treating waste water from these large urban areas, with the objective of protecting the environment from the adverse effects of waste water discharges. The final deadline to implement these requirements in full was 2005. In 2019 there were 172 towns and cities in Ireland subject to these requirements. 153 met the requirements but the remaining 19 areas did not treat waste water to the necessary standards.
Figure 4.1 shows the gradual decrease since 2017 in the number of areas that did not meet the treatment standards.
| Areas | |
| 2017 | 28 |
| 2018 | 21 |
| 2019 | 19 |
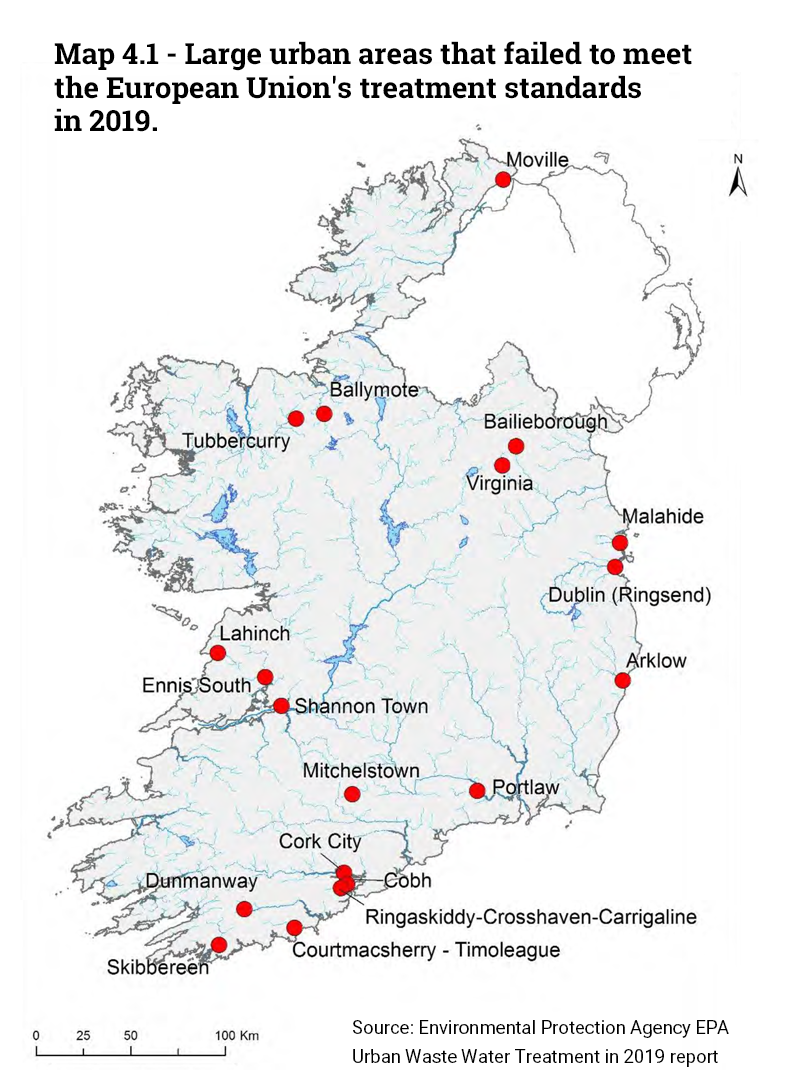
Treatment at the 19 large urban areas shown on Map 4.1 below failed to meet the European Union Standards in 2019. Over half of all the urban waste water collected in Ireland's public sewers was generated in these 19 areas. Consequently just 44% of waste water from Ireland’s large urban areas was treated at plants that complied with the European Union standards. This is far below the European Union average of 81%. The main factor in Ireland’s poor compliance is the failure at Ringsend in Dublin, which treats almost half of the country’s urban waste water.
Untreated waste water
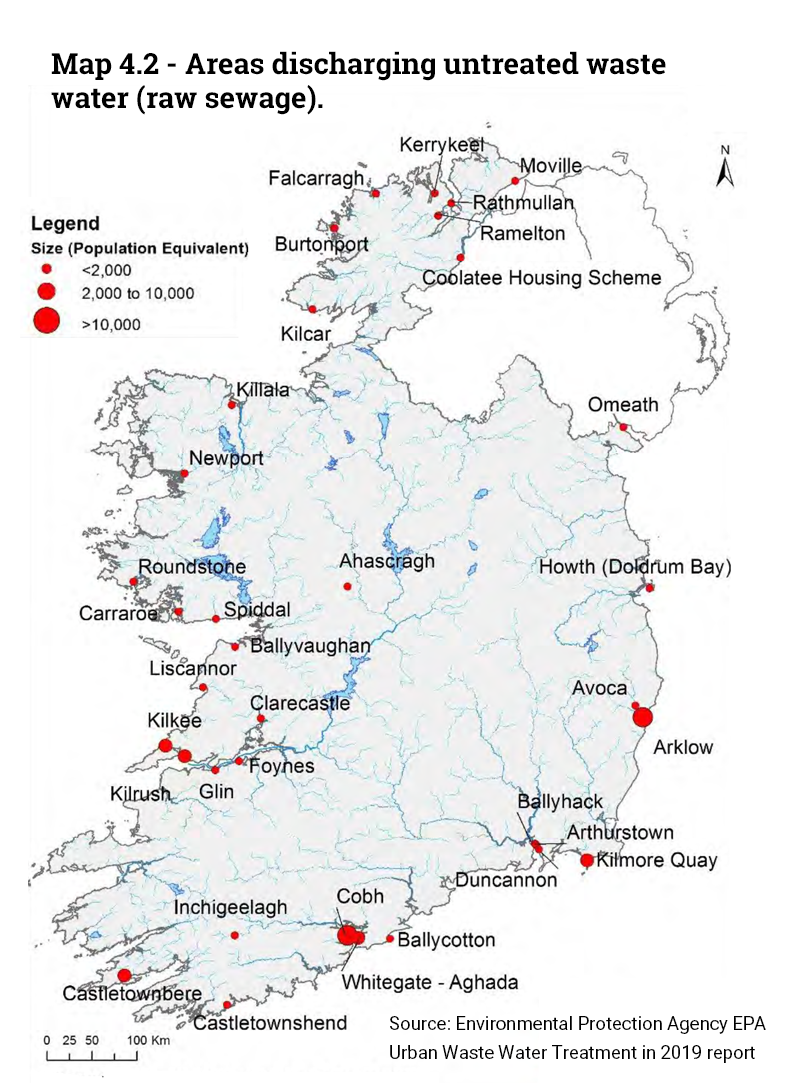
Map 4.2 shows that untreated waste water from the equivalent of 78,000 people in 35 towns and villages was still released into the environment every day in mid-2020.
SDG 6.3.2 Proportion of bodies of water with good ambient water quality is reported by the Environmental Protection Agency (EPA) in the Water Quality in Ireland 2013-2018 report and Water Quality 2019 - An Indicators Report
Water quality monitoring in Ireland is carried out under the Water Framework Directive (WFD). The EPA undertakes a full assessment of water quality in Ireland every three years.
Under the WFD there is a single framework to allow comparison of results across Europe. Rivers and lakes are classified into five ecological status quality classes under the WFD (High, Good, Moderate, Poor and Bad). ‘High’ status is when the water is not polluted at all, and ‘Bad’ status is when the water is most polluted. Groundwater is classified into two quality classes (Good and Poor status).
Good ambient water quality for Indicator 6.3.2 was taken to mean that the river, lake or groundwater body was classified at ‘Good’ or ‘High’ status based on the 2013-2018 WFD assessment. Good ambient water quality was recorded in 59% of water bodies in Ireland. The proportion of rivers with good ambient water quality was 53%, while 50% of lakes and 92% of groundwater bodies had a good ambient water quality. See Table 4.10.
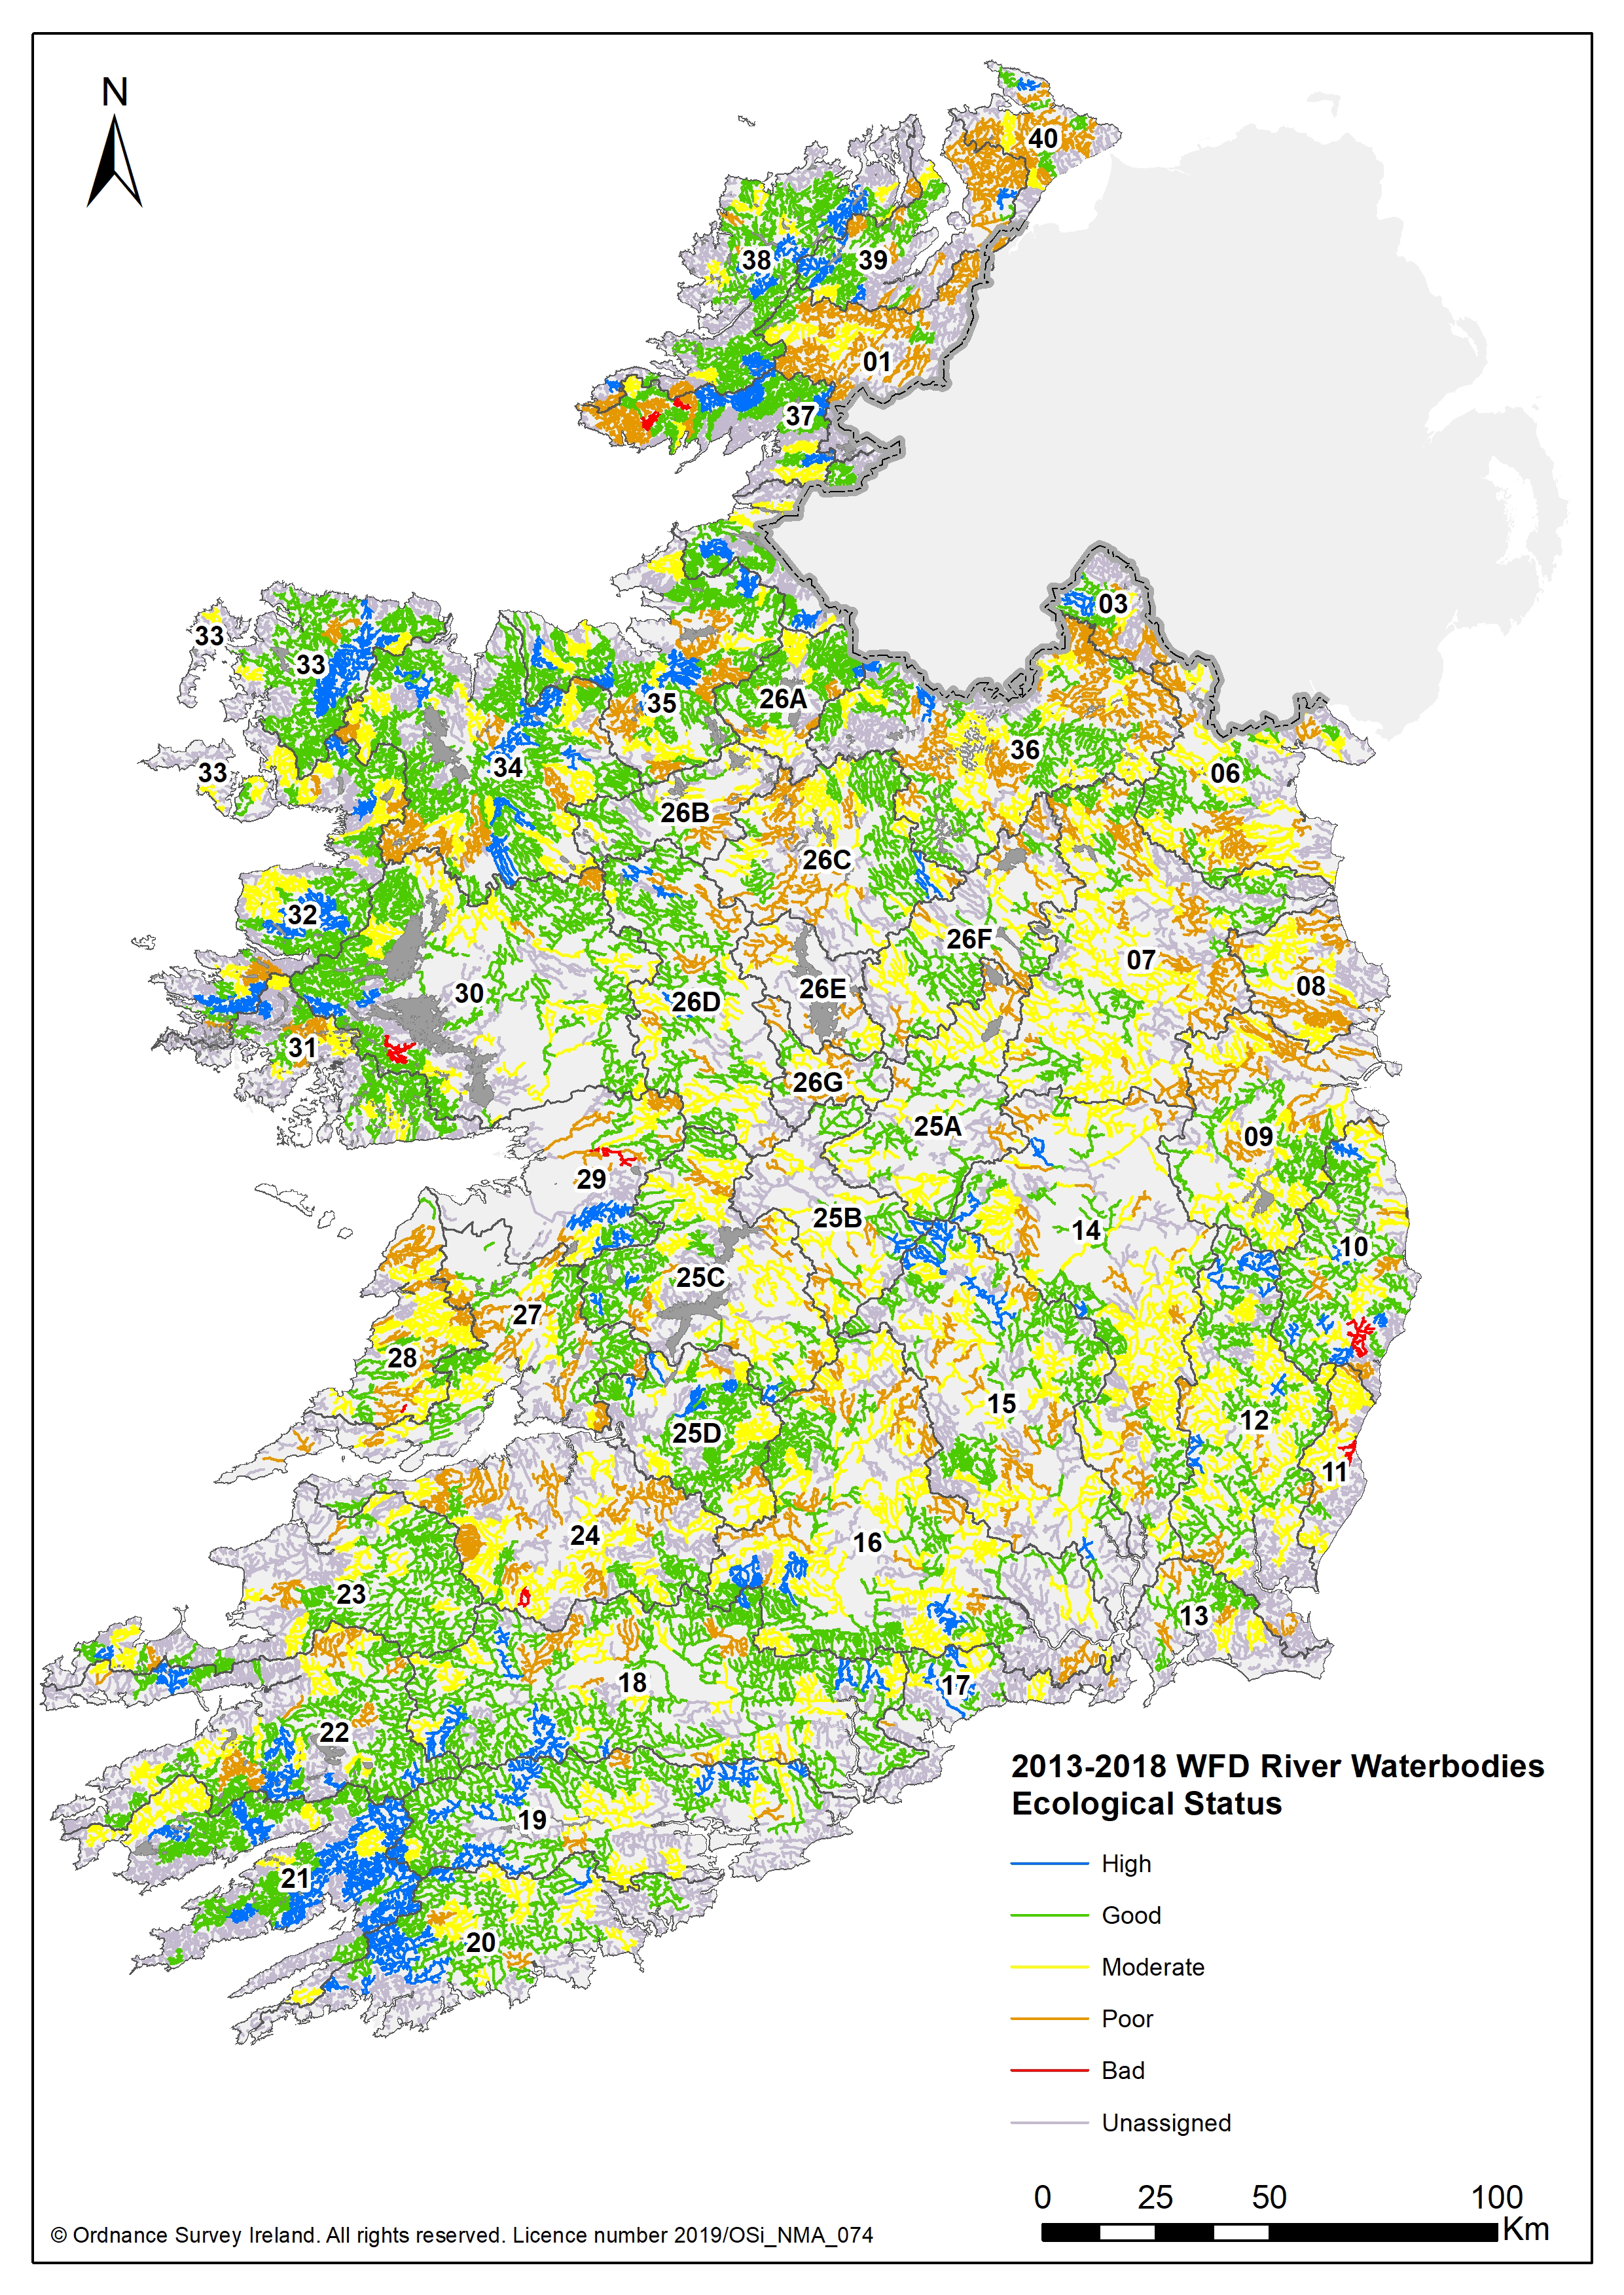
Map 4.3 illustrates the geographical distribution of ecological status for monitored river water bodies across the country. Source: EPA report on Water Quality in Ireland 2013-2018
Information about the current status of rivers, lakes and beaches as well as Data downloads and Dashboards with information about water quality and the pressures on water environment can be found on catchments.ie.
The main problem damaging our waters is the presence of too much nutrients such as phosphorus and nitrogen which come primarily from agriculture and waste water. Information on the nutrient levels in Ireland’s rivers, lakes, transitional and coastal waters and groundwater is presented in the EPA Water Quality 2019 - An Indicators Report. Some of the findings for key nutrients are presented below.
Over a third (34%) of sites have unsatisfactory phosphate concentrations. One quarter (26%) of sites are showing an increasing phosphate trend for the period 2017-2019. See Figure 4.2.
Rivers average phosphate concentration 2017-2019 compared with environmental quality standards to support the achievement of High Ecological Status (<0.025 mg/l P) and Good Ecological Status (<0.035 mg/l P).
| River Phosphate Quality, 2017-2019 | |
| High | 50 |
| Good | 16 |
| Unsatisfactory | 34 |
Lakes
Over a quarter of lakes (27%) had unsatisfactory total phosphorus concentrations with 22% showing an increasing trend. See Figure 4.3.
Lakes average total phosphorus concentration 2017-2019 compared with environmental quality standards to support the achievement of High Ecological Status (<0.01 mg/l P) and Good Ecological Status (<0.025 mg/l P).
| Lake Total Phosphorus Quality, 2017-2019 | |
| High | 35 |
| Good | 38 |
| Unsatisfactory | 27 |
Groundwaters
Over a fifth (22%) of sites have high (>25mg/l N03) nitrate concentrations and three sites (2%) exceed the drinking water standard (>50 mg/l N03). See Figure 4.4.
| Groundwater Nitrate Concentration, 2017-2019 | |
| <5 | 20 |
| 5-10 | 21 |
| 10-25 | 37 |
| 25-37.5 | 16 |
| 37.5-50 | 4 |
| >50 | 2 |
Estuaries and Costal Waters
Loads of total nitrogen and total phosphorus to the marine environment from our rivers have increased by 24% (13,559 tonnes) and 31% (338 tonnes) respectively since 2012-2014. The assessment is based on total nitrogen and total phosphorus load inputs from 19 major rivers into the marine environment. These provide an indicator of the loss of nutrients from land-based sources. See Figure 4.5 and Figure 4.6.
| Total Nitrogen Loads | |
| 2012-2014 | 56705 |
| 2014-2016 | 59462 |
| 2017-2019 | 70264 |
| Total Phosphorus Loads | |
| 2012-2014 | 1074 |
| 2014-2016 | 1206 |
| 2017-2019 | 1412 |
Go to next chapter: Water Management
Learn about our data and confidentiality safeguards, and the steps we take to produce statistics that can be trusted by all.