
In this chapter:
SDG 6.1.1 Proportion of population using safely managed drinking water services; information on this indicator is provided by data from the following sources:
The SDG indicators metadata repository provides the following official WHO/UNICEF Joint Monitoring Programme definition in the SDG 6.1.1 metadata document:
The proportion of the population using safely managed drinking water services is defined as the proportion of population using an improved drinking water source which is accessible on premises, available when needed and free from faecal and priority chemical contamination. ‘Improved’ drinking water sources include: piped supplies, boreholes and tubewells, protected dug wells, protected springs, rainwater, water kiosks, and packaged and delivered water.
On 13 March 2026 a note was added to the statement pointing to the SDG metadata repository stating the official providers of the definition. The Infobyte was amended to display the disaggregated data on public mains, as private wells are not regulated and therefore information on their water quality is not available. A footnote was added to Table 4.1 to give further clarity on "Other Private Source". We apologise for any inconvenience caused.
Census of Population 2022 Profile 2 - Housing in Ireland shows that virtually all households had a piped water supply.
Households connected to the public mains supply accounted for 80.1% of all households in 2022, up from 77% in 2016. Group water schemes (public and private) accounted for 7.7% of domestic water supply, while other private water sources accounted for 9.9% of households. See Table 4.1.
Over 82% of private housing units owned by householders aged 25-44 years in 2022 were connected to the public water mains supply. For householders aged 55 years and over, the figure was just over 77% of householders. See Table 4.2.
In 2022 just over 45% of households in Monaghan were connected to the public mains supply, the smallest percentage of any local authority. The Dublin local authority regions and Galway City had around 94% to 97% connected to the public mains supply. See Table 4.3 and Map 4.1.
The EPA Drinking Water Quality in Public Supplies 2023 report provides an overview of drinking water quality in Ireland for 2023, based on monitoring data from Uisce Éireann, and the regulation of public supplies by the EPA.
Uisce Éireann monitors drinking water quality in public supplies to ensure that it meets the standards set out in the Drinking Water Regulations and is safe to drink. Sample compliance rates remain consistently high year on year, with results for 2023 shown in the Drinking Water Quality in Public Supplies 2023 report. This is based on over 120,000 regulatory parameter results, from over 9,000 regulatory samples taken. This overall compliance rate compares well with the EU-wide historic compliance rate of more than 99.5% for a range of chemical parameters. While public drinking water is safe to drink, the trihalomethanes (THMs) sample compliance rate is only 95.5%, which must be improved. This is reflected in the number of drinking water supplies on the remedial action list (RAL) for THM.
The microbiological compliance rate shows that water quality from public supplies continues to remain high. In cases where the HSE/Uisce Éireann have determined that the water is not safe to drink then the public are notified of the precautionary actions to take. This is done through local/national media or direct communication to affected people. See Table 4.4 which outlines sample compliance rates for public supplies.
The EPA Drinking Water Quality in Private Group Schemes and Small Private Supplies 2023 report provides an overview of the quality of private drinking water supplies in Ireland for 2023, based on monitoring data from local authorities. Findings indicate:
SDG 6.2.1 Proportion of population using (a) safely managed sanitation services and (b) a handwashing facility with soap and water is indicated by data from CSO, Census of Population 2022 Profile 2 Housing in Ireland.
The SDG indicators metadata repository provides the following definition in the SDG 6.2.1 (a) metadata document:
The proportion of the population using safely managed sanitation services is defined as the proportion of the population using an improved sanitation facility which is not shared with other households and where excreta are safely disposed of in situ or removed and treated off-site. ‘Improved’ sanitation facilities are those designed to hygienically separate human excreta from human contact. These include wet sanitation technologies such as flush and pour flush toilets connected to sewers, septic tanks or pit latrines, and dry sanitation technologies such as dry pit latrines with slabs, ventilated improved pit latrines and composting toilets.
The SDG indicators metadata repository provides the following definition in the SDG 6.2.1 (b) metadata document:
The proportion of the population with basic hygiene services is defined as the proportion of population with a handwashing facility with soap and water available at home. Handwashing facilities may be located within the dwelling, yard or plot. They may be fixed or mobile and include a sink with tap water, buckets with taps, tippy-taps, and jugs or basins designated for handwashing. Soap includes bar soap, liquid soap, powder detergent, and soapy water but does not include ash, soil, sand or other handwashing agents.

Census of Population data shows that almost all households had a sewerage facility, indicating access to safely managed sanitation services.
Households connected to the public sewerage schemes accounted for 68.2% of all households in 2022. Individual septic tanks accounted for 25.4% of domestic sewerage facilities, while other sewerage systems accounted for 3.8% of households, and 2.3% not stated. No sewerage facility was stated for 0.3% of households. See Table 4.6.
Householders aged from 25-34 years had between 78% to 82% connection to the public sewerage schemes, the highest of all age groups. The highest proportion of individual septic tanks were in private housing units where the householders were aged 75-79 years with around 35%. See Table 4.7.
SDG 6.3.1 Proportion of domestic and industrial wastewater flows safely treated - indicative data is reported by the Environmental Protection Agency (EPA).
The SDG indicators metadata repository provides the following definition in the SDG 6.3.1 metadata document:
This indicator measures the volumes of wastewater which are generated through different activities, and the volumes of wastewater which are safely treated before discharge into the environment. Both of these indicators are measured in units of 1000 m3/day, although some data sources may use other units that require conversion. The ratio of the volume treated to the volume generated is taken as the ‘proportion of wastewater flow safely treated’.
Wastewater flows will be classified into industrial, services, and domestic flows, with reference to the International Standard Industrial Classification of All Economic Activities Revision 4 (ISIC). To the extent possible, the proportion of each of these waste streams that is safely treated before discharge to the environment will be calculated.
The EPA website section on urban wastewater treatment in Ireland indicates that in 2023 most wastewater collected in public sewers was treated at plants designed to provide secondary treatment (58.6%) or secondary treatment with nutrient removal (39.6%).
The remainder was either conveyed to plants that provide primary treatment (0.9%) or was collected at areas that have no treatment plant and discharge directly into the water environment without any treatment (0.9%). Table 4.8 shows the percentage of urban wastewater collected based on treatment type.
The EPA Urban Wastewater Treatment in 2023 report provides an overview of urban wastewater treatment in Ireland during 2023. Extracts from the EPA Urban Wastewater Treatment in 2023 report are provided below in relation to indicator SDG 6.3.1.
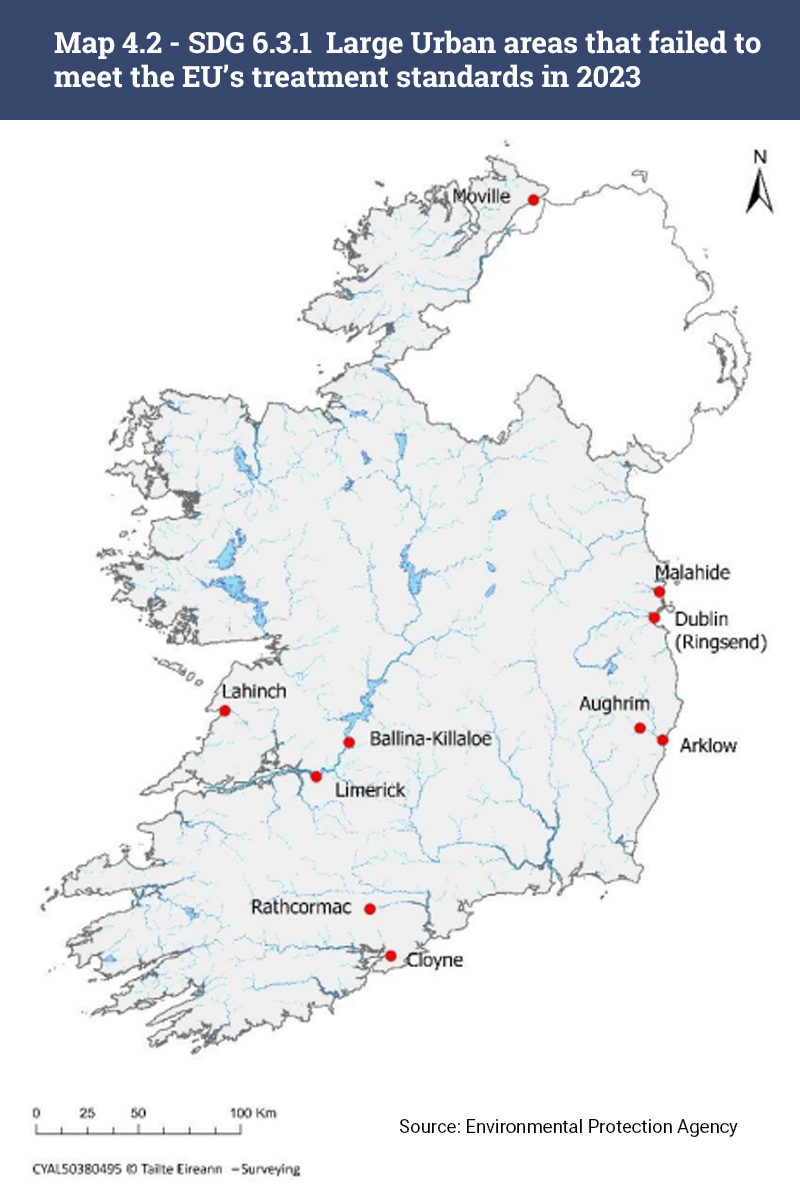
The European Union’s Urban Wastewater Treatment Directive sets requirements for treating wastewater from all large urban areas, with the objective of protecting the environment from the adverse effects of wastewater discharges. Large urban areas collectively generate 92% of Ireland’s urban wastewater. In 2023, there were 177 towns and cities in Ireland subject to these requirements. Most met the treatment and effluent quality standards but treatment at 10 areas failed to comply with these standards. See Map 4.2 below.
Table 4.9 and Figure 4.1 shows the gradual decrease from 28 to 10, in the number of areas that did not meet the directive treatment standards, from 2017 to 2023.
Half of the urban wastewater in Ireland’s large urban areas was produced in the 10 areas that failed the standards. Most of this was generated in the greater Dublin area and conveyed to Ireland’s largest treatment plant at Ringsend. Upgrades at Ringsend wastewater treatment plant to bring it up to the required standards are well advanced and are expected to be completed in 2025.
Map 4.2 shows large urban areas that failed to meet the EU’s treatment standards in 2023.
The Urban Wastewater Treatment Directive’s standards are the general European wide standards specified for large urban areas. When issuing a wastewater discharge licence the Environmental Protection Agency (EPA) takes the local environment into account and sets site-specific effluent quality standards in each licence with the aim of preventing and reducing pollution by wastewater discharges, achieving at least good status in the receiving waters and preventing any deterioration in existing status. Where necessary, the standards in licences are stricter and include a broader range of parameters than those in the Urban Wastewater Treatment Directive. EPA licence standards apply at over 500 sites, including over 300 that are below the size thresholds specified in the Directive. The revised Urban Wastewater Treatment Directive entered into force on 01st January 2025. The revised directive broadens the scope to smaller agglomerations, covers more pollutants and contributes to energy neutrality. EU member states will have to transpose and implement the directive by certain dates.
Significant work remains to bring wastewater treatment in Ireland up to the standards set in EPA licences. In 2023 over half (58%) of licensed sites did not always comply with these standards. The scale of non-compliances range from sites that regularly breached the standards and require infrastructure upgrades to sites that only had an occasional breach during the year, which can be resolved by improving the operation and management of treatment plants.
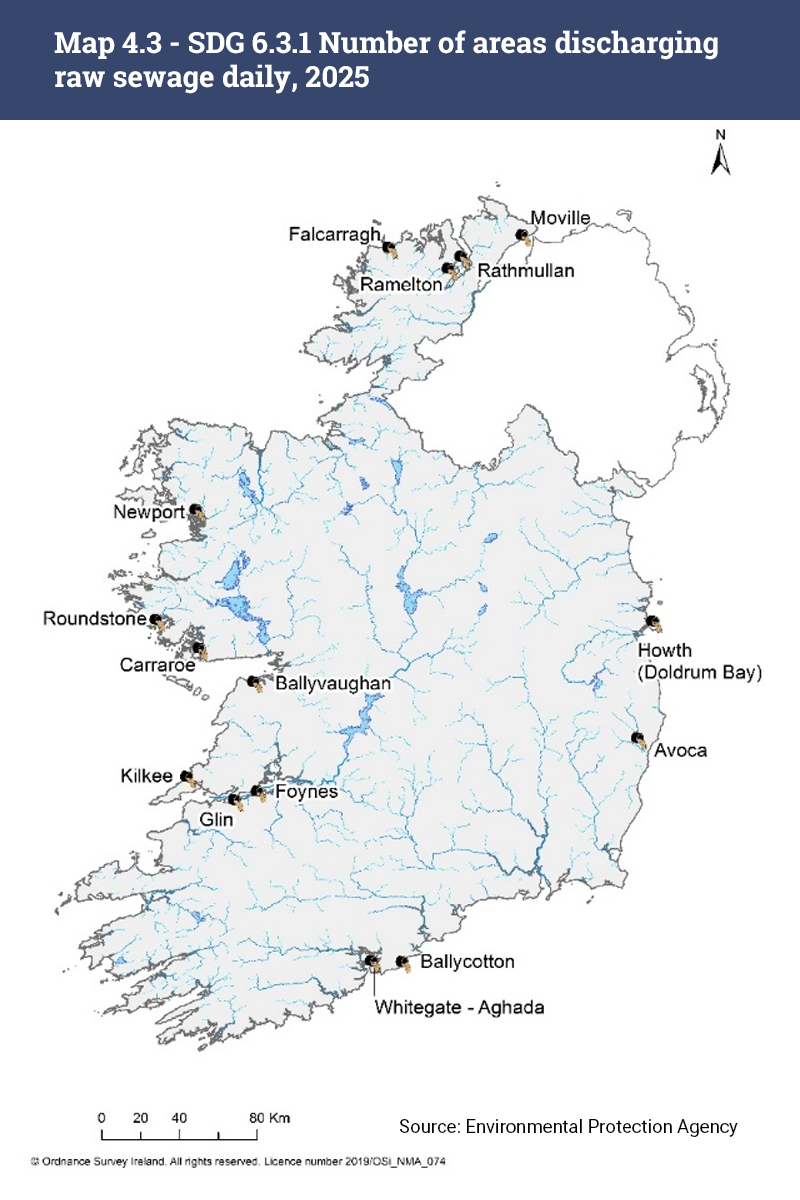
Table 4.10 and Figure 4.2 charts progress since 2014 in reducing the number of areas with no wastewater treatment. Despite the recent progress, raw sewage from 15 towns and villages still discharge into seas and rivers every day because these areas do not have treatment plants. See Map 4.2 for these locations.
Based on Uisce Éireann’s latest plans, four more areas will be connected to treatment plants by the end of 2025 and the remaining 11 areas are scheduled to receive treatment between 2027 and 2030.
SDG 6.3.2 Proportion of bodies of water with good ambient water quality is reported by the Environmental Protection Agency (EPA) in the Water Quality in Ireland 2016-2021 report and Water Quality 2023 - An Indicators Report.
The SDG indicators metadata repository gives the definition and information on SDG 6.3.2 in the metadata document:
The indicator is defined as the proportion of water bodies in the country that have good ambient water quality.
Water quality monitoring in Ireland is carried out under the Water Framework Directive (WFD). The EPA undertakes a full assessment of water quality in Ireland every three years.
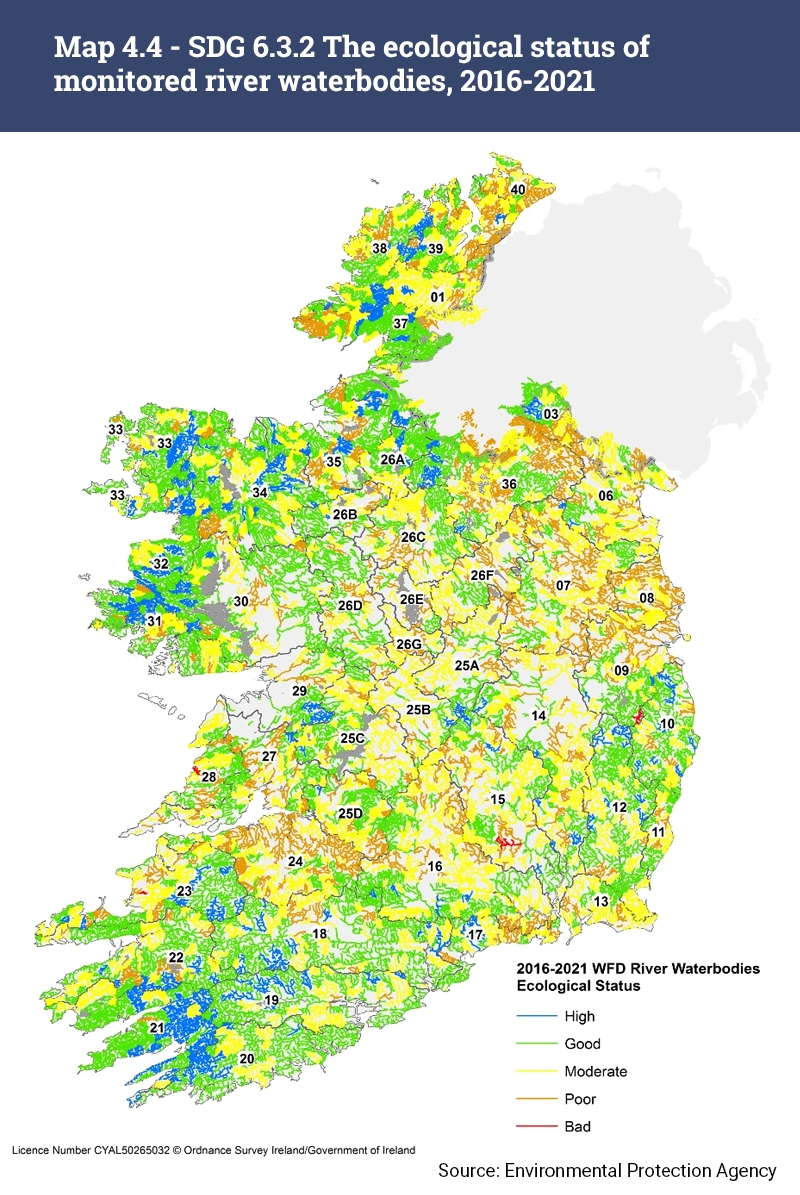
Under the WFD there is a single framework to allow comparison of results across Europe. Rivers and lakes are classified into five ecological status quality classes under the WFD (High, Good, Moderate, Poor and Bad). ‘High’ status is when the water is not polluted at all, and ‘Bad’ status is when the water is most polluted. Groundwater is classified into two quality classes (Good and Poor status).
Good ambient water quality for Indicator 6.3.2 was taken to mean that the river, lake or groundwater body was classified at ‘Good’ or ‘High’ status based on the 2016-2021 WFD assessment. Good ambient water quality was recorded in 58% of water bodies in Ireland. The proportion of rivers with good ambient water quality was 50%, while 69% of lakes and 91% of groundwater bodies had a good ambient water quality. See Table 4.11.
When comparing overall water quality in Ireland to the EU-27, we have the 3rd best percentage of ‘High’ status waterbodies in the EU-27 as per the latest 3rd Cycle RBMP. Our ‘Good’ status waterbodies rank 9th in the EU-27. Ireland also has significantly less ‘Bad’ status waterbodies compared to the EU-27. This includes waterbodies identified as rivers, lakes, transitional and coastal waters. See Figure 4.3 for the comparison of the percentage of waterbody status in Ireland vs the EU-27 average.
Map 4.4 illustrates the geographical distribution of ecological status for monitored river water bodies across the country. Source: EPA 2022, Water Quality in Ireland 2016-2021.
Information about the current status of rivers, lakes and beaches as well as Data downloads and Dashboards with information about water quality and the pressures on water environment can be found on catchments.ie.
The main problem damaging our waters is the presence of too many nutrients entering our waterways such as phosphorus and nitrogen which come primarily from agriculture and wastewater. Information on the nutrient levels in Ireland’s rivers, lakes, transitional and coastal waters and groundwater is presented in the EPA Water Quality 2023 - An Indicators Report. Some of the findings for key nutrients are presented below.
Over one quarter (27%) of sites have unsatisfactory phosphate concentrations while the remaining sites have phosphate concentrations at levels which support good ambient water quality. Phosphate levels in rivers fluctuate annually but have been broadly stable over recent years. See Figure 4.4.
| National river phosphate quality, 2021-2023 | |
| High | 58 |
| Good | 15 |
| Unsatisfactory | 27 |
Rivers average phosphate concentration 2021-2023 compared with environmental quality standards to support the achievement of High Ecological Status (<0.025 mg/l P) and Good Ecological Status (<0.035 mg/l P).
A total of 42% of river sites nationally have unsatisfactory nitrate concentrations (above 8 mg/l NO3) considered too high to maintain good ambient water quality. See Figure 4.5.
| National river nitrate quality, 2021-2023 | |
| High | 40 |
| Good | 18 |
| Unsatisfactory | 42 |
Rivers average nitrate concentration 2021-2023. There are currently no environmental quality standards for nitrate in rivers, however, average nitrate concentration values less than 4 mg/l NO3 (0.9 mg/l N) and less than 8 mg/l NO3 (1.8 mg/l N) are needed to maintain high and good quality surface waters, respectively.
Over one third (35%) of lakes had unsatisfactory total phosphorus concentrations while the remaining sites, or 65% have phosphate concentrations at levels which support good ambient water quality. See Figure 4.6.
| National lake total phosphorus quality, 2021-2023 | |
| High | 31 |
| Good | 34 |
| Unsatisfactory | 35 |
Lakes average total phosphorus concentration 2021-2023 compared with environmental quality standards to support the achievement of High Ecological Status (<0.01 mg/l P) and Good Ecological Status (<0.025 mg/l P).
One-fifth (20%) of monitoring sites had nitrate concentrations greater than 25 mg/l NO3 (considered as a high nitrate concentration). One monitoring site exceeded the drinking water standard (>50 mg/l NO3). See Figure 4.7.
Details on nitrate concentrations in groundwater including the reference for Figure 4.7 can be found in the EPA Water Quality in 2023 - An Indicators Report (includes EPA scientific colour coded bar chart).
| National nitrate concentration in groundwater (mg/l NO3), 2021-2023 | |
| <4 | 18 |
| 4-8 | 20 |
| 8-11.5 | 13 |
| 11.5-16 | 13 |
| 16-25 | 17 |
| 25-37.5 | 14 |
| >37.5 | 5 |
Groundwater average nitrate concentration 2021-2023. Nitrate concentrations in groundwater that are higher than 11.5 mg/l NO3 are usually indicative of inputs relating to human activities, anything above 25 mg/l NO3 is considered an elevated nitrate concentration. The Irish groundwater Water Framework Directive threshold value is 37.5 mg/l NO3. Groundwater is widely abstracted for drinking water in Ireland and the drinking water standard of 50 mg/l NO3 relates to the potential for harm to human health.
Loads of total oxidised nitrogen and phosphorus to the marine environment from our rivers has remained relatively unchanged in recent years at over 40,000 tonnes of nitrogen and 700 tonnes for phosphorus, respectively. The assessment is based on total nitrogen and total phosphorus load inputs from 19 major rivers into the marine environment. These provide an indicator of the loss of nutrients from land-based sources. See Figure 4.8 and Figure 4.9.
| year | Normalised Total Oxidised Nitrogen (TON) loads |
|---|---|
| 2010 | 41109.6039493741 |
| 2011 | 39575.5409419145 |
| 2012 | 38636.7942602848 |
| 2013 | 37566.7611464045 |
| 2014 | 44601.6067458631 |
| 2015 | 40604.9791901226 |
| 2016 | 38317.3815080965 |
| 2017 | 38162.8915199374 |
| 2018 | 46530.1181605337 |
| 2019 | 52400.6216397026 |
| 2020 | 41927.1229360242 |
| 2021 | 41817.3832406396 |
| 2022 | 45709.4503919227 |
| 2023 | 42608.48079408 |
| Normalised Phosphate loads | |
| 2010 | 624.831392756744 |
| 2011 | 712.600840336012 |
| 2012 | 705.243238843712 |
| 2013 | 528.919396006786 |
| 2014 | 554.145796534033 |
| 2015 | 615.658104963123 |
| 2016 | 684.982195383938 |
| 2017 | 753.209900464287 |
| 2018 | 699.254604762347 |
| 2019 | 640.380460585692 |
| 2020 | 761.872419337301 |
| 2021 | 682.383965724596 |
| 2022 | 703.060742188167 |
| 2023 | 707.061778660238 |
Footnote: Phosphate (PO4)
Both nitrogen and phosphates load to the marine environment can fluctuate between years depending on the weather, particularly rainfall. To remove the influence of inter-annual changes in river flow, the inputs are normalised by a factor which represents the long-term average flow rate for each river.
Learn about our data and confidentiality safeguards, and the steps we take to produce statistics that can be trusted by all.