
SDG 10.a.1 Proportion of tariff lines applied to imports from least developed countries and developing countries with zero-tariff is available from EU trade agreements.
EU Trade Agreements are outlined by the European Commission.
At present, the EU has in place the largest trade network in the world, with over 40 individual agreements with countries and regions. These agreements facilitate the trade of products and services between the EU and its outside partners.
New agreements are still being added to the list and older agreements are being reviewed and updates negotiated with the partner countries.
Some of the agreements focus mainly on tariff elimination:
Others include much broader commitments on opening up trade in goods and services, as well as on investments, public procurement, competition, subsidies and regulatory issues:
These agreements aim to develop stronger rules-based and values-based trade regimes with the trading partner countries concerned and include dedicated provisions on trade and sustainable development.
The most recent ones also have specific provisions to address challenges faced by modern economies and societies, such as the Economic Partnership Agreement with Japan, which includes a chapter on small and medium-sized enterprises, as well as dedicated provisions on information and telecommunications services, and e-commerce.
A specific type of agreements concentrate on the tightening of economic links between the EU and its neighbours by bringing their regulatory frameworks closer to EU law, notably in trade-related areas. This is true for instance for the agreements with:
Another special type of agreements have an explicit development objective. They are asymmetric trade agreements, with the ACP (African, Caribbean and Pacific countries) side liberalising around 80% of trade over a period of 15 to 20 years, while the EU grants duty-free, quota-free access from day one.
For the time being, most such agreements cover trade in goods and development cooperation. The Economic Partnership Agreement (EPA) with the Caribbean also includes provisions on services, investment and other trade-related topics.
Under these agreements, the EU provides substantial trade-related assistance to support partner countries in implementing the agreements, strengthening export competitiveness and building economic infrastructure. The countries concerned belong to the African, Caribbean and Pacific regions:
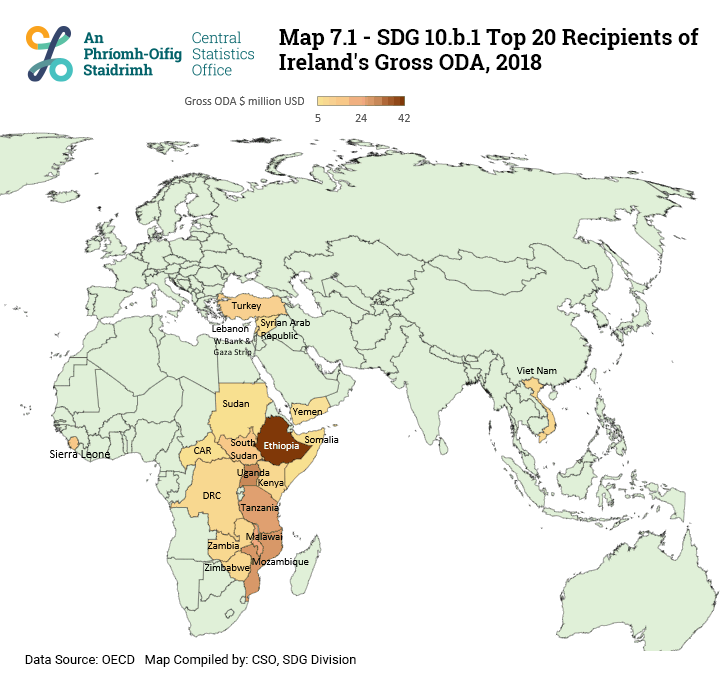
SDG 10.b.1 Total resource flows for development, by recipient and donor countries and type of flow (e.g. Official development assistance, foreign direct investment and other flows) is published in the Dept. Foreign Affairs' Official Development Assistance Annual Report 2019 and the OECD report OECD Development Co‑operation Peer Reviews IRELAND 2020.
The OECD published the OECD Development Co‑operation Peer Reviews IRELAND 2020 report on Ireland's aid.
The OECD Development Assistance Committee (DAC) conducts periodic reviews of the individual development co-operation efforts of DAC members. The policies and programmes of each member are critically examined approximately once every five to six years, with five members reviewed annually.
The Peer Review of Ireland involved an extensive process of consultation with actors and stakeholders in Dublin and Limerick, Ireland and Addis Ababa, Ethiopia, in September and October 2019. The resulting report, which contains both the main findings and recommendations of the DAC and the analytical report of the Secretariat, was approved on 2 April 2020.
The peer review took into account the political and economic context in Ireland, to the extent that it shapes Ireland’s development co-operation policies and systems. However, the drafting of the peer review including its main findings and recommendations preceded the COVID-19 pandemic.
Between 2015 and 2018, ODA volumes increased from USD 727 million to USD 891 million (constant 2017 prices) – still below its pre-crisis peak in 2008 (USD 1,042 million). ODA as a percentage of GNI stood at 0.31% in 2018, down from 0.38% in 2014.
Ireland's aid at a glance can be seen in Table 7.1.
Official Development Assistance (ODA) averaged USD 974 million each year between 2004 and 2008. It dropped to USD 934 million by 2018. As a percentage of Gross National Income (GNI), ODA fell from 0.51% in the period 2004-2008 to 0.31% by 2018. See Table 7.2.
Multilateral ODA accounted for USD 385 million and Bilateral ODA accounted for USD 506 million of the total ODA in 2018. See Table 7.3
| Multilateral ODA (right scale) | Bilateral ODA (right scale) | Total ODA (right scale) | ODA as % of GNI (left scale) | |
| 2010 | 286.944715 | 541.862656 | 828.816631 | 0.522686 |
| 2011 | 277.710211 | 541.062591 | 818.772802 | 0.512102 |
| 2012 | 258.342381 | 508.892444 | 767.234825 | 0.469808 |
| 2013 | 272.437736 | 495.018832 | 767.447495 | 0.46194 |
| 2014 | 269.891227 | 472.302823 | 742.203148 | 0.375105 |
| 2015 | 294.441942 | 432.724172 | 727.166114 | 0.317612 |
| 2016 | 384.335167 | 436.964054 | 821.299221 | 0.318687 |
| 2017 | 345.4 | 492.63 | 838.03 | 0.3174 |
| 2018 | 385.041667 | 505.631744 | 890.673411 | |
| 2018* | 385.041667 | 505.631744 | 934.25 | 0.314341 |
The highest proportion of Bilateral ODA went to Country Programmable Aid (29%), followed by Humanitarian & Food Aid (24%). Support to NGOs accounted for 20% of Bilateral ODA. See Figure 7.2.
| Composition of Bilateral ODA | No Entry Here | No Entry Here | No Entry Here | No Entry Here | No Entry Here | |
| Humanitarian & Food Aid | 24 | |||||
| Administrative Costs | 6 | |||||
| Refugees in Donor Country | 11 | |||||
| Other & Unallocated | 10 | |||||
| Support to NGOs | 20 | |||||
| Country Programmable Aid | 29 |
EU institutions accounted for over half (57%) of multilateral ODA, while UN agencies accounted for over a quarter (27%) of multilateral ODA. See Figure 7.3.
| ODA Flows | No Entry Here | No Entry Here | No Entry Here | No Entry Here | No Entry Here | |
| Regional Development Banks | 2 | |||||
| World Bank Group | 7 | |||||
| EU Institutions | 57 | |||||
| UN Agencies | 27 | |||||
| Other Multilateral | 7 |
The top five recipient countries of bilateral ODA averaged over the years 2017 and 2018 were Ethiopia, Uganda, Mozambique, Tanzania and Malawi. bOver this time period, these countries received 29% of bilateral ODA while the top ten recipients accounted for 40%. See Table 7.4 and Map 7.1.
Nearly half (45%) of bilateral ODA from Ireland in 2017 and 2018 was for social infrastructure and services. Humanitarian aid accounted for 24% while refugees in donor countries made up 10%. See Table 7.5 and Figure 7.4.
| Gross Bilateral ODA | |
| Economic Infrastrusture | 1 |
| Multisector | 5 |
| Production | 7 |
| Other Social Infrastructure | 20 |
| Education, Health and Population | 22 |
| Unspecified | 23 |
| Humanitarian Aid | 23 |
Official Development Assistance (ODA) Annual Report 2019
The Dept. Foreign Affairs' Official Development Assistance (ODA) Annual Report 2019 shows that Ireland's ODA was €870 million in 2019, and accounted for 0.32% of GNP. This was an annual increase of 9.9% from €792 million in 2018.
Figures finalised after publication of the ODA Annual Report 2019 are available in the Annex for final 2019 data. Bilateral ODA was €508 million in 2019, which accounted for 58% of Total ODA. See Table 7.7 and Figures 7.5 to 7.8.
| Year | ODA as a % of GNP |
|---|---|
| 2000 | 0.3 |
| 2001 | 0.33 |
| 2002 | 0.41 |
| 2003 | 0.4 |
| 2004 | 0.39 |
| 2005 | 0.43 |
| 2006 | 0.53 |
| 2007 | 0.53 |
| 2008 | 0.59 |
| 2009 | 0.55 |
| 2010 | 0.53 |
| 2011 | 0.5 |
| 2012 | 0.47 |
| 2013 | 0.46 |
| 2014 | 0.39 |
| 2015 | 0.32 |
| 2016 | 0.32 |
| 2017 | 0.32 |
| 2018 | 0.31 |
| 2019 | 0.32 |
| Year | ODA Euro million |
|---|---|
| 2000 | 254.86 |
| 2001 | 319.9 |
| 2002 | 422.06 |
| 2003 | 445.71 |
| 2004 | 488.92 |
| 2005 | 578.46 |
| 2006 | 813.96 |
| 2007 | 870.87 |
| 2008 | 920.66 |
| 2009 | 722.2 |
| 2010 | 675.84 |
| 2011 | 657.04 |
| 2012 | 628.9 |
| 2013 | 637.1 |
| 2014 | 614.86 |
| 2015 | 647.56 |
| 2016 | 725.78 |
| 2017 | 743.42 |
| 2018 | 791.63 |
| 2019 | 869.54 |
| Channel | % | No Entry Here | No Entry Here | No Entry Here | No Entry Here | No Entry Here |
|---|---|---|---|---|---|---|
| Multilateral Orgs. | 56 | |||||
| Non Governmental Organisations | 21 | |||||
| Government Systems in Partner Countries | 6 | |||||
| Delegated Cooperation | 1 | |||||
| Other Channels | 16 |
| Sector | % | No Entry Here | No Entry Here | No Entry Here | No Entry Here | No Entry Here |
|---|---|---|---|---|---|---|
| Humanitarian Assistance | 21 | |||||
| Health Hiv and Aids | 10 | |||||
| Social Protection | 4 | |||||
| Multi Sector | 25 | |||||
| Agriculture | 5 | |||||
| Education | 8 | |||||
| Programme Management & Admin | 7 | |||||
| Human Rights Governance Gender Equality | 14 | |||||
| Other | 6 |
The FAO published the report FAO + Ireland Partnering for a peaceful, equal and sustainable world in 2021. An extract from the Report's 'Foreword by FAO Director-General' is provided here.
Ireland and the Food and Agriculture Organization of the United Nations (FAO) have been partners for more than 70 years, working across common priorities to address the world’s most pressing challenges related to food security and nutrition. Ireland’s international development policy, A Better World, justly highlights how the country has stepped up its commitment in responding to the changing global context, including through its increased efforts in tackling climate change, gender inequality and improving humanitarian aid. This, together with the country’s leading role in modern and scientific-based agriculture, food safety, traceability and environmental sustainability has allowed us to harness innovation and leverage our expertise through enhanced coordination. In particular, I applaud Ireland for its continuous and active engagement in creative knowledge-sharing platforms and partnerships that drive novel, sustainable and multi-partner solutions, which help to transform our food systems. Ireland’s ongoing support for multilateralism and the United Nations system is as essential to achieving the 2030 development agenda as it is to addressing the immense challenges that crises, conflict and forced migration continue to pose today.
The full report is accessed here under FAO + Ireland Partnering for a peaceful, equal and sustainable world
SDG 10.c.1 Remittance costs as a proportion of the amount remitted, information is published by the World Bank.
The Target for this SDG indicator is: ‘Target 10.c: By 2030, reduce to less than 3 per cent the transaction costs of migrant remittances and eliminate remittance corridors with costs higher than 5%’.
The Definition in the UN metadata document for SDG 10.c.1 is as follows:
The target includes two components.
The first component is that transaction costs for migrant remittances should be 3% or less by 2030. This transaction cost should be intended as “Global average total cost of sending $200 (or equivalent in local sending currency) and expressed as % of amount sent”. This indicator is readily available and published on a quarterly basis by the World Bank in the Remittance Prices Worldwide database, which covers 365 country corridors, from 48 sending to 105 receiving countries.
The second component is to eliminate corridor where cost is 5% or higher. This should be intended in the sense that it should be possible for remittance senders to send money to the beneficiary for an average cost of 5% or less of the amount sent. For this purpose, it should suffice that in each corridor there are at least 3 services, meeting a defined set of service requirements (including service quality, reach etc), for which the average is 5% or less.
The World Bank report on Remittance Prices Worldwide Quarterly (RPW) for quarter 4 2020 monitors remittance prices across all geographic regions of the world. Launched in September 2008, RPW monitors the cost incurred by remitters when sending money along major remittance corridors. RPW is used as a reference for measuring progress towards global cost reduction objectives, including the G20 commitment to reduce the global average to 5%, which is being pursued in partnership with governments, service providers, and other stakeholders.
Since Q2 2016, RPW covers 48 remittance sending countries and 105 receiving countries, for a total of 367 country corridors worldwide. RPW tracks the cost of sending remittances for four main RSP types: Banks, MTOs, Mobile Operators, and Post Offices. MTOs (Money Transfer Operators) include both traditional providers and innovative/fintech players. On average, 13.3 providers per corridor are tracked.
This Report uses data from RPW’s most recent release to analyse the global, regional, and country specific trends in the average cost of migrant remittances.
Key Findings
Global Average Total experiences reduction
In Q4 2020, the Global Average cost for sending remittances was 6.51%. The Global Average has remained below 7% since Q1 2019. Overall, this represents a decline of 3.16 percentage points since Q1 2009, when the figure was recorded at 9.67%. In addition to the Global Average, another average total cost is introduced to track the average price of “digital remittances” in RPW database. In Q4 2020, the global average for digital remittances was recorded at 5.11%, while the global average for non-digital remittances was 6.99%. See Table 7.6.
The International MTO index tracks the prices of Money Transfer Operators (MTOs) that are present in at least 85% of corridors covered in the RPW database. This index fell from 8.23% in 2017 to 6.56% by 2020. This is a reduction of 3.80 percentage points from its first recorded value of 10.36% in Q1 2009.
Additional information is available from the World Bank report on Remittance Price Comparison Databases.
Go to next chapter: Background Notes
Learn about our data and confidentiality safeguards, and the steps we take to produce statistics that can be trusted by all.