
| Table 3.1: Volume and Value of Non-Household market dwelling transactions filed with Revenue, 2010 - 2017 | |||||||||
| Direction | Indicator | 2010 | 2011 | 2012 | 2013 | 2014 | 2015 | 2016 | 2017 |
| Purchases | Volume | 774 | 760 | 1,421 | 1,737 | 4,538 | 6,892 | 6,266 | 8,766 |
| Value (€ million) | 171.9 | 176.2 | 297.0 | 325.3 | 913.5 | 1,274.2 | 1,360.5 | 2,079.2 | |
| Sales | Volume | 4,482 | 3,153 | 4,109 | 4,819 | 8,788 | 13,263 | 12,590 | 16,031 |
| Value (€ million) | 1,066.7 | 662.4 | 763.9 | 842.3 | 1,595.6 | 2,516.1 | 2,902.9 | 4,317.5 | |
The non-household sector comprises private companies, charitable organisations and state institutions. The non-household sector is a significant actor in the Irish residential property market, both in terms of purchases and sales. This chapter provides additional detail on non-household sector dwelling transactions, on an annual basis, for the years 2010 to 2017. This information will be updated annually going forward.
In 2017 the total residential property market comprised of 52,128 dwelling purchases with a value of €13.9 billion. Of these, the non-household sector made up 8,766 purchases with a total value of €2.1 billion. Apart from 2016, the volume of non-household purchases has increased every year since 2011, when just 760 non-household purchases were made. The value of non-household purchases has increased consistently from 2010, when the non-household sector spent just €171.9 million on dwellings.
In contrast, in 2017 the non-household sector sold 16,031 dwellings on the market. These had a total value of €4.3 billion. The low point for both the volume and value of non-household sales was 2011 (3,153 and €662.4 million respectively).
From 2010 to 2017, in terms of both the volume and value, non-household dwelling sales exceeded non-household purchases (see Figure 3.1).
| Year | Purchases | Sales |
|---|---|---|
| 2010 | 0.2 | 1.1 |
| 2011 | 0.2 | 0.7 |
| 2012 | 0.3 | 0.8 |
| 2013 | 0.3 | 0.8 |
| 2014 | 0.9 | 1.6 |
| 2015 | 1.3 | 2.5 |
| 2016 | 1.4 | 2.9 |
| 2017 | 2.1 | 4.3 |
| Table 3.2A: Value of Non-Household Sector market purchases filed with Revenue by NACE section, 2010-2017 | (€ million) | |||||||
| NACE Section | 2010 | 2011 | 2012 | 2013 | 2014 | 2015 | 2016 | 2017 |
| All | 171.9 | 176.2 | 297.0 | 325.3 | 913.5 | 1,274.1 | 1,360.5 | 2,079.2 |
| Construction (F) | 20.3 | 18.3 | 35.3 | 32.6 | 154.2 | 175.8 | 156.0 | 190.5 |
| Financial & Insurance (K) | 16.4 | 19.4 | 73.5 | 84.5 | 180.8 | 586.6 | 326.8 | 553.7 |
| Real Estate (L) | 7.2 | 14.4 | 46.3 | 23.5 | 369.7 | 139.9 | 171.5 | 386.4 |
| Public Administration/Education (O,P) | 17.3 | 22.1 | 35.2 | 24.3 | 25.9 | 86.8 | 237.5 | 224.5 |
| Human Health & Social Work (Q) | 69.6 | 49.2 | 30.7 | 50.0 | 37.7 | 76.5 | 196.1 | 253.2 |
| Extra-Territorial (U) | 8.0 | 16.6 | 41.3 | 48.0 | 63.4 | 69.2 | 99.6 | 276.1 |
| Other | 33.1 | 36.1 | 34.8 | 62.4 | 81.8 | 139.4 | 173.1 | 194.9 |
Within the non-household sector, NACE section K Financial and Insurance (i.e. banks, holding companies, trusts, funds and similar financial entities), purchased dwellings in the residential market with a value of €553.7 million in 2017. This is more than any other NACE section according to transactions filed with the Revenue Commissioners. In 2017 NACE section L Real Estate (i.e. real estate management companies, companies buying, selling, renting or operating their own real estate, etc.) was the second largest, purchasing dwellings with a value of €386.4 million. In contrast, in 2010 when non-household purchases overall were lowest in value terms, NACE section Q Human Health and Social Work (which includes Approved Housing Bodies, residential care institutions, etc.) was the largest, purchasing dwellings with a value of €69.6 million (See Figure 3.2).
| Construction (F) | Financial & Insurance (K) | Real Estate (L) | Public Administration / Education (O,P) | Human Health & Social Work (Q) | Extra Territorial (U) | Other | |
| 2010 | 20.3 | 16.4 | 7.2 | 17.3 | 69.6 | 8 | 33.1 |
| 2011 | 18.3 | 19.4 | 14.4 | 22.1 | 49.2 | 16.6 | 36.1 |
| 2012 | 35.3 | 73.5 | 46.3 | 35.2 | 30.7 | 41.3 | 34.8 |
| 2013 | 32.6 | 84.5 | 23.5 | 24.3 | 50 | 48 | 62.4 |
| 2014 | 154.2 | 180.8 | 369.7 | 25.9 | 37.7 | 63.4 | 81.8 |
| 2015 | 175.8 | 586.6 | 139.9 | 86.8 | 76.5 | 69.2 | 139.4 |
| 2016 | 156 | 326.8 | 171.5 | 237.5 | 196.1 | 99.6 | 173.1 |
| 2017 | 190.5 | 553.7 | 386.4 | 224.5 | 253.2 | 276.1 | 194.9 |
| Table 3.2B: Value of Non-Household Sector market sales filed with Revenue by NACE section, 2010-2017 | (€ million) | |||||||
| NACE Section | 2010 | 2011 | 2012 | 2013 | 2014 | 2015 | 2016 | 2017 |
| All | 1,066.7 | 662.4 | 763.9 | 842.3 | 1,595.6 | 2,516.1 | 2,902.9 | 4,317.5 |
| Construction (F) | 654.7 | 350.0 | 344.6 | 329.7 | 600.2 | 935.4 | 1,177.5 | 1,805.3 |
| Financial & Insurance (K) | 119.6 | 112.8 | 196.2 | 234.6 | 510.8 | 874.0 | 920.4 | 1,468.6 |
| Real Estate (L) | 109.3 | 60.9 | 62.0 | 77.4 | 143.6 | 261.4 | 315.7 | 396.2 |
| Public Administration/Education (O,P) | 45.5 | 14.1 | 13.8 | 22.6 | 13.9 | 15.1 | 13.5 | 25.5 |
| Human Health & Social Work (Q) | 4.3 | 4.2 | 4.8 | 2.8 | 13.7 | 7.2 | 2.6 | 10.1 |
| Extra-Territorial (U) | 13.4 | 22.1 | 26.2 | 50.2 | 31.5 | 45.0 | 47.4 | 59.9 |
| Other | 119.9 | 98.3 | 116.2 | 125.0 | 282.0 | 378.1 | 425.7 | 551.9 |
In terms of the value of non-household sales, NACE section F Construction was the most active in 2017, selling residential properties with a value of €1.8 billion. In fact, the construction sector had the highest value of sales from 2010 to 2017. In 2017 the second largest NACE section, in terms of dwelling sales (€1.5 billion), was division K Financial and Insurance.
| Table 3.3A: Value of Non-Household Sector market purchases filed with Revenue by registered address, 2010-2017 | (€ million) | |||||||
| Address | 2010 | 2011 | 2012 | 2013 | 2014 | 2015 | 2016 | 2017 |
| All | 171.9 | 176.2 | 297.0 | 325.3 | 913.5 | 1,274.1 | 1,360.5 | 2,079.2 |
| Ireland | 164.0 | 159.6 | 255.7 | 277.3 | 850.0 | 1,204.9 | 1,260.9 | 1,803.1 |
| Northern Ireland | 1.4 | 2.6 | 1.4 | 3.9 | 3.4 | 9.2 | 10.0 | 13.1 |
| Great Britain | 1.0 | 1.9 | 6.1 | 4.3 | 5.4 | 11.9 | 11.0 | 10.8 |
| British Crown Dependencies1 | 3.3 | 5.2 | 16.0 | 4.4 | 16.6 | 23.2 | 46.0 | 53.3 |
| Other Europe2 | 1.7 | 4.2 | 3.5 | 16.7 | 9.7 | 7.7 | 15.0 | 146.3 |
| North America3 | 0.0 | 2.4 | 13.7 | 2.8 | 19.5 | 12.5 | 14.9 | 47.6 |
| Other | 0.6 | 0.3 | 0.6 | 15.9 | 8.9 | 4.6 | 2.7 | 4.9 |
| 1. The Channel Islands and the Isle of Man | ||||||||
| 2: Europe excluding Northern Ireland, Great Britain and the British Crown Dependencies | ||||||||
| 3: Canada, USA, Mexico, Central America and the Caribbean | ||||||||
In 2017 Irish registered companies and institutions accounted for €1.8 billion (86.7%) of the €2.1 billion spent on dwellings by the non-household sector. In the same year €13.1 million was spent on dwellings by companies with a Northern Ireland address, €10.8 million by companies with a Great Britain address and €53.3 million by companies with a British Crown Dependency address. A total of €146.3 million was spent by companies with another European address. However, there is no clear pattern to these foreign purchases, with British Crown Dependencies accounting for the greatest proportions of foreign purchases in 2010, 2011, 2012, 2015 and 2016, whereas Europe (excluding Ireland, Northern Ireland, Great Britain and British Crown Dependencies) accounts for the greatest proportions in 2013 and 2017, for example (see Figure 3.3).
| Northern Ireland | Great Britain | British Crown Dependencies | Other Europe | North America | Other | |
| 2010 | 17.7 | 12.7 | 41.8 | 21.5 | 0 | 7.6 |
| 2011 | 15.7 | 11.4 | 31.3 | 25.3 | 14.5 | 1.8 |
| 2012 | 3.4 | 14.8 | 38.7 | 8.5 | 33.2 | 1.5 |
| 2013 | 8.1 | 9 | 9.2 | 34.8 | 5.8 | 33.1 |
| 2014 | 5.4 | 8.5 | 26.1 | 15.3 | 30.7 | 14 |
| 2015 | 13.3 | 17.2 | 33.5 | 11.1 | 18.1 | 6.6 |
| 2016 | 10 | 11 | 46.2 | 15.1 | 15 | 2.7 |
| 2017 | 4.7 | 3.9 | 19.3 | 53 | 17.2 | 1.8 |
| Northern Ireland | Great Britain | British Crown Dependencies | Other Europe | North America | Other | |
| 2010 | 15.4 | 12.8 | 42.3 | 21.8 | 0 | 7.7 |
| 2011 | 15.7 | 11.4 | 31.3 | 25.3 | 14.5 | 1.8 |
| 2012 | null | 15.6 | null | 8.4 | 32.8 | 1.4 |
| 2013 | 7.3 | 7 | 8.3 | 42.5 | 5.3 | 29.9 |
| 2014 | null | null | 26.4 | 15.4 | 31.1 | 14.2 |
| 2015 | 13.2 | null | null | 11.1 | 18 | 6.6 |
| 2016 | 10 | 11 | 46.6 | 15 | 14.9 | 2.7 |
| 2017 | 4.7 | 5.2 | 19 | 52.3 | 17 | 1.8 |
| Table 3.3B: Value of Non-Household Sector market sales filed with Revenue by registered address, 2010-2017 | (€ million) | |||||||
| Address | 2010 | 2011 | 2012 | 2013 | 2014 | 2015 | 2016 | 2017 |
| All | 1,066.7 | 662.4 | 763.9 | 842.3 | 1,595.6 | 2,516.1 | 2,902.9 | 4,317.5 |
| Ireland | 1,053.3 | 640.1 | 737.6 | 792.0 | 1,564.1 | 2,471.1 | 2,855.5 | 4,257.6 |
| Northern Ireland | 6.5 | 7.0 | 3.4 | 10.9 | 7.5 | 6.2 | 17.1 | 17.7 |
| Great Britain | 1.3 | 13.0 | 13.4 | 26.9 | 15.8 | 9.9 | 10.0 | 9.4 |
| British Crown Dependencies1 | 3.6 | c | 2.8 | 10.8 | 1.8 | 15.2 | 13.3 | 23.8 |
| Other Europe2 | 0.2 | 0.0 | 1.5 | 0.9 | 0.1 | 0.9 | 5.9 | 6.0 |
| North America3 | 1.8 | c | 5.1 | 0.7 | 6.4 | 12.3 | 1.0 | 3.0 |
| Other | 0.0 | 0.0 | 0.0 | 0.0 | 0.0 | 0.5 | 0.2 | 0.2 |
| 1. The Channel Islands and the Isle of Man | ||||||||
| 2: Europe excluding Northern Ireland, Great Britain and the British Crown Dependencies | ||||||||
| 3: Canada, USA, Mexico, Central America and the Caribbean | ||||||||
| c: Supressed for reasons of confidentiality | ||||||||
In 2017, Irish registered companies and institutions accounted for €4.3 billion (98.6%) of the value of all dwellings sold by the non-household sector. Europe (excluding Ireland, the United Kingdom and British Crown Dependencies) accounted for just €6.0 million (0.1%) and North America accounted for €3.0 million (0.1%) of dwelling sales.
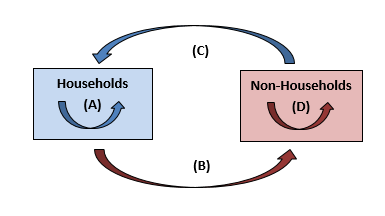
The Household and Non-Household sectors of the residential property market interact and overlap to a significant degree. Each dwelling transaction involves two parties, the buyer and the seller. A household may sell to another household or to the Non-Household Sector (represented by flows A and B respectively in figure 4 below). Conversely, a non-household company or institution may sell to the Household Sector or to another company or institution (flows C and D). Net inter-sectoral flows can be established to show the overall direction of the flow of dwellings (in volume or value terms). For example, the net value flow (C-B) represents the overall transfer of money from the Household to the Non-Household sector in the residential property market.
Figure 3.4: Household and Non-Household residential property flows
| Table 3.4: Value of market residential dwelling sales filed with Revenue by Sectoral Flow, 2010-2017 | (€ million) | |||||||||
| Year | Sales by Households | Sales by Non-Households | All Sales (A+B+C+D) | Net Non-Household Sales (C-B) | ||||||
| Sales to Households (A) | Sales to Non-Households (B) | Total (A+B) | Sales to Households (C) | Sales to Non-Households (D) | Total (C+D) | |||||
| 2010 | 4,018.2 | 102.6 | 4,120.8 | 997.4 | 69.3 | 1,066.7 | 5,187.5 | 894.8 | ||
| 2011 | 3,242.5 | 118.2 | 3,360.7 | 604.3 | 58.0 | 662.3 | 4,023.1 | 486.1 | ||
| 2012 | 3,629.9 | 152.5 | 3,782.4 | 619.3 | 144.5 | 763.8 | 4,546.2 | 466.8 | ||
| 2013 | 4,396.7 | 182.0 | 4,578.7 | 699.0 | 143.2 | 842.2 | 5,421.1 | 517.0 | ||
| 2014 | 6,316.1 | 458.7 | 6,774.8 | 1,140.8 | 454.8 | 1,595.6 | 8,370.4 | 682.1 | ||
| 2015 | 7,323.7 | 527.5 | 7,851.2 | 1,769.5 | 746.6 | 2,516.1 | 10,367.4 | 1,242.0 | ||
| 2016 | 7,655.9 | 735.3 | 8,391.2 | 2,277.7 | 625.2 | 2,902.9 | 11,294.2 | 1,542.4 | ||
| 2017 | 8,754.2 | 804.6 | 9,558.8 | 3,042.9 | 1,274.6 | 4,317.5 | 13,876.3 | 2,238.3 | ||
In 2017, in terms of the value of dwellings sold on the market, the non-household sector sold more to household buyers than non-household buyers. The non-household sector sold dwellings valued €3.1 billion to the household sector, whereas it sold just €1.3 billion within its own sector. In contrast, in 2017 households sold predominately to other households, with the intra-household market accounting for €8.8 billion of dwelling sales and sales to the non-household sector accounting for just €809.6 million. On balance, this represented a net flow of €2.2 billion to the non-household sector. Every year represented had a net flow of money to the non-household sector, with the net flow being lowest in 2012 at just €466.8 million.
The StatBank Tables are available here
Go to next chapter >>> House Prices by Eircode
Learn about our data and confidentiality safeguards, and the steps we take to produce statistics that can be trusted by all.