
The number of Building Energy Ratings (BER) audits performed in certain months have been adversely impacted by the COVID-19 pandemic. For further information please see the SEAI website.
Electricity was the main space heating fuel used in 82% of the dwellings with a Building Energy Rating (BER) audit and with construction completed during 2020-2022
There was an increase of 40% in the number of BER audits reported in Q2 2022 compared with Q2 2021
Dwellings built in 2015-2019 and 2020-2022 were considerably more energy efficient than those built in earlier periods with 96% and 99% respectively given an “A” rating
Dublin County had the highest combined “A” and “B” rating at 33% while Leitrim and Roscommon had the lowest proportion of combined “A” and “B” rating at 12%
Dublin 18 had the highest proportion of combined “A” and “B” rating at 48% and Dublin 7 had the highest proportion of combined “F” and “G” rating at 25%
| Table A: Main Space Heating Fuel by Period of Construction (2000-2022) | ||||
| % of row | number | |||
| Period of Construction | Mains Gas | Heating Oil | Electricity | BER audits |
| 2000-2004 | 41% | 36% | 19% | 174,901 |
| 2005-2009 | 45% | 31% | 18% | 161,276 |
| 2010-2014 | 49% | 30% | 17% | 11,866 |
| 2015-2019 | 47% | 5% | 48% | 52,523 |
| 2020-2022 | 17% | 0% | 82% | 28,255 |
| Mains Gas | Heating Oil | Electricity | |
| 2000-2004 | 41 | 36 | 19 |
| 2005-2009 | 45 | 31 | 18 |
| 2010-2014 | 49 | 30 | 17 |
| 2015-2019 | 47 | 5 | 48 |
| 2020-2022 | 17 | 0 | 82 |
| Earliest | Latest | |
| A | 0 | 3 |
| B1 | 1 | 3 |
| B2 | 2 | 6 |
| B3 | 5 | 14 |
| C1 | 8 | 17 |
| C2 | 11 | 15 |
| C3 | 12 | 12 |
| D1 | 14 | 10 |
| D2 | 13 | 8 |
| E1 | 9 | 4 |
| E2 | 7 | 3 |
| F | 8 | 2 |
| G | 10 | 2 |
| National Data | BER Database | |
| A | 7 | 10 |
| B1 | 1 | 2 |
| B2 | 3 | 3 |
| B3 | 7 | 8 |
| C1 | 10 | 11 |
| C2 | 12 | 12 |
| C3 | 12 | 12 |
| D1 | 12 | 11 |
| D2 | 11 | 10 |
| E1 | 6 | 6 |
| E2 | 5 | 4 |
| F | 6 | 5 |
| G | 8 | 7 |
1Dwellings with BERs have been weighted using 2016 Census of Population data to estimate a BER profile for All Dwellings at National level (see Background Notes).
| A | B | C | D | E | F-G | |
| 1700-1977 | 1 | 5 | 19 | 24 | 19 | 31 |
| 1978-1999 | 1 | 8 | 41 | 34 | 11 | 5 |
| 2000-2004 | 0 | 13 | 60 | 20 | 5 | 2 |
| 2005-2009 | 1 | 37 | 50 | 9 | 2 | 1 |
| 2010-2014 | 33 | 58 | 7 | 2 | 0 | 0 |
| 2015-2019 | 96 | 3 | 0 | 0 | 0 | 0 |
| 2020-2022 | 99 | 1 | 0 | 0 | 0 | 0 |
Learn about our data and confidentiality safeguards, and the steps we take to produce statistics that can be trusted by all.
Statistician's Comment
Commenting on the release Dympna Corry, Statistician in the Environment and Climate Division, said:" Electricity was the main space heating fuel used in 82% of the dwellings with construction completed during 2020-2022 and with a Building Energy Rating (BER) audit. This was a substantial increase from buildings constructed during 2015-2019 when 48% of dwellings with a BER audit used electricity. There was a contrasting trend for mains gas with 17% of 2020-2022 built dwellings using mains gas compared with 47% for dwellings built in 2015-2019. There was also a contrasting trend for heating oil with 0% of 2020-2022 built dwellings using heating oil compared with 5% for dwellings built in 2015-2019.
There were 30,700 BER audits reported in Q2 2022 compared with 21,974 in Q2 2021. April 2022 was 40% higher than April 2021. May 2022 was a similar 42% above May 2021. The number of completed BER audits in June 2022 was 38% above the number in June 2021. In the period 2009 to June 2022 1.2 million BER audits have been undertaken.
Dwellings built in 2015-2019 and 2020-2022 were considerably more energy efficient than those built in earlier periods with 96% and 99% respectively given an “A” rating compared with 33% in 2010-2014 and 1% in 2005-2009.
Dublin County had the highest combined “A” and “B” rating at 33%. Leitrim and Roscommon had the lowest proportion of combined “A” and “B” rating at 12%.
Dublin 18, with an average dwelling age of 18 years, had the highest proportion of combined “A” and “B” rating at 48%. The average age of dwellings in Dublin 15 that have had a BER audit was also 18 years, but the combined "A" and "B" rating was much lower at 35% than in Dublin 18. The highest proportion of combined “F” and “G” rating was 25% for Dublin 7.
The average floor area of all dwellings with a BER audit was 113 square metres. This average size varied from 161 square metres for detached houses to 60 square metres for basement dwellings.
In their earliest assessment only 8% of dwellings that have had more than one BER audit carried out received either an “A” or “B” rating compared with 26% in their most recent assessment. In contrast, 18% of dwellings were rated “F” or "G" in their first BER assessment compared with only 4% in their latest BER assessment.
The national level data weighted using Census of Population 2016 figures shows that 6% of dwellings in Ireland would have received a rating of “F” compared with 5% of dwellings that have had a BER assessment. Similarly, 8% of dwellings would have received a rating of "G" compared with 7% of dwellings in the actual BER data. In contrast, 7% of dwellings would have received an "A" rating at the national level, whereas 10% of dwellings that have had a BER assessment were given an "A" rating.
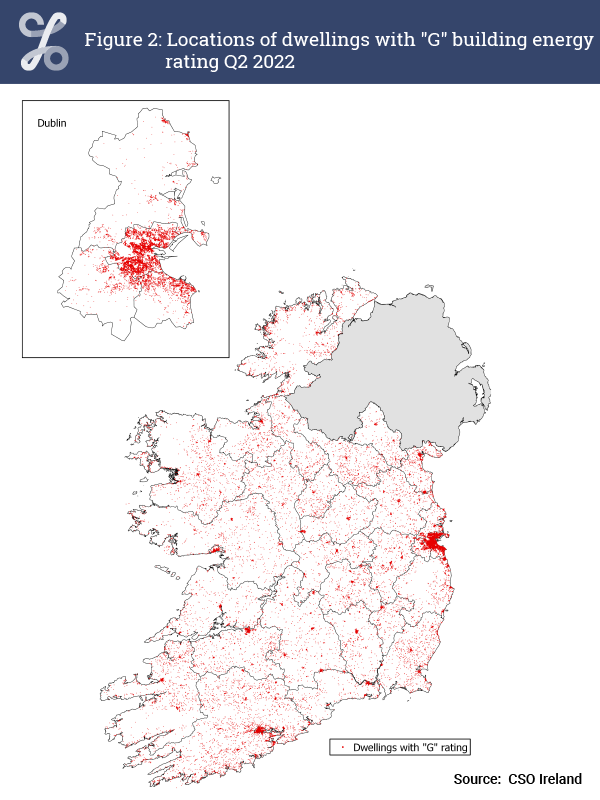
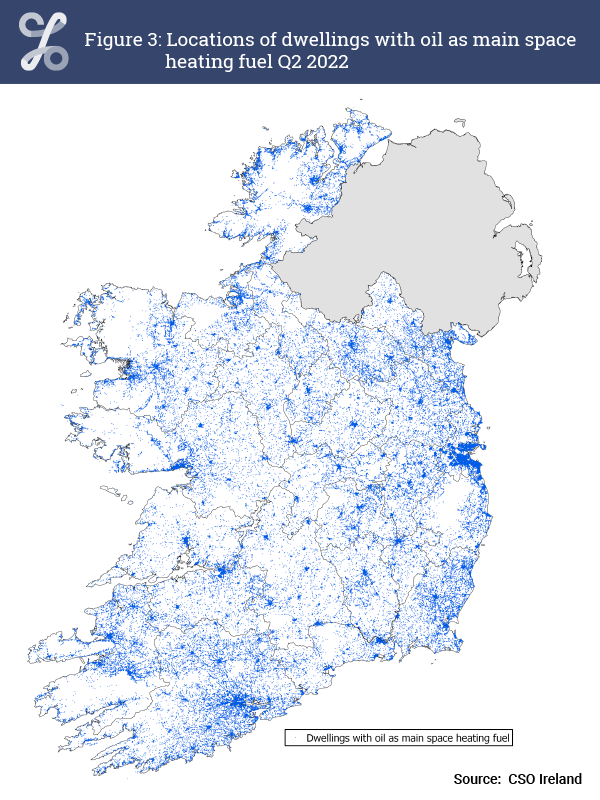
Figure 2 shows the geographical location of dwellings with a "G" energy rating. Inner city areas have a higher proportion of "G" ratings than newer suburban areas. In contrast, Figure 3 shows that rural areas have a much higher percentage of dwellings using oil central heating."