
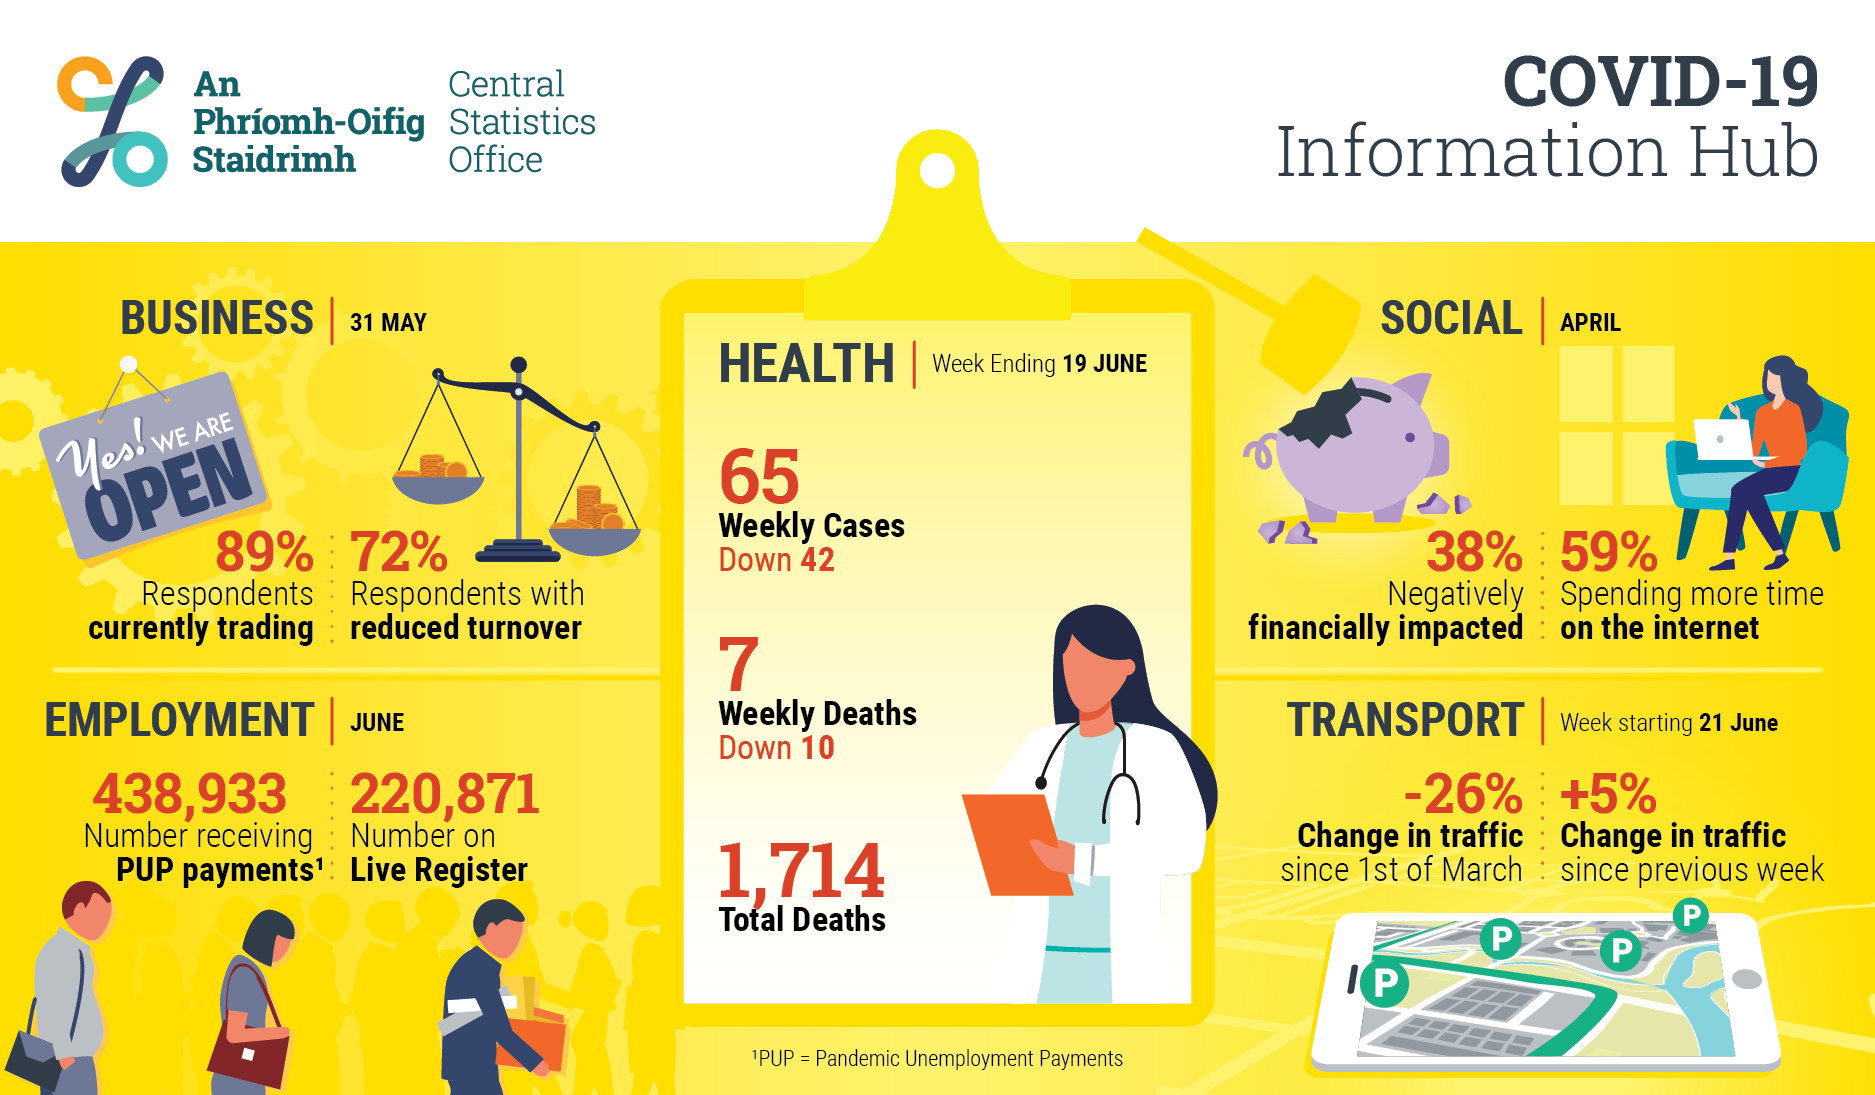
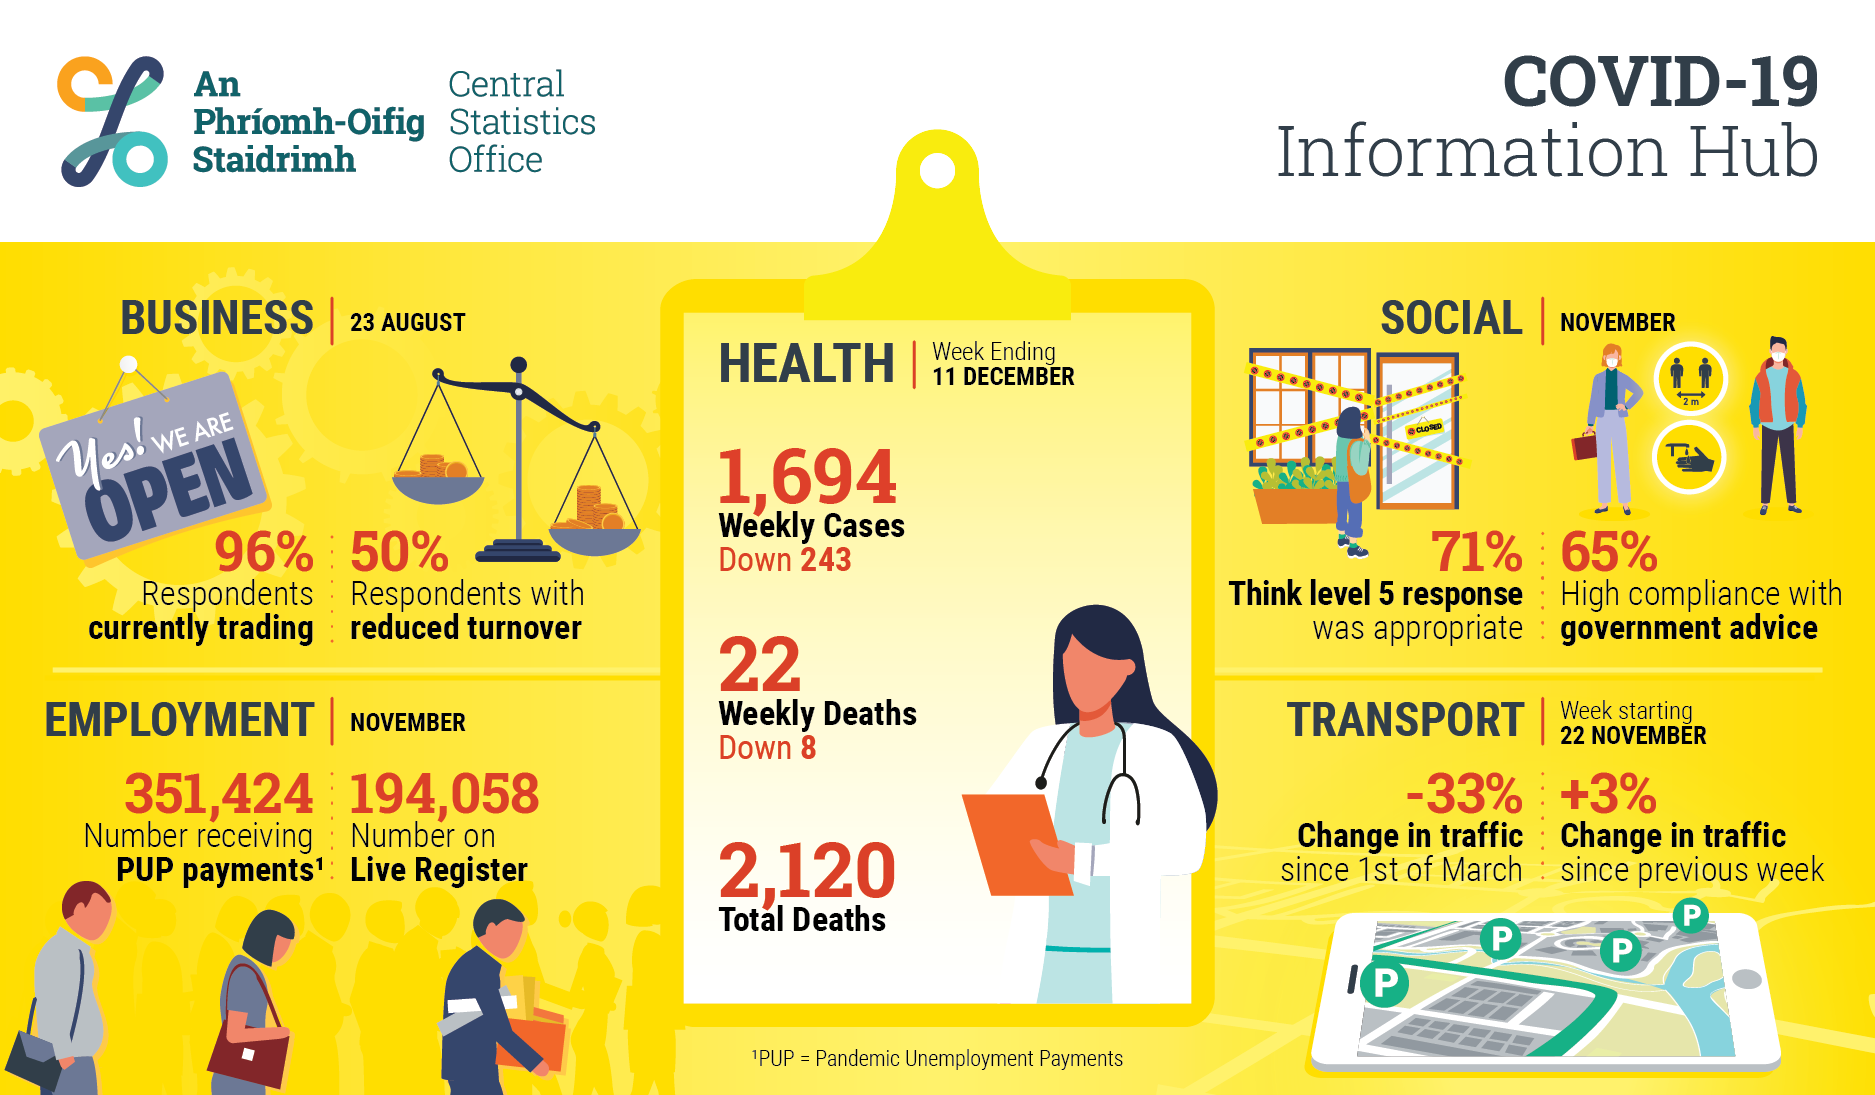
The CSO developed a set of infographics with key indicators capturing the evolving impact of the COVID-19 pandemic. These infographics were updated regularly on the CSO COVID-19 Information Hub.
This series of infographics, presented here as a collection for the first time, shows the changing situation in business, health, social, employment and transport indicators over time, from May 2020 to May 2021.


Learn about our data and confidentiality safeguards, and the steps we take to produce statistics that can be trusted by all.