
CSO publication, , 11am
The CPI and HICP and associated subindices are first issued in a publication called Consumer Price Index at 11am four weeks and two days following the second Tuesday of the reference month with the exception of the December and January data. There are a number of detailed indices included in the publishing of this release. These indices include more detail about the factors contributing to changes in the percentage change over one month and twelve months for the headline indices. The data is published in electronic format on the CSO’s website.
Once the CPI indices are published, they are never revised. The HICP, on the other hand, is a revisable index although there have been no revisions to date.
The movement of the CPI, HICP and their subindices are expressed as percentage changes, rather than changes in index points, because index point changes are affected by the level of the index in relation to its base period, whereas percentage changes are not. The example below illustrates the computation of index point and percentage changes.
The Consumer Price Index (All Items base Dec 2016=100) for May 2023 is 119.0 and that for April 2023 is 118.6. Therefore the index point change between these two months is
119.0 – 118.6 = +0.5 index point change
To calculate the percentage change between these two months, one divides the index point change calculated above by the September 2016 index and multiply by 100, i.e.
(+0.4 / 118.6) × 100 = +0.5% percentage change
Percentage changes are calculated from the published, rounded indices, and are themselves then rounded to one decimal place.
The annual average index is defined as the arithmetic mean of the twelve monthly indices for the year in question (again using published, rounded indices):
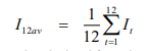
The annual average percentage change is calculated from the annual average indices, again using rounded data. It is not calculated as the average of the annual percentage changes for the twelve months.
National Average Prices (NAPs) are calculated for 68 items (mostly food items) and published each month. The items are those which are likely to be reasonably homogenous across all retail outlets and over time, so that an average price is reasonably meaningful.
CPI and HICP monthly indices are calculated using maximum precision, and then rounded to one decimal place for publication. All derived statistics – i.e. annual average indices, one-, three- and twelve-month percentage changes - are published rounded to one decimal place. Very occasionally, because of the degree of precision to which decimal fractions are stored electronically, a derived statistic ending with the digit 5 may be rounded downwards.
The CPI approach is transparent in that all derived statistics can be traced back to the published monthly index levels. This is particularly important given the wide range of uses to which the CPI is put. However, when publishing rounded indices to one decimal place, and then calculating percentage changes from these rounded indices, which are then themselves rounded to one decimal place, some rounding effects can occur.
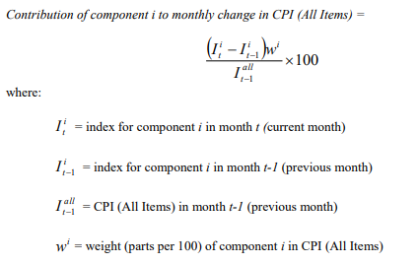
It is often of interest to estimate the effect of a division or group on the change in the CPI (All Items). The contribution of a component to a change in the CPI (All Items) over a given period of time is defined as the change that would have occurred in the CPI (All Items) if that component had undergone its observed change, but all other component indices had remained frozen at their values at the start of the period (and all weights are kept the same). The effect of each component depends on both the size of its change and its weight.
The formula for calculating the contribution of a component to the monthly change in the CPI (All Items) is given below:
Contributions can be calculated over any period of time. However, the process is complicated when multiple base periods are involved, as the weights will have changed.
The coverage and classification of the CPI is based on the international classification system for household consumption expenditures known as the ECOICOP (European Classification of Individual Consumption by Purpose). This is a hierarchical classification system comprising: Divisions (2-digit) e.g. 01 Food & non-alcoholic beverages, Groups (3-digit) e.g. 01.1 Food, Classes (4-digit) e.g. 01.1.1 Bread and cereals, and Sub-Classes (5-digit) e.g. 01.1.1.2 Flour. The ECOICOP classification system along with the corresponding weights is shown in Appendix 3.
Founded on National Accounts principles, the ECOICOP classification system also defines which transactions constitute household final consumption as opposed to other flows such as taxes, other transfers, or capital and financial transactions. This is the starting point for defining which expenditures, in principle, should be included in the CPI. The broad ECOICOP divisions are listed below:
ECOICOP divisions
Special aggregates are also published including Energy products, Alcohol (alcohol consumed on licensed premises and off-licence sales), Tobacco, CPI excluding Tobacco, CPI excluding Housing, CPI excluding Mortgage Interest and CPI excluding Energy products etc.
With each updating, the CPI starts with a new base reference period. For example, the previous series has a reference period of December 2016=100 and covered the period December 2016 to December 2023. The current series has a reference period of December 2023=100 and will cover the period from December 2023 to December 2026 (the date of the next planned updating). It is possible to link these two separate series together at their common month (i.e. December 2023) in order to create a continuous series that will cover the period December 2016 to December 2026.
The two series are linked by multiplying each of the December 2016=100 based index numbers by the December 2011 index number with a base of December 2006=100 and dividing the result by 100. The resulting continuous series has a base of December 2006=100 and covers the period December 2006 to July 2012.
As of the December 2006 rebase, linking is undertaken using data to full decimal places. Therefore, rounding differences may be found, for example, the July 2012 index was 105.6 when linked using full decimal places and this figure (105.6) was the published figure.