
CSO publication, , 11am
The CPI is produced in stages, with indices obtained at each stage weighted together to give higher level indices. Figure 6.1 shows how the data are combined together specifically within COICOP 01, Food & Non-Alcoholic Beverages. A similar structure is applied for all other COICOP divisions. At the lowest level there are 612 item headings. These can be combined from 2017 into ECOICOP 5 groups (e.g. Bread) which are in turn combined into COICOP 4-, 3- and 2-digit groups. Finally, the All Items CPI is the combination of all 612 item headings.
While the same hierarchical structure applies for all item headings, there are some differences in the calculation methodologies used at the lowest level. Specifically, different methodologies are used for the 477 directly priced item headings than the 135 special inquiries item headings (see Appendix 4 for list of the special inquiry item headings).
The first step of the calculation process for the 477 directly priced item headings is the calculation of source average prices. For CPI purposes, the 3 different sources are weighted to produce an overall item price. These sources are:
The prices for each item heading are divided into the different sources from which they are collected, and an average source price is calculated using the geometric mean. For example, the average price for 1 litre of low-fat milk is based on elementary indices for each of the sources of scanner data as well as one for local pricing. The average source price is technically known as an elementary aggregate as it is the lowest level of calculation within the CPI. Each month, a source average price is calculated both for the current month and the previous month based only on match price observations between the two periods. The technical form of this calculation is explained below:
Geometric Mean:
If prices Pi,c-1 to Pn,c-1 are obtained in the previous month c-1 and matching prices Pi,c to Pn,c are obtained for the same commodities in the current month c, then we have:
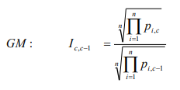
The Geometric Mean (GM) is therefore computed for an elementary aggregate by:
1. Multiplying all the prices quotations collected for a particular index variety (e.g. 1 litre of low fat milk) together, and then
2. find the n-th root of the product where n is the number of price quotations.
It is essential that matching prices are used. If, in any month, there is no price corresponding to one in the previous month, then that previous month’s price must be excluded from the calculations.
The next step is the calculation of a national average price (NAP) for each of the 477 item headings. This is the weighted average of the source average prices with a different weight applied to each source. Each month, a selection of these NAPS (68 in total) is published (see Appendix 5 for list of item headings for which NAPS are published). Again, each month, a NAP for both the current and previous month is calculated based on matched price observations only.
Item relatives are calculated for the directly priced and special inquiry item headings.
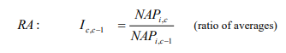
For the 477 directly priced item headings, the item relative is calculated and the current month’s NAP is the previous months NAP multiplied by this item relative. The formula is calculated below:
Item relatives are also calculated for the 135 special inquiry item headings. In this case, prices are centrally collected. Item relatives are calculated using either geometric or arithmetic mean formulae as appropriate. At this point in the calculation process, a full set of 612 item heading price relatives are available. These form the basis for the index calculations as described below.
The CPI expresses the current cost of a fixed market basket of consumer goods and services as a percentage of the cost of the same identical basket at the base period mid-December 2023. Since November 1996, the basket has undergone a complete revision every five years. This was delayed in 2021 due to the COVID-19 pandemic and was postponed until December 2023. Since the December 2011 rebase, in addition to a five yearly update of the basket, the weights are also updated annually (see Chapter 5).
The CPI is a fixed quantity price index: it measures the change in the price of a basket of fixed composition, quantity and as far as is possible quality. This is often summarised by saying that the CPI uses a fixed basket. The index t,0 I at time t based on time 0 is a Laspeyres-type or fixed base weight index, being the price of the basket at a given time as a percentage of its price in the base reference period:
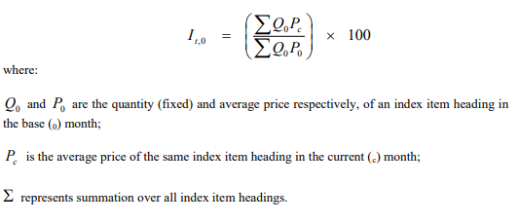
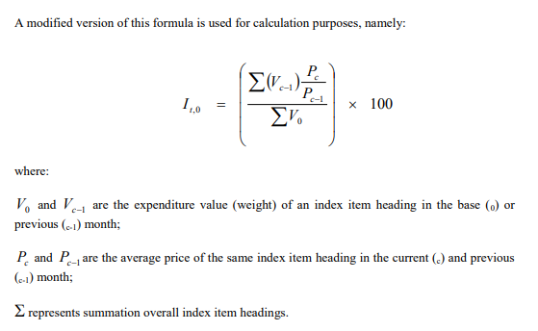
i.e. the current cost of the fixed quantity of each index item heading (elementary aggregate) is calculated by updating the previous month’s cost by the estimated monthly change in its average price. This index is also known as a weighted average of price relatives, the weight being the expenditure of an index item heading in the base period. Using the above formula, it is possible to calculate an index for any item heading or combination of item headings, all the way up to and including the All Items CPI.