
Your feedback can help us improve and enhance our services to the public. Tell us what matters to you in our online Customer Satisfaction Survey.
| Annual Services Inquiry (ASI) - Services and Distribution enterprises, 2008-2014 | |||||||||
| % change | |||||||||
| 2008 | 2009 | 2010 | 2011 | 2012 | 2013 | 2014 | 2008 - 2014 | 2013 - 2014 | |
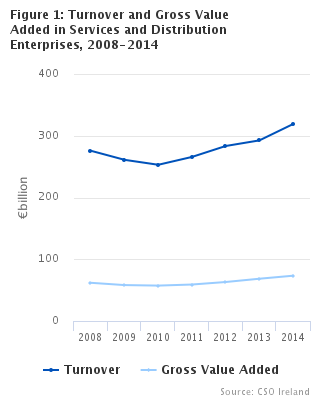
| Gross Value Added (€ million) | 61,863 | 58,161 | 57,332 | 59,091 | 63,149 | 68,467 | 73,354 | 18.6 | 7.1 |
| Turnover (€ million) | 275,729 | 261,017 | 252,955 | 265,743 | 283,396 | 292,540 | 318,981 | 15.7 | 9.0 |
| Enterprises (number) | 175,188 | 179,965 | 182,787 | 183,863 | 188,364 | 188,475 | 185,531 | 5.9 | -1.6 |
| Persons engaged (number) | 1,041,980 | 960,348 | 926,542 | 925,658 | 939,243 | 961,338 | 989,230 | -5.1 | 2.9 |
This release provides data on the Services and Distribution sector in Ireland for the period 2008 - 2014. Revised figures for 2008 - 2012 are included, along with newly published figures for 2013 and 2014. The detailed tables present a breakdown of the numbers of active Services and Distribution enterprises, numbers of persons engaged in Services and Distribution sectors, as well as a range of financial information classified by: economic activity, employment size and nationality.
The Services and Distribution series 2008 - 2012 has been revised due to a number of factors:
(i)There are now more active enterprises on the CSO Business Register. There are now more enterprises considered active in the Services and Distribution sector per the CSO Business Register. These enterprises need to be measured. What is considered an active enterprise per the register of active enterprises in Ireland will determine its inclusion in the Services and Distribution series. Size class thresholds will no longer be applied. For example, the Services and Distribution series previously didn't estimate for enterprises with zero persons engaged.
(ii) Updates in the National Accounts series. Under rules for the compilation of EU National Accounts (ESA 2010) a number of data series have been updated. For the Services and Distribution series, this principally concerns estimates for Research & Development (R&D). Estimates of R&D spend are now higher, and more of this R&D spend is being capitalised. This has the effect of increasing the estimate of Services and Distribution Gross Value Added. Updated estimates for the aircraft leasing sector are also included.
(iii) Non-response treatment & the greater use of administrative data. As part of the methodological review we have examined our methodology for non-respondents. We have aligned our non-response methodology more closely to the use of available administrative (tax) data and changed how we estimate for non-response. These new estimates for non-response are now incorporated into the Services and Distribution series, replacing the previous grossing/imputation methodology.
(iv) Other adjustments. During the review, the opportunity was taken to update the series for some sectoral NACE adjustments (enterprises being reclassified from one particular NACE sector to another), and updates to some Multinational Enterprise data measured by our National Accounts Large Cases Unit are also incorporated.