
Your feedback can help us improve and enhance our services to the public. Tell us what matters to you in our online Customer Satisfaction Survey.
| General Government Revenue and Expenditure | |||||||
| End of | Deficit/Surplus | Revenue | Expenditure | ||||
| year | €bn | % GDP | % GNI* | €bn | % GDP | €bn | % GDP |
| 2015 | -5.4 | -2.0 | -3.3 | 71.0 | 27.0 | 76.4 | 29.1 |
| 2016 | -2.1 | -0.8 | -1.2 | 73.7 | 27.3 | 75.8 | 28.1 |
| 2017 | -1.3 | -0.4 | -0.7 | 76.9 | 25.9 | 78.2 | 26.3 |
| 2018 | 0.1 | 0.0 | 0.0 | 83.1 | 25.5 | 83.0 | 25.5 |
| 2019 | 1.1 | 0.3 | 0.5 | 88.1 | 24.7 | 87.1 | 24.4 |
| 2020 | -18.8 | -5.0 | -9.0 | 84.5 | 22.7 | 103.3 | 27.7 |
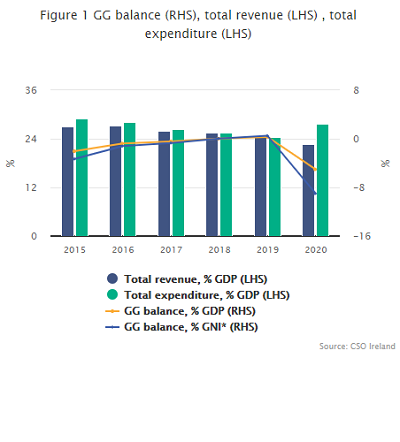
The general government deficit was €18.8bn in 2020, because of the impact of COVID-19 on both general government revenue and expenditure. Targeted government supports and public health measures resulted in a significant increase in expenditure and, at the same time, revenue fell. General government revenue was €84.5bn in 2020 while expenditure was €103.3bn, giving a deficit of €18.8bn (5% of GDP) compared with a surplus of €1.1bn in 2019 – see release Infographic.
The COVID-19 pandemic led to a drop of 4.1% in government revenues and a rise of 18.6% in government expenditure (Table 1).
Government revenues were €3.6bn (4.1%) lower than in 2019. Overall tax revenues were down €2.4bn (a 3.7% drop on 2019), with a fall of 12.0% in indirect taxes, mainly due to reduced VAT receipts and the waiving of commercial rates. In contrast direct taxes (including corporation tax and income taxes) increased 2.6% (Table 3).
The significant increase of €16.2bn (18.6%) in government expenditure in 2020 is due to COVID-19 measures. There was a rise of €11.8bn in subsidies (including the Temporary/Employment Wage Subsidy Scheme) and social transfers (including the Pandemic Unemployment Payment (PUP)). Intermediate consumption rose by €2.3bn, mostly due to extra spending by the health sector, while current transfers increased by €0.6bn (Table 4).
Provisional estimates of COVID-19 expenditure
The table below is a preliminary estimate of the impact of COVID-19 on government expenditure. It is easy to see the impact of new measures, such as the PUP, while in other areas existing budgets were used (and supplemented) in order to deliver services. This table will be updated as more data becomes available from end-year accounts.
Table A: COVID-19 measures included in general government expenditure, €bn
| ESA 2010 Code | Measure | 2020 |
|---|---|---|
| D.39 | Temporary/Employment Wage Subsidy Scheme | 4.1 |
| D.31 | Other | 0.1 |
| D.62 | Pandemic Unemployment Payment | 5.0 |
| D.62 | Covid Illness and Jobseekers Benefit | 0.1 |
| D.62 | Pension and Disability Allowance | 0.2 |
| D.632 | Primary care and Overseas repatriation | 0.1 |
| D.7 | Restart Grant / Restart Grant Plus | 0.6 |
| D.7 | Covid Restrictions Support Scheme | 0.2 |
| D.7 | Other enterprise supports | 0.1 |
| D.99 | Standardised guarantees | 0.1 |
| P.2 | Health sector expenditure | 2.0 |
| P.2 | Other | 0.5 |
| P.51g | ICT expenditure | 0.8 |
| Total Expenditure | 13.9 |
See Background notes for further information.
|
National accounts are compiled in the EU according to the European System of National Accounts 2010 (ESA 2010) framework. The Government Income and Expenditure (GIE) 2020 release is fully aligned with the National Income and Expenditure (NIE) 2020 publication of 15 July 2021. A full time series of general government data back to 2000 are available on CSO PxStat. Debt figures will be updated following the publication of the Government Finance Statistics (GFS) 2021 Q1 on 21 July 2021. The changes to the previously published tables under the Excessive Debt Procedure in April 2021 reflect updated data sources which become available between the April and July publications as well as a change to methodology for the treatment of local authority housing rent - see Background notes. A full description of the concepts and definitions used in the production of these statistics is provided in the Background notes.
|