
This release has been compiled during the COVID-19 crisis. The results contained in this release reflect some of the economic impacts of the COVID-19 situation. For further information see Background notes.
| General Government Revenue and Expenditure | |||||||
| End of | Deficit/Surplus | Revenue | Expenditure | ||||
| year | €bn | % GDP | % GNI* | €bn | % GDP | €bn | % GDP |
| 2015 | -5.4 | -2.0 | -3.3 | 71.0 | 27.0 | 76.4 | 29.1 |
| 2016 | -2.1 | -0.8 | -1.2 | 73.7 | 27.3 | 75.8 | 28.1 |
| 2017 | -1.3 | -0.4 | -0.7 | 76.9 | 25.9 | 78.2 | 26.3 |
| 2018 | 0.1 | 0.0 | 0.0 | 83.1 | 25.5 | 83.0 | 25.5 |
| 2019 | 1.1 | 0.3 | 0.5 | 88.1 | 24.7 | 87.1 | 24.4 |
| 2020 | -18.8 | -5.0 | -9.0 | 84.5 | 22.7 | 103.3 | 27.7 |
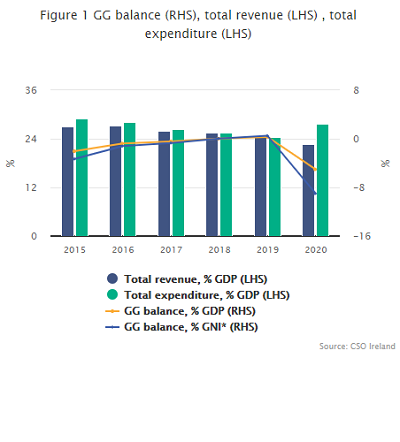
The general government deficit was €18.8bn in 2020, because of the impact of COVID-19 on both general government revenue and expenditure. Targeted government supports and public health measures resulted in a significant increase in expenditure and, at the same time, revenue fell. General government revenue was €84.5bn in 2020 while expenditure was €103.3bn, giving a deficit of €18.8bn (5% of GDP) compared with a surplus of €1.1bn in 2019 – see release Infographic.
The COVID-19 pandemic led to a drop of 4.1% in government revenues and a rise of 18.6% in government expenditure (Table 1).
Government revenues were €3.6bn (4.1%) lower than in 2019. Overall tax revenues were down €2.4bn (a 3.7% drop on 2019), with a fall of 12.0% in indirect taxes, mainly due to reduced VAT receipts and the waiving of commercial rates. In contrast direct taxes (including corporation tax and income taxes) increased 2.6% (Table 3).
The significant increase of €16.2bn (18.6%) in government expenditure in 2020 is due to COVID-19 measures. There was a rise of €11.8bn in subsidies (including the Temporary/Employment Wage Subsidy Scheme) and social transfers (including the Pandemic Unemployment Payment (PUP)). Intermediate consumption rose by €2.3bn, mostly due to extra spending by the health sector, while current transfers increased by €0.6bn (Table 4).
Provisional estimates of COVID-19 expenditure
The table below is a preliminary estimate of the impact of COVID-19 on government expenditure. It is easy to see the impact of new measures, such as the PUP, while in other areas existing budgets were used (and supplemented) in order to deliver services. This table will be updated as more data becomes available from end-year accounts.
Table A: COVID-19 measures included in general government expenditure, €bn
| ESA 2010 Code | Measure | 2020 |
|---|---|---|
| D.39 | Temporary/Employment Wage Subsidy Scheme | 4.1 |
| D.31 | Other | 0.1 |
| D.62 | Pandemic Unemployment Payment | 5.0 |
| D.62 | Covid Illness and Jobseekers Benefit | 0.1 |
| D.62 | Pension and Disability Allowance | 0.2 |
| D.632 | Primary care and Overseas repatriation | 0.1 |
| D.7 | Restart Grant / Restart Grant Plus | 0.6 |
| D.7 | Covid Restrictions Support Scheme | 0.2 |
| D.7 | Other enterprise supports | 0.1 |
| D.99 | Standardised guarantees | 0.1 |
| P.2 | Health sector expenditure | 2.0 |
| P.2 | Other | 0.5 |
| P.51g | ICT expenditure | 0.8 |
| Total Expenditure | 13.9 |
See Background notes for further information.
|
National accounts are compiled in the EU according to the European System of National Accounts 2010 (ESA 2010) framework. The Government Income and Expenditure (GIE) 2020 release is fully aligned with the National Income and Expenditure (NIE) 2020 publication of 15 July 2021. A full time series of general government data back to 2000 are available on CSO PxStat. Debt figures will be updated following the publication of the Government Finance Statistics (GFS) 2021 Q1 on 21 July 2021. The changes to the previously published tables under the Excessive Debt Procedure in April 2021 reflect updated data sources which become available between the April and July publications as well as a change to methodology for the treatment of local authority housing rent - see Background notes. A full description of the concepts and definitions used in the production of these statistics is provided in the Background notes.
|
| Total Revenue | Total Expenditure | |
| 2015 | 27.0057077625571 | 29.0547945205479 |
| 2016 | 27.2933861269112 | 28.0698857023729 |
| 2017 | 25.9071981765104 | 26.3359256809459 |
| 2018 | 25.4825440095595 | 25.4638348094177 |
| 2019 | 24.7196349890597 | 24.4189559087226 |
| 2020 | 22.6696543151272 | 27.7009186884921 |
| Government Revenue | |
| Sales of goods and services | 4.18 |
| Investment income | 1.16 |
| Other | 1.225 |
| Taxes | 62.289 |
| Social contributions | 15.674 |
| Government Expenditure | |
| Intermediate consumption | 14.904 |
| Other | 16.723 |
| Interest | 3.839 |
| Depreciation | 5.046 |
| Social benefits | 38.132 |
| Compensation of employees | 24.644 |
| Table 1 General Government transactions: revenue, expenditure and deficit | ||||||||||
| €million | ||||||||||
| Description | ESA2010 code | 2015 | 2016 | 2017 | 2018 | 2019 | 2020 | |||
| General Government transactions | ||||||||||
| Revenue | TR | 70,971 | 73,708 | 76,925 | 83,084 | 88,132 | 84,528 | |||
| Taxes and social contributions | D2 + D5 + D91 + D61 | 62,884 | 65,751 | 69,405 | 75,174 | 80,511 | 77,963 | |||
| Taxes | D2 + D5 + D91 | 50,750 | 52,814 | 55,714 | 60,549 | 64,677 | 62,289 | |||
| Social contributions | D61 | 12,134 | 12,938 | 13,691 | 14,625 | 15,834 | 15,674 | |||
| Sales of goods and services | P1O | 4,606 | 4,617 | 4,637 | 4,928 | 4,910 | 4,180 | |||
| Investment income | D4 | 2,721 | 1,826 | 1,779 | 1,544 | 1,607 | 1,160 | |||
| Current transfer revenue (excluding taxes) | D7 | 451 | 512 | 660 | 865 | 644 | 688 | |||
| Capital transfer revenue (excluding taxes) | D9N | 310 | 1,001 | 444 | 573 | 461 | 537 | |||
| Expenditure | TE | 76,356 | 75,805 | 78,198 | 83,023 | 87,060 | 103,288 | |||
| Expense | Expense | 75,325 | 74,267 | 76,841 | 80,431 | 83,461 | 99,245 | |||
| Compensation of employees | D1 | 19,394 | 19,945 | 21,112 | 22,124 | 23,435 | 24,644 | |||
| Use of goods and services plus taxes payable | P2 + D5 + D29 | 9,560 | 10,083 | 10,448 | 11,216 | 12,634 | 14,904 | |||
| Depreciation (Consumption of fixed capital) | P51c | 3,618 | 3,863 | 4,104 | 4,374 | 4,737 | 5,046 | |||
| Interest (excluding FISIM) | D41 | 6,939 | 6,264 | 5,906 | 5,318 | 4,632 | 3,839 | |||
| Subsidies | D3 | 1,788 | 1,768 | 1,814 | 1,948 | 1,733 | 6,088 | |||
| Social benefits | D62 + D632 | 27,933 | 27,933 | 28,579 | 29,397 | 30,644 | 38,132 | |||
| Other current transfers | D7 | 2,596 | 2,966 | 3,173 | 3,797 | 3,752 | 4,366 | |||
| Capital transfers | D9 | 3,496 | 1,445 | 1,704 | 2,257 | 1,895 | 2,225 | |||
| Net operating balance | NOB | -4,353 | -559 | 85 | 2,653 | 4,670 | -14,717 | |||
| Net acquisition of non-financial assets | P5 + NP - P51c | 1,031 | 1,538 | 1,357 | 2,592 | 3,599 | 4,043 | |||
| General Government Surplus/Deficit | B9 | -5,384 | -2,097 | -1,273 | 61 | 1,072 | -18,760 | |||
| General Government Surplus/Deficit (% of GDP) | -2.0 | -0.8 | -0.4 | 0.0 | 0.3 | -5.0 | ||||
| General Government Surplus/Deficit (% of GNI*) | -3.3 | -1.2 | -0.7 | 0.0 | 0.5 | -9.0 | ||||
| GDP at current market prices | 262,800 | 270,058 | 296,925 | 326,043 | 356,526 | 372,869 | ||||
| GNI* | 162,605 | 174,776 | 185,125 | 197,820 | 215,555 | 208,178 | ||||
| Table 2 General Government: detailed classification of revenue and output | |||||||||||
| €million | |||||||||||
| Description | ESA2010 code | 2015 | 2016 | 2017 | 2018 | 2019 | 2020 | ||||
| Total Revenue | TR | 70,971 | 73,708 | 76,925 | 83,084 | 88,132 | 84,528 | ||||
| Taxes and social contributions | 62,884 | 65,751 | 69,405 | 75,174 | 80,511 | 77,963 | |||||
| Taxes | D2 + D5 + D91 | 50,750 | 52,814 | 55,714 | 60,549 | 64,677 | 62,289 | ||||
| Indirect taxes (taxes on production and imports) | D2 | 22,486 | 23,471 | 24,649 | 25,744 | 27,520 | 24,216 | ||||
| Taxes on products | D21 | 19,326 | 20,575 | 21,392 | 22,150 | 23,913 | 21,354 | ||||
| of which Value-Added Tax | D211 | 11,831 | 12,603 | 13,060 | 14,175 | 15,281 | 12,630 | ||||
| Other taxes on production | D29 | 3,160 | 2,896 | 3,257 | 3,593 | 3,607 | 2,862 | ||||
| Direct taxes | D5 | 27,863 | 28,932 | 30,616 | 34,287 | 36,626 | 37,567 | ||||
| Taxes on income, profits and capital gains | D51 | 26,599 | 27,893 | 29,601 | 33,291 | 35,646 | 36,602 | ||||
| Other current direct taxes | D59 | 1,263 | 1,039 | 1,016 | 996 | 980 | 966 | ||||
| Capital taxes | D91 | 401 | 411 | 448 | 518 | 531 | 505 | ||||
| Social contributions | D61 | 12,134 | 12,938 | 13,691 | 14,625 | 15,834 | 15,674 | ||||
| Actual social contributions | D611 + D613 | 9,992 | 10,480 | 11,086 | 12,085 | 13,140 | 12,822 | ||||
| PRSI receipts | D611 + D613(pt) | 8,527 | 9,248 | 9,834 | 10,649 | 11,702 | 11,334 | ||||
| Government employees' pension contributions | D613(pt) | 1,465 | 1,231 | 1,251 | 1,435 | 1,437 | 1,487 | ||||
| Employers' imputed social contributions | D612 | 2,142 | 2,458 | 2,605 | 2,541 | 2,694 | 2,853 | ||||
| Sales of goods and services | P1O | 4,606 | 4,617 | 4,637 | 4,928 | 4,910 | 4,180 | ||||
| Sales of market establishments (= market output) | P11 | 0 | 0 | 0 | 0 | 0 | 0 | ||||
| Imputed sales related to production of own-use capital assets (= output for own final use) | P12 | 21 | 21 | 22 | 22 | 23 | 23 | ||||
| Incidental sales and fees of non-market establishments | P131 | 4,586 | 4,597 | 4,616 | 4,906 | 4,887 | 4,157 | ||||
| Investment income | D4 | 2,721 | 1,826 | 1,779 | 1,544 | 1,607 | 1,160 | ||||
| Interest (excluding FISIM) | D41 | 682 | 251 | 142 | 179 | 139 | 84 | ||||
| Dividends | D42 | 1,932 | 1,468 | 1,532 | 1,252 | 1,396 | 1,006 | ||||
| Current transfer revenue | D39 + D7 | 451 | 512 | 660 | 865 | 644 | 688 | ||||
| Subsidies | D39 | 0 | 0 | 0 | 0 | 0 | 0 | ||||
| Other current transfers | D7 | 451 | 512 | 660 | 865 | 644 | 688 | ||||
| Non-life insurance claims | D72 | 8 | 17 | 17 | 17 | 17 | 17 | ||||
| Other Domestic - Current | D7N_S1 | 261 | 306 | 353 | 408 | 464 | 615 | ||||
| From Rest of World - Current | D7N_S2 | 182 | 189 | 290 | 439 | 163 | 56 | ||||
| Capital transfer revenue | D9N | 310 | 1,001 | 444 | 573 | 461 | 537 | ||||
| Output | P1 | 32,572 | 33,891 | 35,665 | 37,715 | 40,806 | 44,595 | ||||
| Market output (sales of market establishments) | P11 | 0 | 0 | 0 | 0 | 0 | 0 | ||||
| Output for own final use | P12 | 21 | 21 | 22 | 22 | 23 | 23 | ||||
| Non-market output | P13 | 32,552 | 33,870 | 35,643 | 37,693 | 40,783 | 44,572 | ||||
| = Non-market compensation of employees | D1_nonmarket | 19,374 | 19,924 | 21,090 | 22,103 | 23,412 | 24,622 | ||||
| = Total compensation of employees | D1 | 19,394 | 19,945 | 21,112 | 22,124 | 23,435 | 24,644 | ||||
| - Compensation of employees of market establishments | D1_market | ||||||||||
| - Compensation related to production of own-use capital assets | D1_own-use | -21 | -21 | -22 | -22 | -23 | -23 | ||||
| + Non-market intermediate consumption | P2_nonmarket | 9,560 | 10,083 | 10,448 | 11,216 | 12,634 | 14,904 | ||||
| = Total intermediate consumption | P2 | 9,560 | 10,083 | 10,448 | 11,216 | 12,634 | 14,904 | ||||
| - Intermediate consumption of market establishments | P2_market | 0 | 0 | 0 | 0 | 0 | 0 | ||||
| - Intermediate consumption related to production of own-use capital assets | P2_own-use | ||||||||||
| + Non-market consumption of fixed capital | P51c_nonmarket | 3,618 | 3,863 | 4,104 | 4,374 | 4,737 | 5,046 | ||||
| = Total consumption of fixed capital | P51c | 3,618 | 3,863 | 4,104 | 4,374 | 4,737 | 5,046 | ||||
| - Consumption of fixed capital by market establishments | P51c_market | 0 | 0 | 0 | 0 | 0 | 0 | ||||
| - Consumption of fixed capital related to production of own-use capital assets | P51c_own-use | ||||||||||
| + Other taxes on production, payable | D29_pay | 0 | 0 | 0 | 0 | 0 | 0 | ||||
| - Other subsidies on production, receivable | D39_rec | 0 | 0 | 0 | 0 | 0 | 0 | ||||
| Table 3 General Government: detailed classification of expenditure and consumption | |||||||||||
| €million | |||||||||||
| Description | ESA2010 code | 2015 | 2016 | 2017 | 2018 | 2019 | 2020 | ||||
| Total Expenditure | TE | 76,356 | 75,805 | 78,198 | 83,023 | 87,060 | 103,288 | ||||
| Expense | 75,325 | 74,267 | 76,841 | 80,431 | 83,461 | 99,245 | |||||
| Compensation of employees | D1 | 19,394 | 19,945 | 21,112 | 22,124 | 23,435 | 24,644 | ||||
| Of which: Related to production of own-use capital assets | 21 | 21 | 22 | 22 | 23 | 23 | |||||
| Use of goods and services plus taxes payable | P2 + D5 + D29 | 9,560 | 10,083 | 10,448 | 11,216 | 12,634 | 14,904 | ||||
| Use of goods and services [Intermediate consumption] | P2 | 9,560 | 10,083 | 10,448 | 11,216 | 12,634 | 14,904 | ||||
| Of which: Intermediate consumption of market establishments | 0 | 0 | 0 | 0 | 0 | 0 | |||||
| Taxes, payable | D5 | 0 | 0 | 0 | 0 | 0 | 0 | ||||
| Depreciation (Consumption of fixed capital) | P51c | 3,618 | 3,863 | 4,104 | 4,374 | 4,737 | 5,046 | ||||
| Of which: Depreciation by market establishments | 0 | 0 | 0 | 0 | 0 | 0 | |||||
| Interest (excluding FISIM) | D41 | 6,939 | 6,264 | 5,906 | 5,318 | 4,632 | 3,839 | ||||
| Other domestic interest payable | D41_S1 | 2,542 | 2,356 | 2,208 | 1,923 | 1,629 | 1,825 | ||||
| Interest payable to rest of world | D41_S2 | 4,397 | 3,908 | 3,698 | 3,395 | 3,003 | 2,015 | ||||
| Subsidies | D3 | 1,788 | 1,768 | 1,814 | 1,948 | 1,733 | 6,088 | ||||
| Product subsidies | D31 | 864 | 909 | 930 | 993 | 988 | 1,186 | ||||
| Other subsidies on production | D39 | 924 | 858 | 884 | 954 | 745 | 4,901 | ||||
| Social benefits | D62 + D632 | 27,933 | 27,933 | 28,579 | 29,397 | 30,644 | 38,132 | ||||
| Social benefits in cash | D62 | 23,095 | 22,829 | 23,032 | 23,371 | 24,177 | 31,393 | ||||
| Social benefits in kind (via market producers) | D632 | 4,838 | 5,105 | 5,548 | 6,026 | 6,467 | 6,739 | ||||
| Other current transfers | D7 | 2,596 | 2,966 | 3,173 | 3,797 | 3,752 | 4,366 | ||||
| Net non-life insurance premiums | D71 | 55 | 66 | 66 | 69 | 77 | 82 | ||||
| Current international cooperation | D74 | 473 | 451 | 509 | 541 | 531 | 510 | ||||
| Miscellaneous current transfers | D75 | 561 | 598 | 866 | 813 | 870 | 1,164 | ||||
| VAT and GNI based EU budget contribution | D76 | 1,507 | 1,851 | 1,731 | 2,374 | 2,273 | 2,610 | ||||
| VAT-based EU own resources | D761 | 215 | 219 | 262 | 245 | 278 | 275 | ||||
| GNI-based EU own resources | D762 | 1,292 | 1,632 | 1,470 | 2,129 | 1,996 | 2,335 | ||||
| Capital transfers | D9 | 3,496 | 1,445 | 1,704 | 2,257 | 1,895 | 2,225 | ||||
| Investment grants | D92 | 1,305 | 1,443 | 1,667 | 2,015 | 1,875 | 2,129 | ||||
| Other capital transfers | D99 | 2,191 | 2 | 37 | 242 | 21 | 96 | ||||
| Net acquisition of non-financial assets | P5 + NP - P51c | 1,031 | 1,538 | 1,357 | 2,592 | 3,599 | 4,043 | ||||
| = Gross investment in non-financial assets | P5 + NP | 4,649 | 5,401 | 5,461 | 6,966 | 8,336 | 9,089 | ||||
| Gross fixed capital formation | P51 | 4,589 | 5,341 | 5,506 | 6,906 | 8,416 | 9,029 | ||||
| Net acquisition of stocks | P52 | 60 | 60 | 60 | 60 | 60 | 60 | ||||
| Net acquisition of unproduced assets | NP | 0 | 0 | -105 | 0 | -140 | 0 | ||||
| - Consumption of fixed capital | P51c | -3,618 | -3,863 | -4,104 | -4,374 | -4,737 | -5,046 | ||||
| Net expenditure on current goods and services | P3 excl. D632 | 27,966 | 29,273 | 31,027 | 32,787 | 35,896 | 40,415 | ||||
| = Output | P1 | 32,572 | 33,891 | 35,665 | 37,715 | 40,806 | 44,595 | ||||
| - Sales of goods and services | P11+P12+P131 | -4,606 | -4,617 | -4,637 | -4,928 | -4,910 | -4,180 | ||||
| Market output (sales of market establishments) | P11 | 0 | 0 | 0 | 0 | 0 | 0 | ||||
| Output for own final use | P12 | -21 | -21 | -22 | -22 | -23 | -23 | ||||
| Incidental sales and fees of non-market establishments | P131 | -4,586 | -4,597 | -4,616 | -4,906 | -4,887 | -4,157 | ||||
| Final consumption expenditure | P3 | 32,803 | 34,378 | 36,575 | 38,813 | 42,363 | 47,154 | ||||
| = Net expenditure on current goods and services | P3 excl. D632 | 27,966 | 29,273 | 31,027 | 32,787 | 35,896 | 40,415 | ||||
| + Social transfers in kind via market producers | D632 | 4,838 | 5,105 | 5,548 | 6,026 | 6,467 | 6,739 | ||||
| made up of | |||||||||||
| Individual consumption (= social transfers in kind) | P31 (= D63) | 21,791 | 22,835 | 24,502 | 25,991 | 28,449 | 31,667 | ||||
| Social transfers in kind (via market producers) | D632 | 4,838 | 5,105 | 5,548 | 6,026 | 6,467 | 6,739 | ||||
| Social transfers in kind (provided directly by government) | D631 | 16,953 | 17,730 | 18,955 | 19,965 | 21,983 | 24,927 | ||||
| Collective consumption (= actual final consumption of government) | P32 | 11,013 | 11,543 | 12,072 | 12,822 | 13,914 | 15,487 | ||||
| Total social transfers | D62 + D63 | 44,886 | 45,663 | 47,534 | 49,362 | 52,627 | 63,060 | ||||
| Social benefits in cash | D62 | 23,095 | 22,829 | 23,032 | 23,371 | 24,177 | 31,393 | ||||
| Social transfers in kind (= individual consumption) | D63 | 21,791 | 22,835 | 24,502 | 25,991 | 28,449 | 31,667 | ||||
| Table 4 Central Government transactions: revenue, expenditure, financing and deficit | ||||||||||
| €million | ||||||||||
| Description | ESA2010 code | 2015 | 2016 | 2017 | 2018 | 2019 | 2020 | |||
| Central Government transactions | ||||||||||
| Revenue | TR | 68,194 | 70,764 | 73,849 | 79,786 | 84,839 | 82,040 | |||
| Taxes and social contributions | D2 + D5 + D91 + D61 | 61,161 | 64,055 | 67,674 | 73,355 | 78,709 | 76,872 | |||
| Taxes | D2 + D5 + D91 | 49,361 | 51,460 | 54,335 | 59,113 | 63,218 | 61,556 | |||
| Social contributions | D61 | 11,800 | 12,595 | 13,339 | 14,243 | 15,491 | 15,316 | |||
| Sales of goods and services | P1O | 3,836 | 3,756 | 3,746 | 3,950 | 3,838 | 3,147 | |||
| Investment income | D4 | 2,735 | 1,867 | 1,815 | 1,578 | 1,670 | 1,224 | |||
| Current transfer revenue (excluding taxes) | D7 | 393 | 446 | 586 | 781 | 560 | 624 | |||
| Capital transfer revenue (excluding taxes) | D9N | 69 | 640 | 28 | 122 | 62 | 173 | |||
| Expenditure | TE | 73,948 | 73,040 | 75,219 | 79,801 | 83,295 | 100,441 | |||
| Expense | Expense | 72,328 | 70,923 | 73,554 | 77,499 | 80,595 | 97,118 | |||
| Compensation of employees | D1 | 17,710 | 18,220 | 19,369 | 20,311 | 21,517 | 22,633 | |||
| Use of goods and services plus taxes payable | P2 + D5 + D29 | 7,775 | 8,186 | 8,661 | 9,379 | 10,644 | 12,595 | |||
| Depreciation (Consumption of fixed capital) | P51c | 1,800 | 1,959 | 2,128 | 2,335 | 2,599 | 2,874 | |||
| Interest (excluding FISIM) | D41 | 6,922 | 6,256 | 5,901 | 5,312 | 4,625 | 3,832 | |||
| Subsidies | D3 | 1,788 | 1,768 | 1,814 | 1,948 | 1,733 | 6,088 | |||
| Social benefits | D62 + D632 | 27,330 | 27,308 | 27,792 | 28,399 | 29,468 | 36,769 | |||
| Other current transfers | D7 | 4,220 | 4,752 | 5,103 | 6,051 | 6,267 | 8,406 | |||
| Capital transfers | D9 | 4,782 | 2,475 | 2,786 | 3,764 | 3,744 | 3,921 | |||
| Net operating balance | NOB | -4,134 | -159 | 295 | 2,287 | 4,244 | -15,077 | |||
| Net acquisition of non-financial assets | P5 + NP - P51c | 1,620 | 2,117 | 1,664 | 2,302 | 2,700 | 3,324 | |||
| Central Government Surplus/Deficit | B9 | -5,754 | -2,276 | -1,369 | -14 | 1,544 | -18,401 | |||
| Table 5 Central Government: detailed classification of revenue and output | |||||||||||
| €million | |||||||||||
| Description | ESA2010 code | 2015 | 2016 | 2017 | 2018 | 2019 | 2020 | ||||
| Total Revenue | TR | 68,194 | 70,764 | 73,849 | 79,786 | 84,839 | 82,040 | ||||
| Taxes and social contributions | 61,161 | 64,055 | 67,674 | 73,355 | 78,709 | 76,872 | |||||
| Taxes | D2 + D5 + D91 | 49,361 | 51,460 | 54,335 | 59,113 | 63,218 | 61,556 | ||||
| Indirect taxes (taxes on production and imports) | D2 | 21,098 | 22,117 | 23,270 | 24,307 | 26,061 | 23,484 | ||||
| Taxes on products | D21 | 19,326 | 20,575 | 21,392 | 22,150 | 23,913 | 21,354 | ||||
| of which Value-Added Tax | D211 | 11,831 | 12,603 | 13,060 | 14,175 | 15,281 | 12,630 | ||||
| Other taxes on production | D29 | 1,772 | 1,542 | 1,878 | 2,157 | 2,148 | 2,130 | ||||
| Direct taxes | D5 | 27,863 | 28,932 | 30,616 | 34,287 | 36,626 | 37,567 | ||||
| Taxes on income, profits and capital gains | D51 | 26,599 | 27,893 | 29,601 | 33,291 | 35,646 | 36,602 | ||||
| Other current direct taxes | D59 | 1,263 | 1,039 | 1,016 | 996 | 980 | 966 | ||||
| Capital taxes | D91 | 401 | 411 | 448 | 518 | 531 | 505 | ||||
| Social contributions | D61 | 11,800 | 12,595 | 13,339 | 14,243 | 15,491 | 15,316 | ||||
| Actual social contributions | D611 + D613 | 9,868 | 10,374 | 10,986 | 11,936 | 13,058 | 12,736 | ||||
| PRSI receipts | D611 + D613(pt) | 8,527 | 9,248 | 9,834 | 10,649 | 11,702 | 11,334 | ||||
| Government employees' pension contributions | D613(pt) | 1,340 | 1,126 | 1,152 | 1,287 | 1,355 | 1,401 | ||||
| Employers' imputed social contributions | D612 | 1,932 | 2,222 | 2,353 | 2,307 | 2,433 | 2,580 | ||||
| Sales of goods and services | P1O | 3,836 | 3,756 | 3,746 | 3,950 | 3,838 | 3,147 | ||||
| Sales of market establishments (= market output) | P11 | 0 | 0 | 0 | 0 | 0 | 0 | ||||
| Imputed sales related to production of own-use capital assets (= output for own final use) | P12 | 21 | 21 | 22 | 22 | 23 | 23 | ||||
| Incidental sales and fees of non-market establishments | P131 | 3,815 | 3,735 | 3,724 | 3,928 | 3,815 | 3,125 | ||||
| Investment income | D4 | 2,735 | 1,867 | 1,815 | 1,578 | 1,670 | 1,224 | ||||
| Interest (excluding FISIM) | D41 | 696 | 292 | 178 | 213 | 203 | 147 | ||||
| of which received from local government | D41_LG | 51 | 73 | 64 | 59 | 80 | 84 | ||||
| Dividends | D42 | 1,932 | 1,468 | 1,532 | 1,252 | 1,396 | 1,006 | ||||
| Current transfer revenue | D39 + D7 | 393 | 446 | 586 | 781 | 560 | 624 | ||||
| Subsidies | D39 | 0 | 0 | 0 | 0 | 0 | 0 | ||||
| Other current transfers | D7 | 393 | 446 | 586 | 781 | 560 | 624 | ||||
| Non-life insurance claims | D72 | 8 | 17 | 17 | 17 | 17 | 17 | ||||
| Grants from local government | D73 | 3 | 3 | 4 | 4 | 5 | 5 | ||||
| Other Domestic - Current | D7N_S1 | 201 | 237 | 275 | 321 | 375 | 547 | ||||
| From Rest of World - Current | D7N_S2 | 182 | 189 | 290 | 439 | 163 | 56 | ||||
| Capital transfer revenue | D9N | 69 | 640 | 28 | 122 | 62 | 173 | ||||
| Output | P1 | 27,285 | 28,365 | 30,158 | 32,025 | 34,760 | 38,102 | ||||
| Market output (sales of market establishments) | P11 | 0 | 0 | 0 | 0 | 0 | 0 | ||||
| Output for own final use | P12 | 21 | 21 | 22 | 22 | 23 | 23 | ||||
| Non-market output | P13 | 27,264 | 28,344 | 30,137 | 32,004 | 34,737 | 38,079 | ||||
| = Non-market compensation of employees | D1_nonmarket | 17,689 | 18,199 | 19,348 | 20,290 | 21,494 | 22,610 | ||||
| = Total compensation of employees | D1 | 17,710 | 18,220 | 19,369 | 20,311 | 21,517 | 22,633 | ||||
| - Compensation of employees of market establishments | D1_market | 0 | 0 | 0 | 0 | 0 | 0 | ||||
| - Compensation related to production of own-use capital assets | D1_own-use | -21 | -21 | -22 | -22 | -23 | -23 | ||||
| + Non-market intermediate consumption | P2_nonmarket | 7,775 | 8,186 | 8,661 | 9,379 | 10,644 | 12,595 | ||||
| = Total intermediate consumption | P2 | 7,775 | 8,186 | 8,661 | 9,379 | 10,644 | 12,595 | ||||
| - Intermediate consumption of market establishments | P2_market | 0 | 0 | 0 | 0 | 0 | 0 | ||||
| - Intermediate consumption related to production of own-use capital assets | P2_own-use | 0 | 0 | 0 | 0 | 0 | 0 | ||||
| + Non-market consumption of fixed capital | P51c_nonmarket | 1,800 | 1,959 | 2,128 | 2,335 | 2,599 | 2,874 | ||||
| = Total consumption of fixed capital | P51c | 1,800 | 1,959 | 2,128 | 2,335 | 2,599 | 2,874 | ||||
| - Consumption of fixed capital by market establishments | P51c_market | 0 | 0 | 0 | 0 | 0 | 0 | ||||
| - Consumption of fixed capital related to production of own-use capital assets | P51c_own-use | 0 | 0 | 0 | 0 | 0 | 0 | ||||
| + Other taxes on production, payable | D29_pay | 0 | 0 | 0 | 0 | 0 | 0 | ||||
| - Other subsidies on production, receivable | D39_rec | 0 | 0 | 0 | 0 | 0 | 0 | ||||
| Table 6 Central Government: detailed classification of expenditure and consumption | |||||||||||
| €million | |||||||||||
| Description | ESA2010 code | 2015 | 2016 | 2017 | 2018 | 2019 | 2020 | ||||
| Total Expenditure | TE | 73,948 | 73,040 | 75,219 | 79,801 | 83,295 | 100,441 | ||||
| Expense | 72,328 | 70,923 | 73,554 | 77,499 | 80,595 | 97,118 | |||||
| Compensation of employees | D1 | 17,710 | 18,220 | 19,369 | 20,311 | 21,517 | 22,633 | ||||
| Of which: Related to production of own-use capital assets | 21 | 21 | 22 | 22 | 23 | 23 | |||||
| Use of goods and services plus taxes payable | P2 + D5 + D29 | 7,775 | 8,186 | 8,661 | 9,379 | 10,644 | 12,595 | ||||
| Use of goods and services [Intermediate consumption] | P2 | 7,775 | 8,186 | 8,661 | 9,379 | 10,644 | 12,595 | ||||
| Of which: Intermediate consumption of market establishments | 0 | 0 | 0 | 0 | 0 | 0 | |||||
| Taxes, payable | D5 | 0 | 0 | 0 | 0 | 0 | 0 | ||||
| Depreciation (Consumption of fixed capital) | P51c | 1,800 | 1,959 | 2,128 | 2,335 | 2,599 | 2,874 | ||||
| Of which: Depreciation by market establishments | 0 | 0 | 0 | 0 | 0 | 0 | |||||
| Interest (excluding FISIM) | D41 | 6,922 | 6,256 | 5,901 | 5,312 | 4,625 | 3,832 | ||||
| Other domestic interest payable | D41_S1 | 2,525 | 2,347 | 2,203 | 1,918 | 1,622 | 1,817 | ||||
| Interest payable to rest of world | D41_S2 | 4,397 | 3,908 | 3,698 | 3,395 | 3,003 | 2,015 | ||||
| Subsidies | D3 | 1,788 | 1,768 | 1,814 | 1,948 | 1,733 | 6,088 | ||||
| Product subsidies | D31 | 864 | 909 | 930 | 993 | 988 | 1,186 | ||||
| Other subsidies on production | D39 | 924 | 858 | 884 | 954 | 745 | 4,901 | ||||
| Social benefits | D62 + D632 | 27,330 | 27,308 | 27,792 | 28,399 | 29,468 | 36,769 | ||||
| Social benefits in cash | D62 | 22,730 | 22,527 | 22,721 | 23,023 | 23,825 | 31,032 | ||||
| Social benefits in kind (via market producers) | D632 | 4,600 | 4,782 | 5,071 | 5,376 | 5,642 | 5,737 | ||||
| Other current transfers | D7 | 4,220 | 4,752 | 5,103 | 6,051 | 6,267 | 8,406 | ||||
| Net non-life insurance premiums | D71 | 55 | 66 | 66 | 69 | 77 | 82 | ||||
| Current grants to local government | D73 _LG | 1,657 | 1,817 | 1,968 | 2,314 | 2,538 | 4,150 | ||||
| Current international cooperation | D74 | 473 | 451 | 509 | 541 | 531 | 510 | ||||
| Miscellaneous current transfers | D75 | 529 | 567 | 829 | 753 | 848 | 1,055 | ||||
| VAT and GNI based EU budget contribution | D76 | 1,507 | 1,851 | 1,731 | 2,374 | 2,273 | 2,610 | ||||
| VAT-based EU own resources | D761 | 215 | 219 | 262 | 245 | 278 | 275 | ||||
| GNI-based EU own resources | D762 | 1,292 | 1,632 | 1,470 | 2,129 | 1,996 | 2,335 | ||||
| Capital transfers | D9 | 4,782 | 2,475 | 2,786 | 3,764 | 3,744 | 3,921 | ||||
| Capital grants to local government | D9_LG | 1,300 | 1,054 | 1,150 | 1,684 | 2,008 | 2,088 | ||||
| Investment grants | D92 | 1,292 | 1,420 | 1,599 | 1,838 | 1,715 | 1,737 | ||||
| Other capital transfers | D99 | 2,191 | 2 | 37 | 242 | 21 | 96 | ||||
| Net acquisition of non-financial assets | P5 + NP - P51c | 1,620 | 2,117 | 1,664 | 2,302 | 2,700 | 3,324 | ||||
| = Gross investment in non-financial assets | P5 + NP | 3,420 | 4,076 | 3,792 | 4,637 | 5,299 | 6,198 | ||||
| Gross fixed capital formation | P51 | 3,420 | 4,016 | 3,837 | 4,577 | 5,379 | 6,138 | ||||
| Net acquisition of stocks | P52 | 60 | 60 | 60 | 60 | 60 | 60 | ||||
| Net acquisition of unproduced assets | NP | -60 | 0 | -105 | 0 | -140 | 0 | ||||
| - Consumption of fixed capital | P51c | -1,800 | -1,959 | -2,128 | -2,335 | -2,599 | -2,874 | ||||
| Net expenditure on current goods and services | P3 excl. D632 | 23,449 | 24,609 | 26,412 | 28,076 | 30,922 | 34,954 | ||||
| = Output | P1 | 27,285 | 28,365 | 30,158 | 32,025 | 34,760 | 38,102 | ||||
| - Sales of goods and services | P11+P12+P131 | -3,836 | -3,756 | -3,746 | -3,950 | -3,838 | -3,147 | ||||
| Market output (sales of market establishments) | P11 | 0 | 0 | 0 | 0 | 0 | 0 | ||||
| Output for own final use | P12 | -21 | -21 | -22 | -22 | -23 | -23 | ||||
| Incidental sales and fees of non-market establishments | P131 | -3,815 | -3,735 | -3,724 | -3,928 | -3,815 | -3,125 | ||||
| Final consumption expenditure | P3 | 28,049 | 29,391 | 31,483 | 33,452 | 36,564 | 40,692 | ||||
| = Net expenditure on current goods and services | P3 excl. D632 | 23,449 | 24,609 | 26,412 | 28,076 | 30,922 | 34,954 | ||||
| + Social transfers in kind via market producers | D632 | 4,600 | 4,782 | 5,071 | 5,376 | 5,642 | 5,737 | ||||
| made up of | |||||||||||
| Individual consumption (= social transfers in kind) | P31 (= D63) | 20,313 | 21,263 | 22,755 | 24,124 | 26,452 | 29,110 | ||||
| Social transfers in kind (via market producers) | D632 | 4,600 | 4,782 | 5,071 | 5,376 | 5,642 | 5,737 | ||||
| Social transfers in kind (provided directly by government) | D631 | 15,712 | 16,482 | 17,683 | 18,749 | 20,810 | 23,372 | ||||
| Collective consumption (= actual final consumption of government) | P32 | 7,736 | 8,127 | 8,729 | 9,327 | 10,112 | 11,582 | ||||
| Total social transfers | D62 + D63 | 43,042 | 43,790 | 45,475 | 47,147 | 50,277 | 60,141 | ||||
| Social benefits in cash | D62 | 22,730 | 22,527 | 22,721 | 23,023 | 23,825 | 31,032 | ||||
| Social transfers in kind (= individual consumption) | D63 | 20,313 | 21,263 | 22,755 | 24,124 | 26,452 | 29,110 | ||||
| Table 7 Local Government transactions: revenue, expenditure, financing and deficit | ||||||||||
| €million | ||||||||||
| Description | ESA2010 code | 2015 | 2016 | 2017 | 2018 | 2019 | 2020 | |||
| Local Government transactions | ||||||||||
| Revenue | TR | 5,801 | 5,902 | 6,281 | 7,390 | 7,960 | 8,848 | |||
| Taxes and social contributions | D2 + D5 + D91 + D61 | 1,723 | 1,697 | 1,731 | 1,819 | 1,802 | 1,091 | |||
| Taxes | D2 + D5 + D91 | 1,389 | 1,354 | 1,379 | 1,437 | 1,459 | 733 | |||
| Social contributions | D61 | 334 | 343 | 352 | 383 | 343 | 358 | |||
| Sales of goods and services | P1O | 770 | 861 | 891 | 978 | 1,072 | 1,033 | |||
| Investment income | D4 | 37 | 32 | 29 | 25 | 16 | 20 | |||
| Current transfer revenue (excluding taxes) | D7 | 1,717 | 1,885 | 2,045 | 2,401 | 2,626 | 4,218 | |||
| Capital transfer revenue (excluding taxes) | D9N | 1,554 | 1,427 | 1,584 | 2,167 | 2,444 | 2,486 | |||
| Expenditure | TE | 5,431 | 5,723 | 6,184 | 7,314 | 8,432 | 9,207 | |||
| Expense | Expense | 6,020 | 6,301 | 6,491 | 7,024 | 7,533 | 8,488 | |||
| Compensation of employees | D1 | 1,684 | 1,725 | 1,743 | 1,813 | 1,918 | 2,012 | |||
| Use of goods and services plus taxes payable | P2 + D5 + D29 | 1,785 | 1,897 | 1,787 | 1,837 | 1,991 | 2,309 | |||
| Depreciation (Consumption of fixed capital) | P51c | 1,818 | 1,904 | 1,977 | 2,039 | 2,138 | 2,172 | |||
| Interest (excluding FISIM) | D41 | 68 | 82 | 70 | 64 | 86 | 91 | |||
| Subsidies | D3 | 0 | 0 | 0 | 0 | 0 | 0 | |||
| Social benefits | D62 + D632 | 603 | 625 | 787 | 998 | 1,176 | 1,363 | |||
| Other current transfers | D7 | 36 | 33 | 41 | 64 | 27 | 115 | |||
| Capital transfers | D9 | 26 | 36 | 87 | 208 | 197 | 426 | |||
| Net operating balance | NOB | -219 | -399 | -210 | 366 | 427 | 360 | |||
| Net acquisition of non-financial assets | P5 + NP - P51c | -589 | -579 | -307 | 290 | 899 | 719 | |||
| Local Government Surplus/Deficit | B9 | 370 | 180 | 97 | 76 | -472 | -359 | |||
| Table 8 Local Government: detailed classification of revenue and output | |||||||||||
| €million | |||||||||||
| Description | ESA2010 code | 2015 | 2016 | 2017 | 2018 | 2019 | 2020 | ||||
| Total Revenue | TR | 5,801 | 5,902 | 6,281 | 7,390 | 7,960 | 8,848 | ||||
| Taxes and social contributions | 1,723 | 1,697 | 1,731 | 1,819 | 1,802 | 1,091 | |||||
| Taxes | D2 + D5 + D91 | 1,389 | 1,354 | 1,379 | 1,437 | 1,459 | 733 | ||||
| Indirect taxes (taxes on production and imports) | D2 | 1,389 | 1,354 | 1,379 | 1,437 | 1,459 | 733 | ||||
| Other taxes on production | D29 | 1,389 | 1,354 | 1,379 | 1,437 | 1,459 | 733 | ||||
| Capital taxes | D91 | 0 | 0 | 0 | 0 | 0 | 0 | ||||
| Social contributions | D61 | 334 | 343 | 352 | 383 | 343 | 358 | ||||
| Actual social contributions | D611 + D613 | 125 | 106 | 99 | 149 | 82 | 86 | ||||
| Employers' imputed social contributions | D612 | 209 | 237 | 252 | 234 | 261 | 272 | ||||
| Sales of goods and services | P1O | 770 | 861 | 891 | 978 | 1,072 | 1,033 | ||||
| Sales of market establishments (= market output) | P11 | 0 | 0 | 0 | 0 | 0 | 0 | ||||
| Imputed sales related to production of own-use capital assets (= output for own final use) | P12 | 0 | 0 | 0 | 0 | 0 | 0 | ||||
| Incidental sales and fees of non-market establishments | P131 | 770 | 861 | 891 | 978 | 1,072 | 1,033 | ||||
| Investment income | D4 | 37 | 32 | 29 | 25 | 16 | 20 | ||||
| Interest (excluding FISIM) | D41 | 37 | 32 | 29 | 25 | 16 | 20 | ||||
| in which received from Central Government | D41_CG | 0 | 0 | 0 | 0 | 0 | 0 | ||||
| Dividends | D42 | 0 | 0 | 0 | 0 | 0 | 0 | ||||
| Current transfer revenue | D39 + D7 | 1,717 | 1,885 | 2,045 | 2,401 | 2,626 | 4,218 | ||||
| Subsidies | D39 | 0 | 0 | 0 | 0 | 0 | 0 | ||||
| Other current transfers | D7 | 1,717 | 1,885 | 2,045 | 2,401 | 2,626 | 4,218 | ||||
| Grants from central government | D73 | 1,657 | 1,817 | 1,968 | 2,314 | 2,538 | 4,150 | ||||
| Other Domestic - Current | D7N_S1 | 61 | 69 | 78 | 87 | 89 | 68 | ||||
| Capital transfer revenue | D9N | 1,554 | 1,427 | 1,584 | 2,167 | 2,444 | 2,486 | ||||
| Grants from central government | D9N_CG | 1,300 | 1,054 | 1,150 | 1,684 | 2,008 | 2,088 | ||||
| Other capital transfers receivable | D99 | 254 | 373 | 434 | 483 | 436 | 398 | ||||
| Output | P1 | 5,287 | 5,526 | 5,506 | 5,690 | 6,046 | 6,493 | ||||
| Market output (sales of market establishments) | P11 | 0 | 0 | 0 | 0 | 0 | 0 | ||||
| Output for own final use | P12 | 0 | 0 | 0 | 0 | 0 | 0 | ||||
| Non-market output | P13 | 5,287 | 5,526 | 5,506 | 5,690 | 6,046 | 6,493 | ||||
| = Non-market compensation of employees | D1_nonmarket | 1,684 | 1,725 | 1,743 | 1,813 | 1,918 | 2,012 | ||||
| = Total compensation of employees | D1 | 1,684 | 1,725 | 1,743 | 1,813 | 1,918 | 2,012 | ||||
| - Compensation of employees of market establishments | D1_market | 0 | 0 | 0 | 0 | 0 | 0 | ||||
| - Compensation related to production of own-use capital assets | D1_own-use | 0 | 0 | 0 | 0 | 0 | 0 | ||||
| + Non-market intermediate consumption | P2_nonmarket | 1,785 | 1,897 | 1,787 | 1,837 | 1,991 | 2,309 | ||||
| = Total intermediate consumption | P2 | 1,785 | 1,897 | 1,787 | 1,837 | 1,991 | 2,309 | ||||
| - Intermediate consumption of market establishments | P2_market | 0 | 0 | 0 | 0 | 0 | 0 | ||||
| - Intermediate consumption related to production of own-use capital assets | P2_own-use | 0 | 0 | 0 | 0 | 0 | 0 | ||||
| + Non-market consumption of fixed capital | P51c_nonmarket | 1,818 | 1,904 | 1,977 | 2,039 | 2,138 | 2,172 | ||||
| = Total consumption of fixed capital | P51c | 1,818 | 1,904 | 1,977 | 2,039 | 2,138 | 2,172 | ||||
| - Consumption of fixed capital by market establishments | P51c_market | 0 | 0 | 0 | 0 | 0 | 0 | ||||
| - Consumption of fixed capital related to production of own-use capital assets | P51c_own-use | 0 | 0 | 0 | 0 | 0 | 0 | ||||
| + Other taxes on production, payable | D29_pay | 0 | 0 | 0 | 0 | 0 | 0 | ||||
| - Other subsidies on production, receivable | D39_rec | 0 | 0 | 0 | 0 | 0 | 0 | ||||
| Table 9 Local Government: detailed classification of expenditure and consumption | |||||||||||
| €million | |||||||||||
| Description | ESA2010 code | 2015 | 2016 | 2017 | 2018 | 2019 | 2020 | ||||
| Total Expenditure | TE | 5,431 | 5,723 | 6,184 | 7,314 | 8,432 | 9,207 | ||||
| Expense | 6,020 | 6,301 | 6,491 | 7,024 | 7,533 | 8,488 | |||||
| Compensation of employees | D1 | 1,684 | 1,725 | 1,743 | 1,813 | 1,918 | 2,012 | ||||
| Of which: Related to production of own-use capital assets | 0 | 0 | 0 | 0 | 0 | 0 | |||||
| Use of goods and services plus taxes payable | P2 + D5 + D29 | 1,785 | 1,897 | 1,787 | 1,837 | 1,991 | 2,309 | ||||
| Use of goods and services [Intermediate consumption] | P2 | 1,785 | 1,897 | 1,787 | 1,837 | 1,991 | 2,309 | ||||
| Of which: Intermediate consumption of market establishments | 0 | 0 | 0 | 0 | 0 | 0 | |||||
| Taxes, payable | D5 + D29 | 0 | 0 | 0 | 0 | 0 | 0 | ||||
| Depreciation (Consumption of fixed capital) | P51c | 1,818 | 1,904 | 1,977 | 2,039 | 2,138 | 2,172 | ||||
| Of which: Depreciation by market establishments | 0 | 0 | 0 | 0 | 0 | 0 | |||||
| Interest (excluding FISIM) | D41 | 68 | 82 | 70 | 64 | 86 | 91 | ||||
| Interest payable to central government | D41_CG | 51 | 73 | 64 | 59 | 80 | 84 | ||||
| Other domestic interest payable | D41_S1 | 17 | 9 | 5 | 5 | 7 | 7 | ||||
| Subsidies | D3 | 0 | 0 | 0 | 0 | 0 | 0 | ||||
| Social benefits | D62 + D632 | 603 | 625 | 787 | 998 | 1,176 | 1,363 | ||||
| Social benefits in cash | D62 | 366 | 302 | 311 | 348 | 352 | 362 | ||||
| Social benefits in kind (via market producers) | D632 | 237 | 323 | 476 | 650 | 824 | 1,002 | ||||
| Other current transfers | D7 | 36 | 33 | 41 | 64 | 27 | 115 | ||||
| Grants to central government | D73_CG | 3 | 3 | 4 | 4 | 5 | 5 | ||||
| Miscellaneous current transfers | D75 | 33 | 30 | 37 | 60 | 22 | 110 | ||||
| Capital transfers | D9 | 26 | 36 | 87 | 208 | 197 | 426 | ||||
| Investment grants | D92 | 13 | 24 | 68 | 176 | 160 | 392 | ||||
| Net acquisition of non-financial assets | P5 + NP - P51c | -589 | -579 | -307 | 290 | 899 | 719 | ||||
| = Gross investment in non-financial assets | P5 + NP | 1,229 | 1,325 | 1,670 | 2,329 | 3,037 | 2,891 | ||||
| Gross fixed capital formation | P51 | 1,169 | 1,325 | 1,670 | 2,329 | 3,037 | 2,891 | ||||
| Net acquisition of stocks | P52 | 0 | 0 | 0 | 0 | 0 | 0 | ||||
| Net acquisition of unproduced assets | NP | 60 | 0 | 0 | 0 | 0 | 0 | ||||
| - Consumption of fixed capital | P51c | -1,818 | -1,904 | -1,977 | -2,039 | -2,138 | -2,172 | ||||
| Net expenditure on current goods and services | P3 excl. D632 | 4,517 | 4,664 | 4,615 | 4,711 | 4,974 | 5,460 | ||||
| = Output | P1 | 5,287 | 5,526 | 5,506 | 5,690 | 6,046 | 6,493 | ||||
| - Sales of goods and services | P11+P12+P131 | -770 | -861 | -891 | -978 | -1,072 | -1,033 | ||||
| Market output (sales of market establishments) | P11 | 0 | 0 | 0 | 0 | 0 | 0 | ||||
| Output for own final use | P12 | 0 | 0 | 0 | 0 | 0 | 0 | ||||
| Incidental sales and fees of non-market establishments | P131 | -770 | -861 | -891 | -978 | -1,072 | -1,033 | ||||
| Final consumption expenditure | P3 | 4,754 | 4,987 | 5,091 | 5,361 | 5,799 | 6,462 | ||||
| = Net expenditure on current goods and services | P3 excl. D632 | 4,517 | 4,664 | 4,615 | 4,711 | 4,974 | 5,460 | ||||
| + Social transfers in kind via market producers | D632 | 237 | 323 | 476 | 650 | 824 | 1,002 | ||||
| made up of | |||||||||||
| Individual consumption (= social transfers in kind) | P31 (= D63) | 1,478 | 1,571 | 1,748 | 1,867 | 1,998 | 2,557 | ||||
| Social transfers in kind (via market producers) | D632 | 237 | 323 | 476 | 650 | 824 | 1,002 | ||||
| Social transfers in kind (provided directly by government) | D631 | 1,241 | 1,249 | 1,271 | 1,216 | 1,173 | 1,555 | ||||
| Collective consumption (= actual final consumption of government) | P32 | 3,276 | 3,416 | 3,344 | 3,495 | 3,801 | 3,905 | ||||
| Total social transfers | D62 + D63 | 1,844 | 1,873 | 2,058 | 2,215 | 2,350 | 2,918 | ||||
| Social benefits in cash | D62 | 366 | 302 | 311 | 348 | 352 | 362 | ||||
| Social transfers in kind (= individual consumption) | D63 | 1,478 | 1,571 | 1,748 | 1,867 | 1,998 | 2,557 | ||||
This release comprises the latest official dissemination by CSO of annual Government Income and Expenditure (GIE) results for 2015 to 2020. The data in this release are consistent with the Government Finance Statistics (GFS) 2021 Q1 release (to be published on 21 July 2021) and the National Income and Expenditure 2020 publication of 15 July 2021.
The tables provide detailed revenue and expenditure data for general government and its two subsectors, central and local government. A full time series of general government data back to 2000 are available on CSO PxStat. The full suite of GFS publications are available on the CSO website.
Data back to 1995 for all EU Member States are available on Eurostat’s database.
Compensation of employees (D.1): Continuing with the previous developments of processes and data sources, further amendments have been made to the compilation of the components of D.1 for General Government (2011-2020).
These include:
Social contributions (D.61): The presentation of the components has been updated, with ‘Government employees' social contributions’ (D.613)(pt) re-labelled as ‘Government employee pension contributions’. This had previously included an element of PRSI contributions and has now been amended.
Depreciation (P.51c): Revisions have been made to the P.51c data due to the availability of additional data. These revisions are in line with the latest National Income and Expenditure Accounts published on 15 July 2021.
Reclassification of local authority housing rent as non market output
To date the provision of local authority housing was treated as a market output. This meant that the difference between the differential rent paid by the tenant and a market rent was calculated and included as P.11 (market output), with a corresponding imputed expenditure D.632 (social benefit in kind). However, Approved Housing Bodies (AHB) reclassified into the local government sector are considered as non-market producers, with no imputed rent calculation made.
On review, this approach was deemed not appropriate and thus a decision has been made to treat the local authority housing output as non-market. This ensures consistency with AHBs. This determination means that there is no longer an imputed D.632 expenditure related to local authority rent. Local authority rent payments are now recorded as P.131 (incidental sales and fees of non-market establishments). This methodology has been applied from 1995.
In addition to the direct expenditure measures included above earlier, other measures had an implicit impact on the GFS aggregates:
Super dividend: In Q2 2020 the exchequer received a super dividend of €1,228 million from the Central Bank of Ireland.
The Register of public sector bodies (2020) was published in April and forms the basis for the general government sector. This update saw the inclusion of NAMA, the Insurance Compensation Fund and further approved housing bodies. Details were included in the background notes accompanying the April 2021 GFS Publication.
The GDP and GNI* figures used in the current publication are consistent with those published in the latest National Income and Expenditure Accounts 2020 on 15 July 2021.
GFS form the basis for fiscal monitoring in Europe, in particular in relation to the Excessive Deficit Procedure (EDP).
European GFS, including EDP statistics, are produced according to the legally binding accounting rules of the European System of Accounts (ESA2010). The Manual on Government Debt and Deficit (MGDD) provides further guidance on the implementation of ESA 2010 in the context of GFS.
EU Member States are required to report government deficit/surplus and debt data biannually under the EDP - before 1 April and 1 October in year N, for years N-4 to N-1 calendar years, as well as a forecast for the current year. The data are reported in harmonised tables, which provide a consistent framework for the presentation of this data by Member States. The tables provide a structure for linking national budgetary aggregates with government deficit and debt.
In addition to the EDP transmission programme, detailed statistics on government revenue and expenditure are also provided to Eurostat under the ESA transmission programme.
These data are available on the Eurostat website.
The general government sector of the economy, is defined in ESA2010 paragraph 2.111: as “institutional units which are non-market producers whose output is intended for individual and collective consumption, and are financed by compulsory payments made by units belonging to other sectors, and institutional units principally engaged in the redistribution of national income and wealth”. General government comprises the sub-sectors central government (S.1311), state government (S.1312 – which does not apply in Ireland), local government (S.1313), and social security funds (S.1314 – which does not apply in Ireland). See the latest Register of public sector bodies (2020).
General government deficit/surplus (GG deficit/surplus) is the standard European measure of the fiscal balance, which is used to monitor compliance with the Stability and Growth Pact.
This measure is by definition equal to both Total revenue (TR) less Total expenditure (TE) (Table 1), and Net acquisition of financial assets less Net incurrence of liabilities. In order to respect this accounting identity, a technical adjustment is made to the level of transactions recorded in liability category F32 (long-term debt securities) to eliminate any statistical discrepancy between the two approaches to the calculation of GG deficit/surplus. This adjustment has no impact on Gross debt, Net debt or Net worth.
Detailed codes and technical definitions can be seen in the ESA 2010 manual.
A listing of some of the main items included in this release is shown below.
P.1 Total output of government is equal to market output, own account capital formation, and non-market output (i.e. the sum of D.1+P.2+P51c). The market output referred to in this publication is the imputed market value of social housing rented dwellings.
P.2 Intermediate consumption – value of goods and services used in the process of production, excluding fixed assets.
P.3 Final consumption expenditure of government is equal to the total of its output (P.1) plus the expenditure on products/services supplied to households via market producers minus the sales of goods and services (at both market and non-market prices). This is made up of individual non-market services plus collective non-market services (P.31 and P.32).
P.5 Gross capital formation.
P.51g Gross fixed capital formation - acquisitions, less disposals, of fixed assets during a given period plus certain additions to the value of non-produced assets realised by productive activity. Fixed assets are tangible or intangible assets produced as outputs from processes of production that are themselves used repeatedly, or continuously, in processes of production for more than one year.
P.51c Consumption of fixed capital - the amount of fixed assets used up, during the period under consideration, as a result of normal wear and tear and foreseeable obsolescence, including a provision for losses of fixed assets as a result of accidental damage which can be insured against.
P.52 Changes in inventories.
P.53 Acquisitions less disposals of valuables.
D.1 Compensation of employees (Pay) - the total remuneration of government employees.
D.21 Taxes on products are taxes that are payable per unit of a given good or service produced or transacted. Included in this is customs and excise taxes and VAT. To accrue this data the cash receipts are time adjusted. Customs and excise taxes are time adjusted by 1 month and VAT is time adjusted by 2 months. For example Q1 VAT is March, April, May cash receipts.
D.29 Other taxes on production (payable) all taxes that enterprises incur as a result of engaging in production, independently of the quantity or value of the goods and services produced or sold. These include taxes on use or ownership of land or buildings, taxes on use of fixed assets, taxes on total wage bill and payroll, taxes on international transactions related to production.
D.3 Subsidies (payable) - current unrequited payments which general government or the institutions of the European Union make to resident producers, with the objective of influencing their levels of production, their prices or the remuneration of the factors of production.
D.4 Property income accrues when the owners of financial assets and natural resources put them at the disposal of other units of the economy. The income payable for the use of financial assets is called investment income, while that payable for the use of a natural resource is called rent. Property income is the sum of investment income and rent.
D.41 Interest receivable by the owners of a financial asset for putting it at the disposal of another institutional unit. Applies to deposits (AF.2), debt securities (AF.3), loans (AF.4) and other accounts payable (AF.8).
D.42 Dividends receivable by the owners of share equities. Dividends exclude "super dividends" which arise where the dividend paid is large relative to the recent level of dividends and earnings. Super dividends are recorded as withdrawal of equity (F.5). This arises, for example, in the case of dividends paid by the Central Bank.
D.45 Rent of a natural resource – income receivable by the owner of a natural resource for putting the resource at the disposal of another party.
D.5 Current taxes on income, wealth, etc., (payable) - all compulsory, unrequited payments, in cash or in kind, levied periodically by general government and by the rest of the world on the income and wealth of units in the economy, and some periodic taxes which are assessed neither on income nor wealth.
D.6 Social contributions - transfers to households, in cash or in kind, intended to relieve them from the financial burden of a number of risks or needs.
D.7 Other current transfers – includes VAT and GNI based EU budget contributions, current transfers between subsectors of government, current international co-operation and current transfers to households and non-profit institutions.
D.9 Capital transfers - involve the acquisition or disposal of an asset, or assets, by at least one of the parties to the transaction. Includes capital taxes and investment grants.
 Hide Background Notes
Scan the QR code below to view this release online or go to
http://www.cso.ie/en/releasesandpublications/er/giea/governmentincomeandexpenditurejuly2021/
 Show Table 1 General Government Transactions: Revenue, Expenditure and Deficit
 Hide Table 1 General Government Transactions: Revenue, Expenditure and Deficit