
| Irish Residents' Trips Overseas | Trips to Ireland by Area of Residence | |||||||
| Trips to Ireland | Great Britain | Other Europe | North America | Other Areas | ||||
| Oct - Dec '11 | 1,311,000 | 1,369,700 | 655,200 | 464,700 | 176,200 | 73,600 | ||
| Oct - Dec '12 | 1,360,400 | 1,438,000 | 646,400 | 505,400 | 201,300 | 85,000 | ||
| Oct - Dec '13 | 1,329,300 | 1,580,100 | 727,100 | 527,600 | 223,500 | 102,000 | ||
| Jan - Dec '11 | 6,292,800 | 6,505,200 | 2,878,100 | 2,283,200 | 987,100 | 356,700 | ||
| Jan - Dec '12 | 6,325,800 | 6,517,200 | 2,774,200 | 2,347,400 | 1,016,900 | 378,600 | ||
| Jan - Dec '13 | 6,323,100 | 6,985,900 | 2,928,900 | 2,463,000 | 1,158,100 | 435,900 | ||
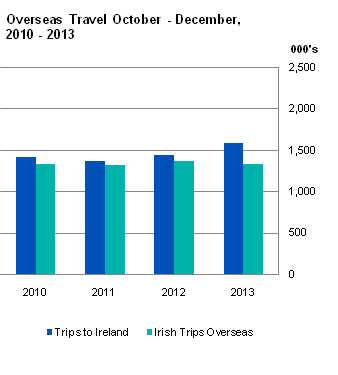
In the period October – December 2013, the total number of trips to Ireland increased by 9.9% to 1,580,100 - an overall increase of 142,100 compared to the same period twelve months earlier. See tables 1 and 2.
Trips by residents of Great Britain increased by 12.5% to 727,100 and trips by residents of North America to Ireland increased by 11.0% to 223,500. Trips by residents of European Countries other than Great Britain (Other Europe) increased by 4.4% to 527,600 while trips to Ireland from Other Areas increased by 20.0% to 102,000. The total number of overseas trips made by Irish residents during the period October - December 2013 decreased by 2.3% to 1,329,300. See tables 1 and 2.
The total number of trips (Irish residents’ trips overseas plus trips to Ireland) in the period October - December 2013 increased by 4.0% to 2,909,400 when compared with the same period twelve months earlier. For the period October - December 2012, there was an annual increase of 4.4% in the total number of trips taken when compared to the previous corresponding period. See tables 1 and 2.
In 2013, the total number of trips that were made to Ireland was 6,985,900, an increase of 7.2% over 2012. See tables 3 and 4.
| Table 1 Overseas Trips for the period October - December, 2010 - 2013 | ||||||||||||
| Trips to Ireland by Area of Residence | ||||||||||||
| Irish Residents' Trips Overseas | ||||||||||||
| Trips to Ireland | Great Britain | Other Europe | North America | Other Areas | ||||||||
| Year | Period | All Trips | ||||||||||
| 2010 | Oct - Dec | 2,736,800 | 1,322,500 | 1,414,300 | 657,600 | 477,300 | 201,400 | 78,100 | ||||
| 2011 | Oct - Dec | 2,680,700 | 1,311,000 | 1,369,700 | 655,200 | 464,700 | 176,200 | 73,600 | ||||
| 2012 | Oct - Dec | 2,798,400 | 1,360,400 | 1,438,000 | 646,400 | 505,400 | 201,300 | 85,000 | ||||
| 2013 | Oct - Dec | 2,909,400 | 1,329,300 | 1,580,100 | 727,100 | 527,600 | 223,500 | 102,000 | ||||
| Table 2 Annual Change in Overseas Trips for the period October - December, 2011 - 2013 | ||||||||||||
| Trips to Ireland by Area of Residence | ||||||||||||
| Irish Residents' Trips Overseas | ||||||||||||
| Trips to Ireland | Great Britain | Other Europe | North America | Other Areas | ||||||||
| Year | Period | All Trips | ||||||||||
| Change versus corresponding period of previous year (number) | ||||||||||||
| 2011 | Oct - Dec | -56,100 | -11,500 | -44,600 | -2,400 | -12,600 | -25,200 | -4,500 | ||||
| 2012 | Oct - Dec | 117,700 | 49,400 | 68,300 | -8,800 | 40,700 | 25,100 | 11,400 | ||||
| 2013 | Oct - Dec | 111,000 | -31,100 | 142,100 | 80,700 | 22,200 | 22,200 | 17,000 | ||||
| Change versus corresponding period of previous year (%) | ||||||||||||
| 2011 | Oct - Dec | -2.0 | -0.9 | -3.2 | -0.4 | -2.6 | -12.5 | -5.8 | ||||
| 2012 | Oct - Dec | 4.4 | 3.8 | 5.0 | -1.3 | 8.8 | 14.2 | 15.5 | ||||
| 2013 | Oct - Dec | 4.0 | -2.3 | 9.9 | 12.5 | 4.4 | 11.0 | 20.0 | ||||
| Table 3 Overseas Trips for the period January - December, 2010 - 2013 | ||||||||||
| Trips to Ireland by Area of Residence | ||||||||||
| Irish Residents' Trips Overseas | ||||||||||
| Trips to Ireland | Great Britain | Other Europe | North America | Other Areas | ||||||
| Year | All Trips | |||||||||
| 2010 | 12,609,100 | 6,572,000 | 6,037,100 | 2,738,500 | 2,045,200 | 935,600 | 317,800 | |||
| 2011 | 12,798,000 | 6,292,800 | 6,505,200 | 2,878,100 | 2,283,200 | 987,100 | 356,700 | |||
| 2012 | 12,842,900 | 6,325,800 | 6,517,200 | 2,774,200 | 2,347,400 | 1,016,900 | 378,600 | |||
| 2013 | 13,309,000 | 6,323,100 | 6,985,900 | 2,928,900 | 2,463,000 | 1,158,100 | 435,900 | |||
| Table 4 Annual Change in Overseas Trips for the period January - December, 2011 - 2013 | ||||||||||
| Trips to Ireland by Area of Residence | ||||||||||
| Irish Residents' Trips Overseas | ||||||||||
| Trips to Ireland | Great Britain | Other Europe | North America | Other Areas | ||||||
| Year | All Trips | |||||||||
| Annual change in year to December total (number) | ||||||||||
| 2011 | 188,900 | -279,200 | 468,100 | 139,600 | 238,000 | 51,500 | 38,900 | |||
| 2012 | 44,900 | 33,000 | 12,000 | -103,900 | 64,200 | 29,800 | 21,900 | |||
| 2013 | 466,100 | -2,700 | 468,700 | 154,700 | 115,600 | 141,200 | 57,300 | |||
| Annual change in year to December total (%) | ||||||||||
| 2011 | 1.5 | -4.2 | 7.8 | 5.1 | 11.6 | 5.5 | 12.2 | |||
| 2012 | 0.4 | 0.5 | 0.2 | -3.6 | 2.8 | 3.0 | 6.1 | |||
| 2013 | 3.6 | 0.0 | 7.2 | 5.6 | 4.9 | 13.9 | 15.1 | |||
| Table 5 Overseas Trips to Ireland by Area of Residence for the period October - December, 2010 - 2013 | ||||||||
| October - December | ||||||||
| Area of Residence1 | 2010 | 2011 | 2012 | 2013 | ||||
| Total Overseas Trips to Ireland | 1,414,300 | 1,369,700 | 1,438,000 | 1,580,100 | ||||
| Great Britain | 657,600 | 655,200 | 646,400 | 727,100 | ||||
| Belgium, Netherlands and Luxembourg | 51,100 | 56,400 | 54,800 | 62,500 | ||||
| France | 75,700 | 69,600 | 71,300 | 75,400 | ||||
| Germany | 78,500 | 90,600 | 93,100 | 103,400 | ||||
| Italy | 48,100 | 42,700 | 49,800 | 48,700 | ||||
| Spain | 52,800 | 50,400 | 55,500 | 57,200 | ||||
| Norway, Sweden, Finland and Denmark | 41,800 | 41,100 | 45,600 | 45,200 | ||||
| Other Europe2 | 129,300 | 114,000 | 135,300 | 135,200 | ||||
| USA and Canada | 201,400 | 176,200 | 201,300 | 223,500 | ||||
| Australia, New Zealand and Other Oceania2 | 33,100 | 26,900 | 34,300 | 43,000 | ||||
| Other Areas2 | 45,000 | 46,600 | 50,700 | 59,000 | ||||
| 1Country estimates are subject to high levels of sample variation and therefore should be interpreted with caution. See Background Notes. | ||||||||
| 2See Background Notes for countries included. | ||||||||
| Table 6 Overseas Trips in each calendar quarter, 2008 - 2013 | ||||||||||||
| Trips to Ireland by Area of Residence | ||||||||||||
| Irish Residents' Trips Overseas | ||||||||||||
| Trips to Ireland | Great Britain | Other Europe | North America | Other Areas | ||||||||
| Year | Period | All Trips | ||||||||||
| 2008 | Quarter 1 | 3,304,700 | 1,762,500 | 1,542,200 | 849,500 | 480,200 | 155,900 | 56,700 | ||||
| Quarter 2 | 4,210,200 | 2,050,800 | 2,159,400 | 1,023,200 | 729,000 | 312,100 | 95,200 | |||||
| Quarter 3 | 4,900,700 | 2,428,300 | 2,472,400 | 1,148,900 | 839,900 | 357,200 | 126,400 | |||||
| Quarter 4 | 3,300,800 | 1,635,800 | 1,665,000 | 850,900 | 561,200 | 179,400 | 73,500 | |||||
| Total | 15,716,400 | 7,877,400 | 7,839,000 | 3,872,400 | 2,610,300 | 1,004,600 | 351,700 | |||||
| 2009 | Quarter 1 | 2,941,900 | 1,539,800 | 1,402,200 | 722,400 | 488,700 | 142,200 | 48,800 | ||||
| Quarter 2 | 3,801,500 | 1,899,600 | 1,901,900 | 858,500 | 658,200 | 305,000 | 80,300 | |||||
| Quarter 3 | 4,314,400 | 2,137,100 | 2,177,300 | 956,100 | 757,600 | 356,400 | 107,300 | |||||
| Quarter 4 | 2,918,900 | 1,472,900 | 1,446,100 | 720,100 | 477,800 | 176,800 | 71,500 | |||||
| Total | 13,976,900 | 7,049,300 | 6,927,500 | 3,257,000 | 2,382,300 | 980,400 | 307,900 | |||||
| 2010 | Quarter 1 | 2,523,900 | 1,439,200 | 1,084,800 | 526,600 | 366,500 | 137,300 | 54,200 | ||||
| Quarter 2 | 3,214,500 | 1,673,100 | 1,541,400 | 701,700 | 500,500 | 264,000 | 75,200 | |||||
| Quarter 3 | 4,133,800 | 2,137,200 | 1,996,600 | 852,600 | 700,900 | 332,800 | 110,200 | |||||
| Quarter 4 | 2,736,800 | 1,322,500 | 1,414,300 | 657,600 | 477,300 | 201,400 | 78,100 | |||||
| Total | 12,609,100 | 6,572,000 | 6,037,100 | 2,738,500 | 2,045,200 | 935,600 | 317,800 | |||||
| 2011 | Quarter 1 | 2,445,200 | 1,266,400 | 1,178,800 | 550,700 | 407,800 | 154,700 | 65,600 | ||||
| Quarter 2 | 3,558,000 | 1,753,000 | 1,805,000 | 760,700 | 647,500 | 303,800 | 92,900 | |||||
| Quarter 3 | 4,114,100 | 1,962,400 | 2,151,700 | 911,600 | 763,200 | 352,400 | 124,600 | |||||
| Quarter 4 | 2,680,700 | 1,311,000 | 1,369,700 | 655,200 | 464,700 | 176,200 | 73,600 | |||||
| Total | 12,798,000 | 6,292,800 | 6,505,200 | 2,878,100 | 2,283,200 | 987,100 | 356,700 | |||||
| 2012 | Quarter 1 | 2,399,900 | 1,234,800 | 1,165,100 | 562,400 | 392,800 | 144,700 | 65,200 | ||||
| Quarter 2 | 3,544,700 | 1,727,500 | 1,817,300 | 735,200 | 672,400 | 305,700 | 104,000 | |||||
| Quarter 3 | 4,099,900 | 2,003,200 | 2,096,700 | 830,200 | 776,800 | 365,200 | 124,500 | |||||
| Quarter 4 | 2,798,400 | 1,360,400 | 1,438,000 | 646,400 | 505,400 | 201,300 | 85,000 | |||||
| Total | 12,842,900 | 6,325,800 | 6,517,200 | 2,774,200 | 2,347,400 | 1,016,900 | 378,600 | |||||
| 2013 | Quarter 1 | 2,460,600 | 1,208,900 | 1,251,700 | 570,200 | 444,000 | 168,800 | 68,700 | ||||
| Quarter 2 | 3,645,400 | 1,752,400 | 1,893,000 | 726,900 | 705,200 | 350,800 | 110,100 | |||||
| Quarter 3 | 4,293,500 | 2,032,600 | 2,261,000 | 904,700 | 786,200 | 415,000 | 155,000 | |||||
| Quarter 4 | 2,909,400 | 1,329,300 | 1,580,100 | 727,100 | 527,600 | 223,500 | 102,000 | |||||
| Total | 13,309,000 | 6,323,100 | 6,985,900 | 2,928,900 | 2,463,000 | 1,158,100 | 435,900 | |||||
| Table 7 Overseas Trips to Ireland by Area of Residence, 2012 - 2013 | ||||||||||||
| 2012 | 2013 | 2012 | 2013 | |||||||||
| Area of Residence1 | Quarter 1 | Quarter 2 | Quarter 3 | Quarter 4 | Quarter 1 | Quarter 2 | Quarter 3 | Quarter 4 | ||||
| Total Overseas Trips to Ireland | 6,517,200 | 6,985,900 | 1,165,100 | 1,817,300 | 2,096,700 | 1,438,000 | 1,251,700 | 1,893,000 | 2,261,000 | 1,580,100 | ||
| Great Britain | 2,774,200 | 2,928,900 | 562,400 | 735,200 | 830,200 | 646,400 | 570,200 | 726,900 | 904,700 | 727,100 | ||
| Belgium, Netherlands and Luxembourg | 237,300 | 264,900 | 44,900 | 68,900 | 68,600 | 54,800 | 49,400 | 76,400 | 76,600 | 62,500 | ||
| France | 396,300 | 433,700 | 66,600 | 129,000 | 129,400 | 71,300 | 84,300 | 144,500 | 129,500 | 75,400 | ||
| Germany | 448,200 | 482,900 | 65,900 | 134,100 | 155,100 | 93,100 | 72,800 | 141,000 | 165,700 | 103,400 | ||
| Italy | 251,700 | 234,000 | 39,700 | 67,800 | 94,300 | 49,800 | 38,800 | 63,200 | 83,300 | 48,700 | ||
| Spain | 253,100 | 263,000 | 43,100 | 63,300 | 91,100 | 55,500 | 42,500 | 65,700 | 97,600 | 57,200 | ||
| Norway, Sweden, Finland and Denmark | 191,000 | 209,600 | 30,000 | 57,000 | 58,400 | 45,600 | 39,200 | 59,300 | 65,800 | 45,200 | ||
| Other Europe2 | 569,900 | 575,000 | 102,500 | 152,300 | 179,800 | 135,300 | 117,000 | 155,200 | 167,600 | 135,200 | ||
| USA and Canada | 1,016,900 | 1,158,100 | 144,700 | 305,700 | 365,200 | 201,300 | 168,800 | 350,800 | 415,000 | 223,500 | ||
| Australia, New Zealand and Other Oceania2 | 155,700 | 187,700 | 21,600 | 43,300 | 56,500 | 34,300 | 26,200 | 49,300 | 69,200 | 43,000 | ||
| Other Areas2 | 222,900 | 248,200 | 43,600 | 60,700 | 67,900 | 50,700 | 42,500 | 60,800 | 85,900 | 59,000 | ||
| 1Country estimates are subject to high levels of sample variation and therefore should be interpreted with caution. See Background Notes. | ||||||||||||
| 2See Background Notes for countries included. | ||||||||||||
| Table 8 Overseas Trips in each calendar quarter - Seasonally Adjusted, 2008 - 2013 | ||||||||||||
| Trips to Ireland by Area of Residence | ||||||||||||
| Irish Residents' Trips Overseas | ||||||||||||
| Trips to Ireland | Great Britain | Other Europe | North America | Other Areas | ||||||||
| Year | Period | All Trips | ||||||||||
| 2008 | Quarter 1 | 4,089,500 | 2,074,800 | 1,992,500 | 1,003,800 | 636,100 | 264,100 | 84,800 | ||||
| Quarter 2 | 3,989,500 | 1,944,700 | 2,035,800 | 1,010,900 | 663,700 | 261,000 | 91,000 | |||||
| Quarter 3 | 3,856,400 | 1,942,500 | 1,895,200 | 928,300 | 637,100 | 245,400 | 90,000 | |||||
| Quarter 4 | 3,795,500 | 1,940,000 | 1,921,800 | 921,100 | 678,900 | 236,900 | 83,500 | |||||
| Total | 15,730,900 | 7,902,000 | 7,845,300 | 3,864,100 | 2,615,800 | 1,007,400 | 349,300 | |||||
| 2009 | Quarter 1 | 3,793,500 | 1,859,000 | 1,893,800 | 899,200 | 664,100 | 242,100 | 72,900 | ||||
| Quarter 2 | 3,512,700 | 1,769,700 | 1,741,100 | 821,900 | 590,900 | 255,600 | 75,600 | |||||
| Quarter 3 | 3,379,300 | 1,705,400 | 1,671,500 | 780,700 | 574,400 | 245,400 | 76,600 | |||||
| Quarter 4 | 3,357,800 | 1,733,700 | 1,670,500 | 772,900 | 573,200 | 235,700 | 81,900 | |||||
| Total | 14,043,300 | 7,067,800 | 6,976,900 | 3,274,700 | 2,402,600 | 978,800 | 307,000 | |||||
| 2010 | Quarter 1 | 3,236,500 | 1,733,000 | 1,437,200 | 652,900 | 508,400 | 234,200 | 79,200 | ||||
| Quarter 2 | 2,979,400 | 1,560,000 | 1,425,700 | 675,600 | 448,300 | 212,800 | 70,300 | |||||
| Quarter 3 | 3,226,300 | 1,698,000 | 1,541,900 | 697,700 | 525,400 | 230,100 | 79,400 | |||||
| Quarter 4 | 3,140,400 | 1,543,100 | 1,616,300 | 698,400 | 572,100 | 263,900 | 89,400 | |||||
| Total | 12,582,600 | 6,534,100 | 6,021,100 | 2,724,600 | 2,054,200 | 941,000 | 318,300 | |||||
| 2011 | Quarter 1 | 3,241,600 | 1,587,500 | 1,605,100 | 689,400 | 567,700 | 262,600 | 96,700 | ||||
| Quarter 2 | 3,234,800 | 1,604,200 | 1,633,600 | 731,400 | 570,600 | 252,800 | 88,000 | |||||
| Quarter 3 | 3,199,800 | 1,555,500 | 1,661,100 | 746,900 | 580,700 | 243,400 | 89,600 | |||||
| Quarter 4 | 3,110,000 | 1,534,700 | 1,579,000 | 698,700 | 558,700 | 233,900 | 83,900 | |||||
| Total | 12,786,200 | 6,281,900 | 6,478,800 | 2,866,400 | 2,277,700 | 992,700 | 358,200 | |||||
| 2012 | Quarter 1 | 3,200,200 | 1,548,300 | 1,593,600 | 710,700 | 552,200 | 241,500 | 95,600 | ||||
| Quarter 2 | 3,201,700 | 1,585,300 | 1,643,000 | 706,900 | 588,500 | 253,700 | 99,800 | |||||
| Quarter 3 | 3,195,400 | 1,586,900 | 1,621,300 | 678,000 | 588,300 | 255,300 | 89,800 | |||||
| Quarter 4 | 3,249,300 | 1,592,000 | 1,655,600 | 686,700 | 606,800 | 266,100 | 96,700 | |||||
| Total | 12,846,600 | 6,312,500 | 6,513,500 | 2,782,300 | 2,335,800 | 1,016,600 | 381,900 | |||||
| 2013 | Quarter 1 | 3,209,400 | 1,513,100 | 1,657,800 | 695,100 | 613,500 | 279,100 | 98,400 | ||||
| Quarter 2 | 3,344,800 | 1,612,800 | 1,750,400 | 723,900 | 623,700 | 289,800 | 105,700 | |||||
| Quarter 3 | 3,346,700 | 1,604,900 | 1,747,800 | 734,200 | 607,700 | 288,100 | 112,200 | |||||
| Quarter 4 | 3,379,300 | 1,567,300 | 1,809,600 | 767,000 | 620,400 | 294,200 | 116,800 | |||||
| Total | 13,280,200 | 6,298,100 | 6,965,600 | 2,920,200 | 2,465,300 | 1,151,200 | 433,100 | |||||
| Table 9 Overseas Trips to Ireland by Area of Residence for the years, 2010 - 2013 | |||||||
| Area of Residence1 | 2010 | 2011 | 2012 | 2013 | |||
| Total Overseas Trips to Ireland | 6,037,100 | 6,505,200 | 6,517,200 | 6,985,900 | |||
| Great Britain | 2,738,500 | 2,878,100 | 2,774,200 | 2,928,900 | |||
| France | 342,500 | 401,500 | 396,300 | 433,700 | |||
| Germany | 377,300 | 422,900 | 448,200 | 482,900 | |||
| Italy | 221,800 | 220,100 | 251,700 | 234,000 | |||
| Spain | 221,300 | 244,900 | 253,100 | 263,000 | |||
| Belgium | 67,000 | 87,100 | 86,700 | 100,400 | |||
| Netherlands | 122,700 | 138,500 | 143,000 | 155,000 | |||
| Norway | 46,500 | 54,200 | 51,200 | 52,700 | |||
| Sweden | 54,500 | 60,000 | 74,600 | 75,900 | |||
| Denmark | 44,400 | 48,200 | 44,200 | 53,200 | |||
| Austria | 42,700 | 46,200 | 49,000 | 54,000 | |||
| Poland | 171,100 | 170,600 | 168,900 | 159,700 | |||
| Switzerland | 55,400 | 71,400 | 80,900 | 76,700 | |||
| Other Europe2 | 278,100 | 317,500 | 299,600 | 321,900 | |||
| USA | 848,300 | 888,600 | 904,200 | 1,035,500 | |||
| Canada | 87,200 | 98,500 | 112,700 | 122,500 | |||
| Australia, New Zealand and Other Oceania2 | 135,300 | 141,100 | 155,700 | 187,700 | |||
| Africa2 | 36,300 | 38,600 | 41,100 | 39,000 | |||
| Central, South and Other Americas2 | 35,200 | 49,500 | 48,800 | 55,200 | |||
| Asia and Middle East2 | 111,000 | 127,500 | 133,000 | 154,000 | |||
| 1Country estimates are subject to high levels of sample variation and therefore should be interpreted with caution. See Background Notes. | |||||||
| 2See Background Notes for countries included. | |||||||
Periodicity
Monthly - rolling three month release.
Scope
Overseas Travel.
Coverage
This release covers Overseas Travel into and out of the Republic of Ireland, however travel by residents of Northern Ireland into or out of the Republic of Ireland or domestic travel within the Republic of Ireland is excluded.
Data Collection
Data from the Country of Residence Survey (CRS) is used in this release. This survey is conducted at Dublin, Cork, Shannon, Knock and Kerry airports and Rosslare, Dun Laoghaire, Ringaskiddy and Dublin seaports. Residency data is collected from passengers by a Central Statistics Office (CSO) interviewer. Surveys are also conducted on behalf of the CSO at Holyhead Port by the UK's Office of National Statistics.
Sample Design
A sample of flights and sailings is selected to facilitate proper representation of airport/seaport pairings, day, night, week day and weekend flights/sailings.
On the selected flights/sailings for the CRS, a 1 in 5 (20%) systematic sample of passengers is selected and their country of residence is recorded.
Sample results are grossed to total passenger numbers travelling for each airport or seaport pairing, as provided by the airports and ferry companies.
Where there is no survey coverage in a period for an airport/seaport pairing, results are imputed using the 'nearest neighbour' imputation methodology.
Sample Size
The sample size for the Overseas Travel release in respect of the three month period October - December 2013 was just under 86,500 passengers.
Seasonal Adjustment
Seasonally adjusted quarterly data is available in Table 8. Trip numbers are subject to a high degree of seasonality. These seasonal fluctuations do not affect annual comparisons but they do affect monthly or quarterly comparisons. Typically trips are at their highest during the summer months, although there are also clear peaks around Christmas and Easter. To facilitate interpretation of underlying trends, trip numbers are adjusted to remove these seasonal trends. Seasonal adjustment is conducted using the direct seasonal adjustment approach. Under this approach each individual series is independently adjusted each month, e.g. aggregate series are adjusted without reference to the component series. Seasonal adjustment models are developed for each series based on unadjusted data from January 2000 to the current period. These models are then applied to the entire series. Seasonal factors are updated each quarter.
The adjustments are completed by applying the X-12-ARIMA model, developed by the U.S. Census Bureau to the unadjusted data. This methodology estimates seasonal factors while also taking into consideration factors that impact on the quality of the seasonal adjustment such as:
Rounding
Individual figures have been rounded independently and the sum of the component items may therefore not necessarily add to the totals shown.
Reliability of Results
Estimation of survey results using the above sampling design introduces a statistical variability which would not be present if all passengers from every flight/sailing had been sampled. This means that the survey results are best estimates based on the information collected for the sample.
This variability is expressed by the standard error calculation. The standard error gives the relative size of the 'sampling error' (variability) present in an estimate compared with the estimate itself. In general, estimates can be said to have a relative precision of twice their standard error.
The effect of sampling error is greater for small estimates and may, in particular, make it more difficult to compare figures for different time periods. Standard error estimates in respect of the major Area of Residence categories for Quarter 1 to Quarter 4 2013 calendar quarters are presented in the following tables.
|
|
|
Overseas Trips to Ireland by Area of Residence | |||
|---|---|---|---|---|---|
|
Q1 2013 | Irish Residents' Trips Overseas | Great Britain | Other Europe | North America | Other Areas |
| Total Trips | 1,208,860 | 570,180 | 444,028 | 168,810 | 68,724 |
| Standard Error | 4,276 | 3,056 | 2,942 | 1,965 | 1,376 |
|
Standard Error as % of estimate |
0.35 | 0.54 | 0.66 | 1.16 | 2.0 |
|
|
| Overseas Trips to Ireland by Area of Residence | |||
|---|---|---|---|---|---|
|
Q2 2013 |
Irish Residents' Trips Overseas | Great Britain | Other Europe | North America | Other Areas |
| Total Trips | 1,752,368 | 726,895 | 705,237 | 350,762 | 110,125 |
| Standard Error | 5,574 | 3,826 | 4,046 | 2,868 | 1,956 |
|
Standard Error as % of estimate |
0.32 | 0.53 | 0.57 | 0.82 | 1.78 |
|
|
| Overseas Trips to Ireland by Area of Residence | |||
|---|---|---|---|---|---|
|
Q3 2013 | Irish Residents' Trips Overseas | Great Britain | Other Europe | North America | Other Areas |
| Total Trips | 2,032,564 | 904,734 | 786,177 | 415,006 | 155,048 |
| Standard Error | 5,843 | 4,101 | 4,154 | 3,128 | 2,224 |
|
Standard Error as % of estimate |
0.29 | 0.45 | 0.53 | 0.75 | 1.43 |
|
|
| Overseas Trips to Ireland by Area of Residence | |||
|---|---|---|---|---|---|
|
Q4 2013 | Irish Residents' Trips Overseas | Great Britain | Other Europe | North America | Other Areas |
| Total Trips | 1,329,295 | 727,069 | 527,600 | 223,490 | 101,973 |
| Standard Error | 4,886 | 3,552 | 3,316 | 2,388 | 1,731 |
|
Standard Error as % of estimate |
0.37 | 0.49 | 0.63 | 1.07 | 1.70 |
In general, the more detailed the classification provided the greater the standard error of the estimates. In the derivation of the results, the assumption was made that non-respondents had similar characteristics and activity levels to those respondents in the same stratification cell. This assumption, which is usual in surveys such as this, may introduce some slight bias into the results. Moreover, although every effort was made to ensure that the information collected is correct, it is possible that some minor non-sampling errors remain undetected.
The CSO "Airport Pairings" database contains information on every direct flight in and out of the nine Irish airports on a monthly basis. December 2013 passenger figures will be added to the database from early March 2014. For details please go to http://cso.ie/shorturl.aspx/15
(1) Trips
The data presented in this report is in terms of trip numbers. A trip is defined as a journey (usually including the return) from one place to another.
(2) Visitor
The definition of Visitor used in these surveys is based on that agreed with Eurostat, the European Statistical Office. A Visitor is defined as 'any person travelling to a place other than that of his/her usual environment for less than twelve months and whose main purpose is other than the exercise of an activity remunerated from within the place visited'. However, as the CRS does not establish the reason for an individual's trip or length of stay, those travelling for reason of remuneration or for more than one year to a country cannot be excluded. Therefore, trips may include those travelling for paid work. Commercial Drivers travelling on sea routes are excluded.
(3) Country of Residence
Country of Residence is defined as the country in which the person has resided during the past year.
(4) Transit/Transfer Passengers
Transit passengers are defined as those who make a stop at an airport without any particular purpose other than being en route to another destination. These passengers generally do not disembark from their aircraft and are not covered by the Country of Residence Survey.
Transfer passengers or 'connecting passengers' are also defined as those who make a stop at an airport without any particular purpose other than being en route to another destination. However, unlike transits, transfer passengers disembark the aircraft and pass through the airport en route to their connecting flight. Such passengers may be surveyed for the Country of Residence Survey and are thus included in the estimates for trips.
(5) Timing of Easter
Easter falls each year on a Sunday between March 22nd and April 25th, inclusively. In 2013 Easter Sunday fell on March 31st, while in 2012 it fell on April 8th. Trip numbers each year are greatly influenced by when Easter falls.
Dates for Easter Sunday
2013 - 31st March
2012 - 8th April
2011 - 24th April
2010 - 4th April
|
Other Europe Tables 1-4, 6 and 8 Includes the following countries: | ||
|---|---|---|
| Aland Islands | Gibraltar | Netherlands |
| Albania | Greece | Norway |
| Andorra | Guernsey | Poland |
| Austria | Hungary | Portugal |
| Belarus | Iceland | Romania |
| Belgium | Isle of Man | Russian Federation |
| Bosnia and Herzegovina | Italy | San Marino |
| Bulgaria | Jersey | Serbia |
| Croatia | Latvia | Slovakia |
| Cyprus | Liechtenstein | Slovenia |
| Czech Republic | Lithuania | Spain |
| Denmark | Luxembourg | Sweden |
| Estonia | Macedonia, Former Yugoslav Republic of | Switzerland |
| Faroe Islands | Malta | Turkey |
| Finland | Moldova, Republic of | Ukraine |
| France | Monaco | Vatican City |
| Germany | Montenegro |
|
North America Tables 1-4, 6 and 8 Includes the following countries: |
|---|
| Canada |
| United States |
|
Other Areas Tables 1-4, 6 and 8 Includes the following countries: |
|---|
| Africa (see below for breakdown of countries) |
| Australia, New Zealand and Other Oceania (see below for breakdown of countries) |
| Central, South and Other Americas (see below for breakdown of countries) |
| Eastern Asia, Middle East and Other Asia (see below for breakdown of countries) |
|
Other Europe Tables 5 and 7 Includes the following countries: | ||
|---|---|---|
| Aland Islands | Greece | Montenegro |
| Albania | Guernsey | Poland |
| Andorra | Hungary | Portugal |
| Austria | Iceland | Romania |
| Belarus | Isle of Man | Russian Federation |
| Bosnia and Herzegovina | Jersey | San Marino |
| Bulgaria | Latvia | Serbia |
| Croatia | Liechtenstein | Slovakia |
| Cyprus | Lithuania | Slovenia |
| Czech Republic | Macedonia, The Former Yugoslav Republic of | Switzerland |
| Estonia | Malta | Turkey |
| Faroe Islands | Moldova, Republic of | Ukraine |
| Gibraltar | Monaco | Vatican City |
|
Other Europe Table 9 Includes the following countries: | ||
|---|---|---|
| Aland Islands | Greece | Monaco |
| Albania | Guernsey | Montenegro |
| Andorra | Hungary | Portugal |
| Belarus | Iceland | Romania |
| Bosnia and Herzegovina | Isle of Man | Russian Federation |
| Bulgaria | Jersey | San Marino |
| Croatia | Latvia | Serbia |
| Cyprus | Liechtenstein | Slovakia |
| Czech Republic | Lithuania | Slovenia |
| Estonia | Luxembourg | Turkey |
| Faroe Islands | Macedonia, The Former Yugoslav Republic of | Ukraine |
| Finland | Malta | Vatican City |
| Gibraltar | Moldova, Republic of |
|
Australia, New Zealand and Other Oceania Tables 5, 7 and 9 Includes the following countries: | ||
|---|---|---|
| American Samoa | Kiribati | Pitcairn |
| Australia | Marshall Islands | Samoa |
| Antarctica | Micronesia, Federated States of | Solomon Islands |
| Christmas Island | Nauru | South Georgia and the South Sandwich Islands |
| Cocos (Keeling) Islands | New Caledonia | Svalbard and Jan Mayen |
| Cook Islands | New Zealand | Tokelau |
| Fiji | Niue | Tonga |
| French Polynesia | Norfolk Island | Tuvalu |
| French Southern Territories | Northern Mariana Islands | United States Minor Outlying Islands |
| Guam | Palau | Vanuatu |
| Heard Island and McDonald Islands | Papua New Guinea | Wallis and Futuna |
|
Other Areas Tables 5 and 7 Includes the following group of countries: |
|---|
|
Central, South and Other Americas (See below for country breakdowns) |
|
Africa (See below for country breakdowns) |
|
Eastern Asia, Middle East and Other Asia (See below for country breakdowns) |
|
Central, South and Other Americas Table 9 Includes the following countries: | ||
|---|---|---|
| Anguilla | Dominican Republic | Nicaragua |
| Antigua and Barbuda | Ecuador | Panama |
| Argentina | El Salvador | Paraguay |
| Aruba | Falkland Islands (Malvinas) | Peru |
| Bahamas | French Guiana | Puerto Rico |
| Barbados | Greenland | Saint Kitts and Nevis |
| Belize | Grenada | Saint Lucia |
| Bermuda | Guadeloupe | Saint Pierre and Miquelon |
| Bolivia | Guatemala | Saint Vincent and the Grenadines |
| Brazil | Guyana | Suriname |
| Cayman Islands | Haiti | Trinidad and Tobago |
| Chile | Honduras | Turks and Caicos Islands |
| Colombia | Jamaica | Uruguay |
| Costa Rica | Martinique | Venezuela |
| Cuba | Mexico | Virgin Islands, British |
| Dominica | Montserrat | Virgin Islands, US |
|
Africa Table 9 Includes the following countries: | ||
|---|---|---|
| Algeria | Gambia | Rwanda |
| Angola | Ghana | Saint Helena |
| Benin | Guinea | Sao Tome and Principe |
| Botswana | Guinea-Bissau | Senegal |
| Burkina Faso | Kenya | Seychelles |
| Burundi | Lesotho | Sierra Leone |
| Cameroon | Liberia | Somalia |
| Cape Verde | Libya | South Africa |
| Central African Republic | Madagascar | South Sudan |
| Chad | Malawi | Sudan |
| Comoros | Mali | Swaziland |
| Congo | Mauritania | Tanzania, United Republic of |
| Congo, The Democratic Republic of the | Mauritius | Togo |
| Cote d'Ivoire | Mayotte | Tunisia |
| Djibouti | Morocco | Uganda |
| Egypt | Mozambique | Western Sahara |
| Equatorial Guinea | Namibia | Zambia |
| Eritrea | Niger | Zimbabwe |
| Ethiopia | Nigeria | |
| Gabon | Reunion |
|
Eastern Asia Table 9 Includes the following countries: | ||
|---|---|---|
| China | Korea, Republic of | Taiwan, Province of China |
| Hong Kong | Korea, Democratic People's Republic of | |
| Japan | Mongolia |
|
Middle East Table 9 Includes the following countries: | ||
|---|---|---|
| Afghanistan | Jordan | Qatar |
| Bahrain | Kuwait | Saudi Arabia |
| Iran, Islamic Republic of | Lebanon | Syrian Arab Republic |
| Iraq | Oman | United Arab Emirates |
| Israel | Palestinian Territory, Occupied | Yemen |
|
Other Asia Table 9 Includes the following countries: | ||
|---|---|---|
| Armenia | Kazakhstan | Singapore |
| Azerbaijan | Kyrgyzstan | Sri Lanka |
| Bangladesh | Lao People's Democratic Republic | Tajikistan |
| Bhutan | Macao | Thailand |
| British Indian Ocean Territory | Malaysia | Timor Leste |
| Brunei Darussalam | Maldives | Turkmenistan |
| Cambodia | Myanmar | Uzbekistan |
| Georgia | Nepal | Vietnam |
| India | Pakistan | |
| Indonesia | Philippines |
 Hide Background Notes
Scan the QR code below to view this release online or go to
http://www.cso.ie/en/releasesandpublications/er/ot/overseastraveloctober-december2013/
 Show Table 1 Overseas Trips for the period October - December, 2010 - 2013
 Hide Table 1 Overseas Trips for the period October - December, 2010 - 2013