
| GVA at constant (2015) basic prices for sectors dominated by Foreign-owned MNEs and Other Sectors | |||
| 2015 | 2016 | ||
| Amount €m | Amount €m | % Change | |
| Foreign-owned MNE dominated | 97,608 | 102,346 | 4.9 |
| Other | 145,694 | 153,453 | 5.3 |
| Total | 243,302 | 255,798 | 5.1 |
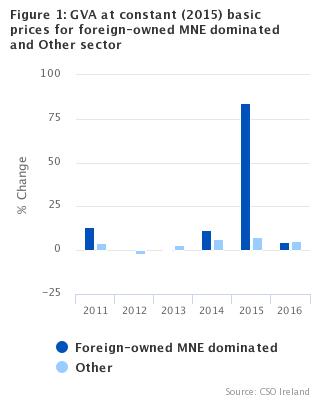
Gross Value Added (GVA) at constant (2015) basic prices for the non-MNE dominated sectors of the economy increased by 5.3 per cent between 2015 and 2016. The sectors where foreign-owned multinational enterprises are dominant grew by 4.9 per cent over the same period, resulting in an overall growth rate of 5.1 per cent.
GVA for the non-MNE dominated sectors in 2016 was 15.7 per cent higher than the equivalent 2007 level.
GVA for the total economy exceeded €250 billion for the first time in the 2016 reference period, with GVA for MNEs exceeding €100 billion while GVA for the non-MNE dominated sectors exceeded €150 billion.
Of the larger non-MNE sectors, growth was positive in the Wholesale & Retail sector incl. the sale and repair of motor vehicles (+6.0 per cent), Administrative and support service activities (+5.3 per cent), Construction (+15.1 per cent) and the Accommodation and food services sector (+5.5 per cent). There was a slight decline in the Manufacture of Food, beverages and tobacco products sector (-0.3 per cent).
The share of total GVA at constant prices accounted for by the foreign-owned MNE dominated sectors now stands at 38.6 per cent, a slight decline from the peak of 40.1 per cent in 2015.
|
The composition of the sectors dominated by foreign-owned multinational enterprises in terms of constituent Nace Rev 2 codes is given in Table 3 of this release. For data at the more detailed 37 sectoral breakdown level, please refer to Tables 21 and 22 of the National Income & Expenditure 2016 publication issued in August 2017 National Income & Expenditure 2016 publication. For information on chain linking see pages 1, 2, 3, 8, 9, 12, 13, 18 and 22 of NIE 2016 Methodology Note (PDF 680KB)
|
| Other | Foreign-owned MNE dominated | |
| 2011 | 2.85207443197108 | 3.33621657482409 |
| 2012 | -1.54740874780909 | 0.105889453536618 |
| 2013 | 2.23317844222137 | -0.178739700647507 |
| 2014 | 4.38866355798275 | 3.01302850079495 |
| 2015 | 4.82014636499879 | 21.6104484514608 |
| 2016 | 3.18891771800724 | 1.94727907509889 |
| Table 1 Gross Value Added at Current Basic Prices | €million | |||||
| 2011 | 2012 | 2013 | 2014 | 2015 | 2016 | |
| Foreign-owned MNE dominated | 40,276 | 40,357 | 40,284 | 44,504 | 97,608 | 98,597 |
| Other | 116,389 | 119,328 | 125,430 | 134,078 | 145,694 | 156,672 |
| Total | 156,665 | 159,685 | 165,714 | 178,583 | 243,302 | 255,269 |
| Annual Percentage Changes | ||||||
| Foreign-owned MNE dominated | 9.1% | 0.2% | -0.2% | 10.5% | 119.3% | 1.0% |
| Other | 1.2% | 2.5% | 5.1% | 6.9% | 8.7% | 7.5% |
| Total | 3.2% | 1.9% | 3.8% | 7.8% | 36.2% | 4.9% |
| Table 2 Gross Value Added at Constant Basic Prices (Chain-linked annually and referenced to year 2015) | €million | |||||
| 2011 | 2012 | 2013 | 2014 | 2015 | 2016 | |
| Foreign-owned MNE dominated | 47,767 | 47,947 | 47,653 | 53,047 | 97,608 | 102,346 |
| Other | 126,852 | 124,225 | 127,898 | 135,755 | 145,694 | 153,453 |
| Total | 178,138 | 175,570 | 179,177 | 192,439 | 243,302 | 255,798 |
| Annual Percentage Changes | ||||||
| Foreign-owned MNE dominated | 13.3% | 0.4% | -0.6% | 11.3% | 84.0% | 4.9% |
| Other | 3.9% | -2.1% | 3.0% | 6.1% | 7.3% | 5.3% |
| Total | 6.2% | -1.4% | 2.1% | 7.4% | 26.4% | 5.1% |
| Table 3 Composition of Foreign-owned multinational enterprise dominated sector and Other sectors1 | |||||||||||||||
| Description | Nace code | Percentage of 2016 GVA at constant basic prices | |||||||||||||
| Chemicals and chemical products | 20 | 1.6% | |||||||||||||
| Software and communications sectors | 58-63 | 9.2% | |||||||||||||
| Other NACE sectors dominated by Foreign-owned MNEs2 | 18.2, 21, 26, 27 and 32.5 | 29.2% | |||||||||||||
| (Reproduction of recorded media, Basic pharmaceutical products and pharmaceutical preparations, Computer, electronic and optical products, Electrical equipment, Medical and dental instruments and supplies) | |||||||||||||||
| Foreign-owned MNE dominated Total | 40.0% | ||||||||||||||
| “Other” Sector3 | 60.0% | ||||||||||||||
| 1 Foreign-owned Multinational Enterprise (MNE) dominated sectors occur where MNE turnover on average exceeds 85% of the sector total | |||||||||||||||
| 2 Nace Rev.2 divisions 18, 21, 26, 27 & 32.5 are collapsed together for 2016 for confidentiality reasons | |||||||||||||||
| 3 The "Other" Sector includes all Nace sectors excluding those listed as part of the Foreign-owned MNE dominated sector above and includes Wholesale & Retail sector incl the sale and repair of motor vehicles, Administrative & support service activities, Construction, Accommodation & food services and the Manufacture of Food, beverages & tobacco products | |||||||||||||||
Background Notes
Gross Value Added at Constant Basic Prices Nace Rev 2
This release provides gross value added at current basic prices and constant basic prices (chain linked and referenced to 2015) for the economy divided into two sectors, namely
(a) the economic sectors dominated by Foreign-owned Multi National Enterprises and
(b) all other remaining sectors.
It also provides data concerning the composition of the Foreign-owned multinational dominated sector.
Gross value added at basic prices is measured as the difference between output at basic prices and intermediate consumption at purchasers' prices.
The sectoral data underlying the aggregates in the release are the same as those used for National Income & Expenditure (NIE 2016) Tables 4, which gives a breakdown of the economy at Constant Basic Prices by 10 principal economic sectors (Nace Rev.2 A10), and NIE Table 22 which illustrates a 37 sector breakdown of the Irish economy. The correspondence with the relevant A10 sections of NACE Rev.2 is as follows:
|
Agriculture, forestry and fishing |
Section A |
|
Industry (excluding Construction) |
Sections B, C, D, E |
|
Of which: Manufacturing |
Section C |
|
Construction |
Section F |
|
Distribution, transport, hotels and restaurants |
Sections G, H, I |
|
Information and communication |
Section J |
|
Financial and insurance activities |
Section K |
|
Real estate activities |
Section L |
|
Professional, admin and support services |
Sections M, N |
|
Public admin, education and health |
Sections O, P, Q |
|
Arts, entertainment and other services |
Sections R, S, T |
National accounts are compiled in the EU according to the European System of National and Regional Accounts (ESA) framework. In 2014, the new ESA 2010 framework replaced the ESA 95 version and all EU member states were required to adopt ESA 2010 by September 2014. ESA 2010 is the European version of the current UN mandated international standards for national accounts statistics, the System of National Accounts (SNA) 2008. The results for all years in this release are published on an ESA 2010 basis.
Nace Classification
In compliance with EU regulations the contents of the sectors in this release conform to the Nace Rev. 2 system which corresponds with the UN International Standard Industrial Classification (ISIC Rev 4).
In table 3, the following is the correspondence with the relevant NIE and Nace Rev. 2 sectors:
|
NIE Sectors |
Nace 2 Sections |
Foreign-owned |
Other |
|
Agriculture, forestry and fishing |
Section A |
|
01-03 |
|
Industry (excluding Construction) |
Sections B to E |
18.2, 20, 21, 26, |
05-18.1, |
|
Of which: Manufacturing |
Section C |
18.2, 20, 21, 26, |
10-18.1, |
|
Construction |
Section F |
41-43 |
|
|
Distribution, transport, hotels and restaurants |
Sections G to I |
|
45-56 |
|
Information and communication |
Section J |
58, 63 |
n.a. |
|
Financial and insurance activities |
Section K |
64-66 |
|
|
Real estate activities |
Section L |
68 |
|
|
Professional, admin and support services |
Sections M to N |
69-82 |
|
|
Public admin, education and health |
Sections O to Q |
|
84-88 |
|
Arts, entertainment and other services |
Sections R to T |
|
90-98 |
For further information on the Nace Rev. 2 classification of industrial activity, visit the CSO website:
http://www.cso.ie/en/surveysandmethodology/classifications/classificationofindustrialactivity.
 Hide Background Notes
Scan the QR code below to view this release online or go to
http://www.cso.ie/en/releasesandpublications/er/gvafm/grossvalueaddedforforeign-ownedmultinationalenterprisesandothersectorsannualresultsfor2016/
 Show Table 1 Gross Value Added at Current Basic Prices
 Hide Table 1 Gross Value Added at Current Basic Prices