
| GDP and GNP | ||||
| 2015 | 2016 | % change | ||
| GDP at current prices | €262,037m | €275,567m | 5.2% | |
| GDP at constant (2015) prices | €262,037m | €275,510m | 5.1% | |
| GNP at current prices | €205,990m | €226,749m | 10.1% | |
| GNP at constant (2015) prices | €205,990m | €225,781m | 9.6% | |
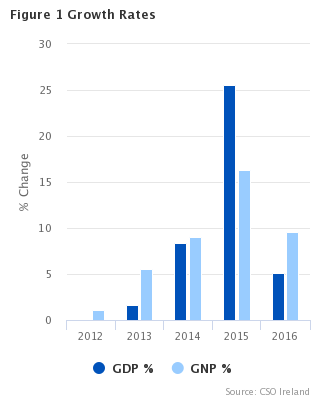
Detailed annual national accounts show that Gross Domestic Product (GDP) increased by 5.1% in constant prices between 2015 and 2016.
Gross National Product (GNP) increased by 9.6% over the same period. The present release is based on more complete and up to date data than that which was available when the Q4 2016 estimates were published in March 2017. The 2015/2016 volume changes indicated at that stage were GDP (5.2%) and GNP (9.0%).
Personal consumption expenditure on goods and services, a domestically focused indicator, increased by 3.3% between 2015 and 2016.
The results are compiled in accordance with the latest EU standard framework, ESA 2010.
| X-axis label | Agriculture forestry and fishing | Industry (excl. construction) | Construction | Distribution, transport, hotels and restaurants | Information and communication | Financial and insurance activities | Real estate activities | Professional, admin and support services | Public admin, education and health | Arts, entertainment and other services |
|---|---|---|---|---|---|---|---|---|---|---|
| 2016 | 2.6 | 96.9 | 7.1 | 32.3 | 23.6 | 16.9 | 14.6 | 28.8 | 29.4 | 3.4 |
| X-axis label | Agriculture forestry and fishing | Industry (excl. construction) | Construction | Distribution, transport, hotels and restaurants | Information and communication | Financial and insurance activities | Real estate activities | Professional, admin and support services | Public admin, education and health | Arts, entertainment and other services |
|---|---|---|---|---|---|---|---|---|---|---|
| 2015-2016 | 13 | 2.6 | 15.1 | 5.2 | 9.8 | 3.4 | 1 | 14.4 | 1.6 | 10.1 |
Growth by sector in 2016
In this year’s release, the sector breakdowns on Tables 2, 3 and 4 have been expanded to NACE Rev.2 A10. All of the sectors distinguished in Table 4 showed positive growth in 2016. Construction increased by 15.1% and Professional, Admin and Support Services increased by 14.4%. The other sectors had annual increases ranging from 1.0% to 13.0%. Figure 2 shows the relative contributions of each sector and figure 3 shows the growth in each sector.
| X-axis label | Personal consumption of goods and services | Net expenditure by local and central government on goods and services | Gross domestic fixed capital formation | Value of physical changes in stocks | Net exports of goods and services | Statistical discrepancy |
|---|---|---|---|---|---|---|
| 2008 | 93.7 | 29.5 | 44.5 | -0.2 | 14.4 | 0 |
| 2009 | 89.3 | 28.5 | 37 | -1 | 25.1 | 0 |
| 2010 | 90.1 | 26.6 | 31.4 | -0.4 | 34.9 | 0 |
| 2011 | 88.6 | 26.1 | 31.4 | 0.6 | 36.7 | 0 |
| 2012 | 87.8 | 25.2 | 36.5 | 0.8 | 35.8 | 0 |
| 2013 | 87.2 | 25.3 | 35.2 | 0.2 | 40.5 | 0 |
| 2014 | 89 | 26.5 | 41.6 | 3.2 | 45.6 | 0 |
| 2015 | 92.7 | 27 | 53.2 | 2.4 | 86.7 | 0.1 |
| 2016 | 95.7 | 28.4 | 85.7 | 2.7 | 62.5 | 0.5 |
Physical Capital Formation up 59.2% in 2016 on the expenditure side
On the expenditure side of the accounts exports grew by 4.6% between 2015 and 2016 (Table 6, at constant prices). Imports increased by 16.4% over the same period. The growth rate in physical capital formation in 2016 was 59.2%. Personal consumption expenditure increased by 3.3%, while Government net current expenditure rose by 5.3%. Figure 4 shows the relative contributions of each of the components of expenditure.
Modified GNI
Modified GNI (GNI*) is a new indicator that was recommended by the Economic Statistics Review Group and is designed to exclude globalisation effects that are disproportionately impacting the measurement of the size of the Irish economy.
The new Annex 1 shows some of our main aggregates as well as Modified GNI, all at current market values. Also included are the three adjustments made to GNI to bring it to Modified GNI.
| X-axis label | GDP | GNI* | NNI |
|---|---|---|---|
| 2008 | 187.8 | 160.4 | 136.9 |
| 2009 | 170.1 | 138.5 | 118.1 |
| 2010 | 167.6 | 132.6 | 116.5 |
| 2011 | 171.9 | 131.3 | 115.6 |
| 2012 | 175.6 | 133.1 | 117.8 |
| 2013 | 180.3 | 143 | 126 |
| 2014 | 194.5 | 154.5 | 136.4 |
| 2015 | 262 | 172.9 | 150.5 |
| 2016 | 275.6 | 189.2 | 164.8 |
Figure 5 shows the values of GDP, Modified GNI (GNI*) and NNI at current prices. We can see that the step change in 2015 does not have the same effect on either Modified GNI or NNI as it does on GDP.
| X-axis label | Depreciation on R and D related IP imports | Factor Income of redomiciled companies | Depreciation on aircraft leasing | Gross National Income | Modified Gross National Income |
|---|---|---|---|---|---|
| 2008 | -0.1 | -0.3 | -1.8 | 162.6 | 160.4 |
| 2009 | -0.2 | -1.6 | -1.9 | 142.2 | 138.5 |
| 2010 | -0.3 | -5.3 | -2.2 | 140.4 | 132.6 |
| 2011 | -0.4 | -5.5 | -2.4 | 139.6 | 131.3 |
| 2012 | -0.6 | -7.1 | -2.7 | 143.4 | 133.1 |
| 2013 | -0.7 | -6.5 | -3 | 153.2 | 143 |
| 2014 | -0.8 | -6.9 | -3.8 | 165.9 | 154.5 |
| 2015 | -25 | -4.7 | -4.6 | 207.2 | 172.9 |
| 2016 | -27.8 | -5.8 | -5 | 227.7 | 189.2 |
Figure 6 shows the difference between GNI at current prices and Modified GNI at current prices as well as the adjustments. We can see that the series start to diverge in recent years in particular from 2015.
| Table A Main Aggregates, 2011-2016 | ||||||
| Description | 2011 | 2012 | 2013 | 2014 | 2015 | 2016 1 |
| € million | ||||||
| Gross Domestic Product (GDP) at current market prices | 171,939 | 175,561 | 180,298 | 194,537 | 262,037 | 275,567 |
| plus Net factor income from the rest of the world | -33,788 | -33,549 | -28,309 | -29,715 | -56,048 | -48,818 |
| Gross National Product (GNP) at current market prices | 138,151 | 142,012 | 151,990 | 164,822 | 205,990 | 226,749 |
| EU subsidies | 1,698 | 1,632 | 1,450 | 1,318 | 1,571 | 1,479 |
| EU taxes | -240 | -242 | -247 | -275 | -327 | -486 |
| Gross National Income (GNI) at current market prices | 139,610 | 143,402 | 153,193 | 165,866 | 207,234 | 227,742 |
| less provision for depreciation | -23,992 | -25,650 | -27,177 | -29,486 | -56,781 | -62,893 |
| less Non EU taxes | -17,779 | -18,359 | -19,302 | -21,210 | -22,525 | -23,431 |
| plus Non EU subsidies | 1,725 | 1,910 | 1,906 | 1,863 | 1,766 | 1,674 |
| Net National Product at factor cost | 99,563 | 101,303 | 108,620 | 117,033 | 129,694 | 143,093 |
| Gross National Disposable Income at current market prices | 136,968 | 140,808 | 150,284 | 163,136 | 203,910 | 224,115 |
| Chained linked volume measures referenced to year 2015 | € million | |||||
| Gross Domestic Product at constant market prices | 189,478 | 189,548 | 192,654 | 208,700 | 262,037 | 275,510 |
| Index of GDP at constant market prices | 72.3 | 72.3 | 73.5 | 79.6 | 100.0 | 105.1 |
| Gross National Product at constant market prices | 152,291 | 153,963 | 162,436 | 177,129 | 205,990 | 225,781 |
| Index of GNP at constant market prices | 73.9 | 74.7 | 78.9 | 86.0 | 100.0 | 109.6 |
| Gross National Income at constant market prices | 153,823 | 155,409 | 163,516 | 178,095 | 207,234 | 226,717 |
| Index of GNI at constant market prices | 74.2 | 75.0 | 78.9 | 85.9 | 100.0 | 109.4 |
| Gross national disposable income at constant market prices | 148,063 | 146,672 | 153,775 | 163,510 | 203,910 | 222,010 |
| Index of gross national disposable income at constant market prices | 72.6 | 71.9 | 75.4 | 80.2 | 100.0 | 108.9 |
| Per head of population | (€) | |||||
| GDP at current market prices | 37,583 | 38,287 | 39,254 | 42,203 | 56,530 | 58,961 |
| GNP at current market prices | 30,198 | 30,970 | 33,091 | 35,756 | 44,438 | 48,516 |
| GNI at current market prices | 30,516 | 31,274 | 33,353 | 35,983 | 44,707 | 48,728 |
| GNDI at current market prices | 29,939 | 30,708 | 32,720 | 35,391 | 43,990 | 47,952 |
| Net national product at factor cost | 21,763 | 22,093 | 23,648 | 25,389 | 27,979 | 30,617 |
| GDP at constant market prices | 41,417 | 41,337 | 41,944 | 45,275 | 56,530 | 58,949 |
| GNP at constant market prices | 33,288 | 33,577 | 35,365 | 38,426 | 44,438 | 48,309 |
| GNI at constant market prices | 33,623 | 33,892 | 35,600 | 38,636 | 44,707 | 48,509 |
| GNDI at constant market prices | 32,364 | 31,987 | 33,480 | 35,472 | 43,990 | 47,502 |
| Per person in employment 2 | (€) | |||||
| GDP at current market prices | 92,376 | 95,611 | 96,421 | 102,302 | 133,781 | 136,765 |
| GNP at current market prices | 74,223 | 77,340 | 81,282 | 86,676 | 105,166 | 112,536 |
| GNI at current market prices | 75,006 | 78,097 | 81,926 | 87,224 | 105,802 | 113,029 |
| GNDI at current market prices | 73,588 | 76,684 | 80,370 | 85,789 | 104,105 | 111,229 |
| Net national product at factor cost | 53,491 | 55,170 | 58,089 | 61,544 | 66,214 | 71,017 |
| GDP at constant market prices | 101,799 | 103,228 | 103,029 | 109,749 | 133,781 | 136,736 |
| GNP at constant market prices | 81,820 | 83,849 | 86,869 | 93,147 | 105,166 | 112,056 |
| GNI at constant market prices | 82,643 | 84,636 | 87,446 | 93,655 | 105,802 | 112,520 |
| GNDI at constant market prices | 79,548 | 79,878 | 82,237 | 85,986 | 104,105 | 110,184 |
| 1Preliminary | ||||||
| 2 Persons in employment on an ILO basis as in the QNHS (April-June) for 2011 to 2016 | ||||||
| Table B Annual Percentage Changes in the Main Aggregates, Deflators and the Consumer Price Index | ||||||
| Description | 2011-2016 | 2011-2012 | 2012-2013 | 2013-2014 | 2014-2015 | 2015-2016 |
| Gross Domestic Product (GDP) at current market prices | 9.9 | 2.1 | 2.7 | 7.9 | 34.7 | 5.2 |
| Gross National Product (GNP) at current market prices | 10.4 | 2.8 | 7.0 | 8.4 | 25.0 | 10.1 |
| Gross National Income (GNI) at current market prices | 10.3 | 2.7 | 6.8 | 8.3 | 24.9 | 9.9 |
| Gross National Disposable Income (GNDI) at current market prices | 10.3 | 2.8 | 6.7 | 8.6 | 25.0 | 9.9 |
| Net national product at factor cost | 7.5 | 1.7 | 7.2 | 7.7 | 10.8 | 10.3 |
| Chain linked volume measures referenced to year 2015 | ||||||
| Gross Domestic Product at constant market prices | 7.8 | 0.0 | 1.6 | 8.3 | 25.6 | 5.1 |
| Gross National Product at constant market prices | 8.2 | 1.1 | 5.5 | 9.0 | 16.3 | 9.6 |
| Gross National Income at constant market prices | 8.1 | 1.0 | 5.2 | 8.9 | 16.4 | 9.4 |
| Gross National Disposable Income at constant market prices | 8.4 | -0.9 | 4.8 | 6.3 | 24.7 | 8.9 |
| GDP deflator | 2.0 | 2.1 | 1.0 | -0.4 | 7.3 | 0.0 |
| GNP deflator | 2.1 | 1.7 | 1.4 | -0.6 | 7.5 | 0.4 |
| GNI deflator | 2.0 | 1.7 | 1.5 | -0.6 | 7.4 | 0.5 |
| GNDI deflator | 1.8 | 3.8 | 1.8 | 2.1 | 0.2 | 0.9 |
| Consumer price index | 0.4 | 1.7 | 0.5 | 0.2 | -0.3 | 0.0 |
| Table 1 Net Value Added at Factor Cost and Net National Income at Market Prices | |||||||
| € million | |||||||
| Description | ESA Code | 2011 | 2012 | 2013 | 2014 | 2015 | 2016 1 |
| Value added from agriculture, forestry and fishing | (B.1n-D.29+D.39) Pt | 3,088 | 2,900 | 2,977 | 3,255 | 3,181 | 3,234 |
| 1. Income from self-employment and other trading income | B.3n (Pt) | 2,465 | 2,276 | 2,288 | 2,528 | 2,512 | 2,550 |
| Remuneration of employees: | D.1 (Pt) | ||||||
| 2. Wages and salaries | (D.11+D.12) Pt | 570 | 571 | 635 | 670 | 612 | 625 |
| 3. Employers' contribution to social insurance | D.12 (Pt) | 52 | 53 | 54 | 56 | 57 | 59 |
| Non-agricultural value added | (B.1n-D.29+D.39) Pt | 129,847 | 131,330 | 135,284 | 145,069 | 182,682 | 188,589 |
| Profits and self employed earnings: | |||||||
| 4. Domestic trading profits of companies (including corporate bodies) before tax | B.2n (Pt) | 46,583 | 47,373 | 49,768 | 56,703 | 90,242 | 89,733 |
| 5. Self employed earnings | B.3n (Pt) | 7,159 | 6,867 | 7,027 | 7,252 | 7,545 | 7,565 |
| of which: | |||||||
| 5(a) Withdrawals from quasi-corporations2 | D.422 | 748 | 792 | 764 | 762 | 791 | 735 |
| 6. Adjustment for stock appreciation | B.2n (Pt) | -226 | 489 | 649 | 364 | -334 | 1,097 |
| 7. Rent of dwellings (actual and imputed) | B.2n (Pt) | 7,094 | 7,616 | 7,729 | 8,234 | 9,089 | 9,934 |
| of which imputed rent | 5,319 | 5,680 | 5,754 | 6,125 | 6,744 | 7,246 | |
| 8. Rent element in land annuities | 0 | 1 | 0 | 0 | 0 | 0 | |
| Remuneration of employees: | D.1 (Pt) | ||||||
| 9. Wages and salaries | (D.11+D.12) Pt | 63,923 | 64,028 | 64,838 | 66,756 | 69,985 | 73,667 |
| 10. Employers' contribution to social insurance | D.12 (Pt) | 5,313 | 4,956 | 5,272 | 5,761 | 6,155 | 6,594 |
| Adjustments: | |||||||
| 12. Statistical discrepancy | 417 | 623 | -1,332 | -1,576 | -121 | 89 | |
| 13. Net value added at factor cost | (B.1n-D.29+D.39) | 133,352 | 134,853 | 136,929 | 146,748 | 185,741 | 191,912 |
| 14. Net factor income from the rest of the world | D.1 & D.4 | -33,788 | -33,549 | -28,309 | -29,715 | -56,048 | -48,818 |
| (net to abroad) | |||||||
| 15. Net national product at factor cost | 99,564 | 101,304 | 108,620 | 117,033 | 129,694 | 143,093 | |
| 16. National (i.e. non EU) taxes | D.2 (Pt) | 17,779 | 18,359 | 19,302 | 21,210 | 22,525 | 23,431 |
| 17. National (i.e. non EU) subsidies | D.3 (Pt) | -1,725 | -1,910 | -1,906 | -1,863 | -1,766 | -1,674 |
| 18. Net national income at market prices | B.5*n | 115,618 | 117,753 | 126,016 | 136,380 | 150,452 | 164,850 |
| 1Preliminary | |||||||
| 2 This represents the earnings of the owners of large non incorporated businesses (e.g. large partnerships) which are similar in their economic and financial behaviour to companies of an equivalent size. | |||||||
| Table 1.1 Annual Percentage Changes in the Main Constituents of Table 1 | |||||||
| Description | ESA Code | 2011-2016 | 2011-2012 | 2012-2013 | 2013-2014 | 2014-2015 | 2015-2016 |
| Value added from agriculture, forestry and fishing | (B.1n-D.29+D.39) Pt | 0.9 | -6.1 | 2.7 | 9.3 | -2.3 | 1.7 |
| Income from self-employment and other trading income | B.3n (Pt) | 0.7 | -7.7 | 0.5 | 10.5 | -0.6 | 1.5 |
| Remuneration of employees | D.1 (Pt) | 1.9 | 0.3 | 10.5 | 5.4 | -8.0 | 2.3 |
| Non-agricultural value added | (B.1n-D.29+D.39) Pt | 7.7 | 1.1 | 3.0 | 7.2 | 25.9 | 3.2 |
| Profits etc.1 | B.2n (Pt) & B.3n (Pt) | 12.3 | 2.9 | 4.5 | 11.3 | 46.8 | 1.7 |
| Remuneration of employees | D.1 (Pt) | 3.0 | -0.4 | 1.6 | 3.4 | 5.0 | 5.4 |
| Net national product at factor cost | 7.5 | 1.7 | 7.2 | 7.7 | 10.8 | 10.3 | |
| Net national income at market prices | B.5*n | 7.4 | 1.8 | 7.0 | 8.2 | 10.3 | 9.6 |
| 1 i.e. Items 4 to 8 in Table 1 | |||||||
| Table 2 Net Value Added at Factor Cost and Depreciation by Sector of Origin and Gross Value Added at Basic Prices | |||||||
| (Note the sectors here are based on NACE Rev. 2 A10. For further details see the methodology notes) | |||||||
| € million | |||||||
| Description | ESA Code | 2011 | 2012 | 2013 | 2014 | 2015 | 2016 1 |
| 24.1 Agriculture forestry and fishing | |||||||
| Net value added | (B.1n-D.29+D.39) Pt | 3,088 | 2,901 | 2,977 | 3,255 | 3,181 | 3,234 |
| Remuneration of employees | D.1 (Pt) | 622 | 624 | 689 | 726 | 669 | 684 |
| Other | (B.2n & B.3n) Pt | 2,466 | 2,277 | 2,288 | 2,529 | 2,512 | 2,550 |
| 24.2 Industry (excluding construction) | |||||||
| Net value added | (B.1n-D.29+D.39) Pt | 34,502 | 33,754 | 33,680 | 36,074 | 63,078 | 59,325 |
| Remuneration of employees | D.1 (Pt) | 10,570 | 10,402 | 10,857 | 11,179 | 11,895 | 12,570 |
| Other | (B.2n & B.3n) Pt | 24,173 | 22,865 | 22,547 | 25,152 | 51,864 | 45,977 |
| Adjustment for stock appreciation | (B.2n & B.3n) Pt | -241 | 488 | 277 | -256 | -681 | 778 |
| 24.3 of which: Manufacturing | |||||||
| Net value added | (B.1n-D.29+D.39) Pt | 32,031 | 30,847 | 30,737 | 33,284 | 60,842 | 56,888 |
| Remuneration of employees | D.1 (Pt) | 9,135 | 8,972 | 9,464 | 9,774 | 10,437 | 11,109 |
| Other | (B.2n & B.3n) Pt | 23,137 | 21,391 | 20,995 | 23,769 | 51,085 | 44,992 |
| Adjustment for stock appreciation | (B.2n & B.3n) Pt | -241 | 484 | 278 | -258 | -680 | 786 |
| 24.4 Construction | |||||||
| Net value added | (B.1n-D.29+D.39) Pt | 2,193 | 3,297 | 4,225 | 5,478 | 5,900 | 6,775 |
| Remuneration of employees | D.1 (Pt) | 3,323 | 3,064 | 3,173 | 3,608 | 4,031 | 4,687 |
| Other | (B.2n & B.3n) Pt | -1,130 | 233 | 1,052 | 1,870 | 1,868 | 2,088 |
| 24.5 Distribution, transport, hotels and restaurants | |||||||
| Net value added | (B.1n-D.29+D.39) Pt | 21,606 | 22,235 | 24,567 | 24,817 | 26,455 | 27,786 |
| Remuneration of employees | D.1 (Pt) | 14,122 | 14,305 | 14,591 | 15,024 | 15,773 | 17,003 |
| Other | (B.2n & B.3n) Pt | 7,469 | 7,928 | 9,603 | 9,173 | 10,335 | 10,464 |
| Adjustment for stock appreciation | (B.2n & B.3n) Pt | 15 | 1 | 373 | 620 | 347 | 319 |
| 24.6. Information and communication | |||||||
| Net value added | (B.1n-D.29+D.39) Pt | 11,248 | 12,171 | 12,893 | 14,930 | 16,611 | 18,849 |
| Remuneration of employees | D.1 (Pt) | 3,568 | 3,922 | 4,145 | 4,278 | 4,768 | 5,019 |
| Other | (B.2n & B.3n) Pt | 7,680 | 8,250 | 8,748 | 10,653 | 11,843 | 13,830 |
| 24.7 Financial and insurance activities | |||||||
| Net value added | (B.1n-D.29+D.39) Pt | 14,308 | 13,649 | 12,246 | 13,621 | 15,123 | 16,041 |
| Remuneration of employees | D.1 (Pt) | 6,250 | 6,403 | 6,180 | 6,226 | 6,049 | 6,186 |
| Other | (B.2n & B.3n) Pt | 8,058 | 7,245 | 6,066 | 7,395 | 9,074 | 9,854 |
| 24.8 Real estate activities | |||||||
| Net value added | (B.1n-D.29+D.39) Pt | 6,779 | 7,586 | 7,946 | 8,646 | 9,393 | 10,344 |
| Remuneration of employees | D.1 (Pt) | 302 | 304 | 355 | 426 | 470 | 536 |
| Other | (B.2n & B.3n) Pt | 6,478 | 7,282 | 7,591 | 8,220 | 8,923 | 9,808 |
| 24.9 Professional, admin and support services | |||||||
| Net value added | (B.1n-D.29+D.39) Pt | 11,239 | 11,160 | 12,193 | 13,762 | 17,651 | 20,378 |
| Remuneration of employees | D.1 (Pt) | 6,000 | 5,905 | 6,239 | 7,004 | 7,572 | 8,255 |
| Other | (B.2n & B.3n) Pt | 5,239 | 5,255 | 5,954 | 6,758 | 10,079 | 12,123 |
| 24.10 Public admin, education and health | |||||||
| Net value added | (B.1n-D.29+D.39) Pt | 25,414 | 25,036 | 24,995 | 25,100 | 25,904 | 26,410 |
| Remuneration of employees | D.1 (Pt) | 23,654 | 23,230 | 23,163 | 23,273 | 24,054 | 24,406 |
| Other | (B.2n & B.3n) Pt | 1,760 | 1,806 | 1,832 | 1,827 | 1,850 | 2,003 |
| 24.11 Arts, entertainment and other services | |||||||
| Net value added | (B.1n-D.29+D.39) Pt | 2,557 | 2,440 | 2,538 | 2,641 | 2,566 | 2,682 |
| Remuneration of employees | D.1 (Pt) | 1,446 | 1,447 | 1,407 | 1,499 | 1,526 | 1,597 |
| Other | (B.2n & B.3n) Pt | 1,111 | 993 | 1,132 | 1,141 | 1,040 | 1,085 |
| 26. Statistical discrepancy (equals Item 12, Table 1) | 417 | 623 | -1,332 | -1,576 | -121 | 89 | |
| 27. Net value added at factor cost | B.1n-D.29+D.39 | 133,352 | 134,853 | 136,929 | 146,748 | 185,741 | 191,912 |
| 28. plus Provision for depreciation | P.51c | 23,992 | 25,650 | 27,177 | 29,486 | 56,781 | 62,893 |
| 28.1 Agriculture, forestry and fishing | P.51c | 757 | 753 | 766 | 816 | 855 | 859 |
| 28.2 Industry (excluding construction) | P.51c | 6,025 | 6,214 | 6,361 | 6,506 | 30,525 | 33,204 |
| 28.3 of which Manufacturing | P.51c | 4,521 | 4,640 | 4,738 | 4,828 | 28,778 | 31,395 |
| 28.4 Construction | P.51c | 376 | 327 | 289 | 268 | 250 | 239 |
| 28.5 Distribution, transport, hotels and restaurants | P.51c | 3,299 | 3,425 | 3,494 | 3,580 | 3,695 | 3,858 |
| 28.6 Information and communication | P.51c | 2,413 | 2,989 | 3,435 | 3,869 | 4,797 | 5,955 |
| 28.7 Financial and insurance activities | P.51c | 810 | 798 | 800 | 865 | 963 | 1,101 |
| 28.8 Real estate activities | P.51c | 3,667 | 3,780 | 3,977 | 4,357 | 4,544 | 4,880 |
| 28.9 Professional, admin and support services | P.51c | 3,595 | 4,213 | 4,846 | 5,876 | 7,595 | 9,012 |
| 28.10 Public admin, education and health | P.51c | 2,634 | 2,737 | 2,804 | 2,924 | 3,117 | 3,344 |
| 28.11 Arts, entertainment and other services | P.51c | 414 | 413 | 404 | 425 | 440 | 440 |
| 29. Gross value added at factor cost | B.1g-D.29+D.39 | 157,343 | 160,503 | 164,106 | 176,234 | 242,523 | 254,805 |
| 30. Non product taxes | D.29 | 2,074 | 2,259 | 2,553 | 2,973 | 3,084 | 2,833 |
| 31. Non product subsidies | D.39 | -2,335 | -2,454 | -2,277 | -2,200 | -2,426 | -2,279 |
| 32. Gross value added at basic prices | B.1g | 157,082 | 160,309 | 164,382 | 177,007 | 243,181 | 255,358 |
| 1Preliminary | |||||||
| Table 3 Gross Value Added at Basic Prices by Sector of Origin and Gross National Income at Current Market Prices | |||||||
| (Note the sectors here are based on NACE Rev. 2 A10 breakdown. For further details see the methodology notes) | |||||||
| € million | |||||||
| Description | ESA Code | 2011 | 2012 | 2013 | 2014 | 2015 | 2016 1 |
| 46.1 Agriculture, forestry and fishing | (B.1g-D.29+D.39) Pt | 2,079 | 1,741 | 2,027 | 2,505 | 2,340 | 2,548 |
| 46.2 Industry (excluding construction) | (B.1g-D.29+D.39) Pt | 41,314 | 40,774 | 40,866 | 43,419 | 94,454 | 93,318 |
| 46.3 of which: Manufacturing | (B.1g-D.29+D.39) Pt | 36,838 | 35,771 | 35,768 | 38,414 | 89,928 | 88,566 |
| 46.4 Construction | (B.1g-D.29+D.39) Pt | 2,595 | 3,651 | 4,543 | 5,775 | 6,179 | 7,040 |
| 46.5 Distribution, transport, hotels and restaurants | (B.1g-D.29+D.39) Pt | 25,369 | 26,134 | 28,557 | 28,909 | 30,669 | 32,118 |
| 46.6 Information and communication | (B.1g-D.29+D.39) Pt | 13,777 | 15,276 | 16,446 | 18,921 | 21,533 | 24,918 |
| 46.7 Financial and insurance activities | (B.1g-D.29+D.39) Pt | 15,116 | 14,519 | 13,137 | 14,731 | 16,393 | 17,346 |
| 46.8 Real estate activities | (B.1g-D.29+D.39) Pt | 10,640 | 11,687 | 12,442 | 13,647 | 14,491 | 15,756 |
| 46.9 Professional, admin and support services | (B.1g-D.29+D.39) Pt | 14,787 | 15,300 | 16,974 | 19,600 | 25,213 | 29,356 |
| 46.10 Public administration, education and health | (B.1g-D.29+D.39) Pt | 27,996 | 27,733 | 27,759 | 27,985 | 28,978 | 29,711 |
| 46.11 Arts, entertainment and other services | (B.1g-D.29+D.39) Pt | 2,990 | 2,872 | 2,964 | 3,091 | 3,051 | 3,158 |
| 47. Statistical discrepancy (equals Item 12, Table 1) | 417 | 623 | -1,332 | -1,576 | -121 | 89 | |
| 51. Gross value added at basic prices | B.1g | 157,082 | 160,308 | 164,382 | 177,007 | 243,181 | 255,358 |
| 52. Product taxes | D.21 | 15,945 | 16,341 | 16,996 | 18,511 | 19,768 | 21,083 |
| 53. Product subsidies | D.31 | -1,088 | -1,089 | -1,079 | -981 | -911 | -874 |
| 54. Gross domestic product at current market prices | B.1*g | 171,939 | 175,561 | 180,298 | 194,537 | 262,037 | 275,567 |
| 55. Net factor income from the rest of the world | D.1 & D.4 | -33,788 | -33,549 | -28,309 | -29,715 | -56,048 | -48,818 |
| (net to abroad) | |||||||
| 56. Gross national product at current market prices | 138,151 | 142,012 | 151,990 | 164,822 | 205,990 | 226,749 | |
| 57. EU subsidies | D.3 (Pt) | 1,698 | 1,632 | 1,450 | 1,318 | 1,571 | 1,479 |
| 58. EU taxes | D.2 (Pt) | -240 | -242 | -247 | -275 | -327 | -486 |
| 59. Gross national income at current market prices | B.5*g | 139,610 | 143,402 | 153,193 | 165,866 | 207,234 | 227,742 |
| 1Preliminary | |||||||
| Table 3.1 Annual Percentage Change in the Main Constituents of Table 3 | |||||||
| Description | ESA Code | 2011-2016 | 2011-2012 | 2012-2013 | 2013-2014 | 2014-2015 | 2015-2016 |
| Agriculture, forestry and fishing | (B.1g-D.29+D.39) Pt | 4.2 | -16.3 | 16.4 | 23.6 | -6.6 | 8.9 |
| Industry (excluding construction) | (B.1g-D.29+D.39) Pt | 17.7 | -1.3 | 0.2 | 6.2 | 117.5 | -1.2 |
| of which: Manufacturing | (B.1g-D.29+D.39) Pt | 19.2 | -2.9 | -0.0 | 7.4 | 134.1 | -1.5 |
| Construction | (B.1g-D.29+D.39) Pt | 22.1 | 40.7 | 24.4 | 27.1 | 7.0 | 13.9 |
| Distribution, transport, hotels and restaurants | (B.1g-D.29+D.39) Pt | 4.8 | 3.0 | 9.3 | 1.2 | 6.1 | 4.7 |
| Information and communication | (B.1g-D.29+D.39) Pt | 12.6 | 10.9 | 7.7 | 15.0 | 13.8 | 15.7 |
| Financial and insurance activities | (B.1g-D.29+D.39) Pt | 2.8 | -4.0 | -9.5 | 12.1 | 11.3 | 5.8 |
| Real estate activities | (B.1g-D.29+D.39) Pt | 8.2 | 9.8 | 6.5 | 9.7 | 6.2 | 8.7 |
| Professional, administration and support services | (B.1g-D.29+D.39) Pt | 14.7 | 3.5 | 10.9 | 15.5 | 28.6 | 16.4 |
| Public administration, education and health | (B.1g-D.29+D.39) Pt | 1.2 | -0.9 | 0.1 | 0.8 | 3.5 | 2.5 |
| Arts, entertainment and other services | (B.1g-D.29+D.39) Pt | 1.1 | -4.0 | 3.2 | 4.3 | -1.3 | 3.5 |
| Gross value added at basic prices | B.1g | 10.2 | 2.1 | 2.5 | 7.7 | 37.4 | 5.0 |
| Gross domestic product at current market prices | B.1*g | 9.9 | 2.1 | 2.7 | 7.9 | 34.7 | 5.2 |
| Gross national product at current market prices | 10.4 | 2.8 | 7.0 | 8.4 | 25.0 | 10.1 | |
| Gross national income at current market prices | B.5*g | 10.3 | 2.7 | 6.8 | 8.3 | 24.9 | 9.9 |
| Table 4 Gross Value Added at Constant Basic Prices by Sector of Origin and Gross National Income at Constant Market Prices (chain linked annually and referenced to year 2015) | |||||||
| (Note the sectors here are the NACE Rev. 2 A10 breakdown. For further details see the methodology notes) | |||||||
| € million | |||||||
| Description | ESA Code | 2011 | 2012 | 2013 | 2014 | 2015 | 2016 1 |
| 65.1 Agriculture, forestry and fishing | 1,936 | 1,645 | 1,779 | 2,229 | 2,340 | 2,644 | |
| 65.2 Industry (excluding construction) | (B.1g-D.29+D.39) Pt | 50,080 | 49,322 | 47,970 | 51,667 | 94,454 | 96,918 |
| 65.3 of which: Manufacturing | (B.1g-D.29+D.39) Pt | 45,231 | 44,517 | 43,001 | 46,387 | 89,928 | 92,364 |
| 65.4 Construction | (B.1g-D.29+D.39) Pt | 5,332 | 5,136 | 5,516 | 5,833 | 6,179 | 7,109 |
| 65.5 Distribution, transport, hotels and restaurants | (B.1g-D.29+D.39) Pt | 27,130 | 26,978 | 27,416 | 28,884 | 30,669 | 32,259 |
| 65.6 Information and communication | (B.1g-D.29+D.39) Pt | 14,351 | 14,938 | 16,563 | 19,181 | 21,533 | 23,647 |
| 65.7 Financial and insurance activities | (B.1g-D.29+D.39) Pt | 16,724 | 14,961 | 14,269 | 15,186 | 16,393 | 16,944 |
| 65.8 Real estate activities | (B.1g-D.29+D.39) Pt | 13,067 | 13,467 | 13,927 | 14,491 | 14,491 | 14,637 |
| 65.9 Professional, administration and support services | (B.1g-D.29+D.39) Pt | 16,464 | 16,468 | 18,118 | 20,674 | 25,213 | 28,849 |
| 65.10 Public administration, education and health | (B.1g-D.29+D.39) Pt | 27,359 | 26,934 | 27,546 | 27,910 | 28,978 | 29,433 |
| 65.11 Arts, entertainment and other services | (B.1g-D.29+D.39) Pt | 2,774 | 2,824 | 2,834 | 2,933 | 3,051 | 3,359 |
| 66. Statistical discrepancy | .. | .. | .. | .. | -121 | -504 | |
| 70. Gross value added at constant basic prices | B.1g | 173,995 | 174,087 | 176,541 | 191,029 | 243,181 | 255,294 |
| 71. Product taxes | D.21 | 16,401 | 16,366 | 16,978 | 18,456 | 19,768 | 21,082 |
| 72. Product subsidies | D.31 | -1,056 | -1,041 | -1,035 | -991 | -911 | -866 |
| 73. Gross domestic product at constant market prices | B.1*g | 189,478 | 189,548 | 192,654 | 208,700 | 262,037 | 275,510 |
| 74. Net factor income from the rest of the world | D.1 & D.4 | -37,148 | -35,551 | -30,318 | -31,676 | -56,048 | -49,729 |
| (net to abroad) | |||||||
| 75. Gross national product at constant market prices | 152,291 | 153,963 | 162,436 | 177,129 | 205,990 | 225,781 | |
| 76. EU subsidies | D.3 (Pt) | 1,722 | 1,641 | 1,309 | 1,252 | 1,571 | 1,422 |
| 77. EU taxes | D.2 (Pt) | -246 | -243 | -247 | -274 | -327 | -485 |
| 78. Gross national income at constant market prices | B.5*g | 153,823 | 155,409 | 163,516 | 178,095 | 207,234 | 226,717 |
| 1Preliminary | |||||||
| ..Chain linked series not additive except for 2015 and 2016 | |||||||
| Table 4.1 Annual Percentage Changes in the Main Constituents of Table 4 | |||||||
| Description | ESA Code | 2011-2016 | 2011-2012 | 2012-2013 | 2013-2014 | 2014-2015 | 2015-2016 |
| Agriculture, forestry and fishing | (B.1g-D.29+D.39) Pt | 6.4 | -15.1 | 8.2 | 25.3 | 5.0 | 13.0 |
| Industry (excluding construction) | (B.1g-D.29+D.39) Pt | 14.1 | -1.5 | -2.7 | 7.7 | 82.8 | 2.6 |
| of which: Manufacturing | (B.1g-D.29+D.39) Pt | 15.3 | -1.6 | -3.4 | 7.9 | 93.9 | 2.7 |
| Construction | (B.1g-D.29+D.39) Pt | 5.9 | -3.7 | 7.4 | 5.7 | 5.9 | 15.1 |
| Distribution, transport, hotels and restaurants | (B.1g-D.29+D.39) Pt | 3.5 | -0.6 | 1.6 | 5.4 | 6.2 | 5.2 |
| Information and communication | (B.1g-D.29+D.39) Pt | 10.5 | 4.1 | 10.9 | 15.8 | 12.3 | 9.8 |
| Financial and insurance activities | (B.1g-D.29+D.39) Pt | 0.3 | -10.5 | -4.6 | 6.4 | 7.9 | 3.4 |
| Real estate activities | (B.1g-D.29+D.39) Pt | 2.3 | 3.1 | 3.4 | 4.0 | -0.0 | 1.0 |
| Professional, administration and support services | (B.1g-D.29+D.39) Pt | 11.9 | 0.0 | 10.0 | 14.1 | 22.0 | 14.4 |
| Public administration, education and health | (B.1g-D.29+D.39) Pt | 1.5 | -1.6 | 2.3 | 1.3 | 3.8 | 1.6 |
| Arts, entertainment and other services | (B.1g-D.29+D.39) Pt | 3.9 | 1.8 | 0.4 | 3.5 | 4.0 | 10.1 |
| Gross value added at constant basic prices | B.1g | 8.0 | 0.1 | 1.4 | 8.2 | 27.3 | 5.0 |
| Gross domestic product at constant market prices | B.1*g | 7.8 | 0.0 | 1.6 | 8.3 | 25.6 | 5.1 |
| Gross national product at constant market prices | 8.2 | 1.1 | 5.5 | 9.0 | 16.3 | 9.6 | |
| Gross national income at constant market prices | B.5*g | 8.1 | 1.0 | 5.2 | 8.9 | 16.4 | 9.4 |
| Table 5 Expenditure on Gross National Income at Current Market Prices | |||||||
| € million | |||||||
| Description | ESA Code | 2011 | 2012 | 2013 | 2014 | 2015 | 2016 1 |
| 79. Personal consumption of goods and services | P.3 (Pt) | 84,209 | 84,797 | 85,784 | 88,535 | 92,721 | 96,613 |
| of which: | |||||||
| 79(a) Final consumption expenditure of Households and NPISHs | 79,251 | 79,578 | 80,798 | 83,433 | 87,326 | 90,847 | |
| 79(b) Final consumption expenditure of government | 4,958 | 5,219 | 4,986 | 5,102 | 5,394 | 5,767 | |
| 80. Net expenditure by central and local government on current goods and services | P.3 (Pt) | 26,370 | 25,745 | 25,471 | 26,244 | 26,953 | 28,354 |
| 81. Gross domestic fixed capital formation | P.51 (Pt) & P.53 | 28,813 | 34,452 | 33,627 | 40,420 | 53,160 | 87,662 |
| 82. Value of physical changes in stocks | P.51 (Pt) & P.52 | 803 | 1,045 | 216 | 3,160 | 2,353 | 2,383 |
| of which | |||||||
| 82(a) Net additions to the breeding stocks | 19 | 83 | -20 | 1 | 128 | 35 | |
| 83. Exports of goods and services 2 | P.6 | 177,303 | 187,658 | 191,185 | 219,786 | 326,610 | 335,041 |
| 84. Imports of goods and services 2 | P.7 | -145,143 | -157,512 | -157,315 | -185,184 | -239,880 | -274,398 |
| 85. Statistical discrepancy (equals -Item 12, Table 1) | -417 | -623 | 1,332 | 1,576 | 121 | -89 | |
| 86. Gross domestic product at current market prices | B.1*g | 171,939 | 175,561 | 180,298 | 194,537 | 262,037 | 275,567 |
| 87. Net factor income from the rest of the world | D.1 & D.4 | -33,788 | -33,549 | -28,309 | -29,715 | -56,048 | -48,818 |
| (net to abroad) | |||||||
| 88. Gross national product at current market prices | 138,151 | 142,012 | 151,990 | 164,822 | 205,990 | 226,749 | |
| 89. EU subsidies | D.3 (Pt) | 1,698 | 1,632 | 1,450 | 1,318 | 1,571 | 1,479 |
| 90. EU taxes | D.2 (Pt) | -240 | -242 | -247 | -275 | -327 | -486 |
| 91. Gross national income at current market prices | B.5*g | 139,610 | 143,402 | 153,193 | 165,866 | 207,234 | 227,742 |
| 1Preliminary | |||||||
| 2Excluding factor income flows | |||||||
| Table 5.1 Annual Percentage Changes in the Main Constituents of Table 5 | |||||||
| Description | ESA Code | 2011-2016 | 2011-2012 | 2012-2013 | 2013-2014 | 2014-2015 | 2015-2016 |
| Personal consumption of goods and services | P.3 (Pt) | 2.8 | 0.7 | 1.2 | 3.2 | 4.7 | 4.2 |
| Net expenditure by central and local government on current goods and services | P.3 (Pt) | 1.5 | -2.4 | -1.1 | 3.0 | 2.7 | 5.2 |
| Gross domestic physical capital formation | P.5 | 24.9 | 19.9 | -4.7 | 28.8 | 27.4 | 62.2 |
| of which | |||||||
| Gross domestic fixed capital formation | P.51 (Pt) & P.53 | 24.9 | 19.6 | -2.4 | 20.2 | 31.5 | 64.9 |
| Exports of goods and services | P.6 | 13.6 | 5.8 | 1.9 | 15.0 | 48.6 | 2.6 |
| Imports of goods and services | P.7 | 13.6 | 8.5 | -0.1 | 17.7 | 29.5 | 14.4 |
| Gross domestic product at current market prices | B.1*g | 9.9 | 2.1 | 2.7 | 7.9 | 34.7 | 5.2 |
| Gross national product at current market prices | 10.4 | 2.8 | 7.0 | 8.4 | 25.0 | 10.1 | |
| Gross national income at current market prices | B.5*g | 10.3 | 2.7 | 6.8 | 8.3 | 24.9 | 9.9 |
| Table 6 Expenditure on Gross National Income at Constant Market Prices (chain linked annually and referenced to year 2015) | |||||||
| € million | |||||||
| Description | ESA Code | 2011 | 2012 | 2013 | 2014 | 2015 | 2016 1 |
| 92. Personal consumption of goods and services | P.3 (Pt) | 88,620 | 87,837 | 87,240 | 88,989 | 92,721 | 95,743 |
| of which: | |||||||
| 92(a). Final consumption expenditure of Households and NPISHs | 83,228 | 82,258 | 82,084 | 83,795 | 87,326 | 90,092 | |
| 92(b). Final consumption expenditure of government | 5,399 | 5,595 | 5,158 | 5,195 | 5,394 | 5,651 | |
| 93. Net expenditure by central and local government on current goods and services | P.3 (Pt) | 26,144 | 25,160 | 25,262 | 26,465 | 26,953 | 28,378 |
| 94. Gross domestic fixed capital formation | P.51 (Pt) & P.53 | 31,385 | 36,530 | 35,190 | 41,560 | 53,160 | 85,674 |
| 95. Value of physical changes in stocks | P.51 (Pt) & P.52 | 617 | 810 | 214 | 3,198 | 2,353 | 2,682 |
| of which: | |||||||
| 95(a). Net additions to the breeding stocks | 9 | 35 | -9 | 1 | 128 | 42 | |
| 96. Exports of goods and services2 | P.6 | 197,031 | 200,145 | 206,242 | 236,004 | 326,610 | 341,676 |
| 97. Imports of goods and services2 | P.7 | -160,294 | -164,309 | -165,725 | -190,355 | -239,880 | -279,148 |
| 98. Statistical discrepancy (equals -item 66, Table 4) | .. | .. | .. | .. | 121 | 504 | |
| 99. Gross domestic product at constant market prices | B.1*g | 189,478 | 189,548 | 192,654 | 208,700 | 262,037 | 275,510 |
| 100. Net factor income from the rest of the world | D.1 & D.4 | -37,148 | -35,551 | -30,318 | -31,676 | -56,048 | -49,729 |
| (net to abroad) | |||||||
| 101. Gross national product at constant market prices | 152,291 | 153,963 | 162,436 | 177,129 | 205,990 | 225,781 | |
| 102. EU subsidies | D.3 (Pt) | 1,722 | 1,641 | 1,309 | 1,252 | 1,571 | 1,422 |
| 103. EU Taxes | D.2 (Pt) | -246 | -243 | -247 | -274 | -327 | -485 |
| 104. Gross national income at constant market prices | B.5*g | 153,823 | 155,409 | 163,516 | 178,095 | 207,234 | 226,717 |
| 1Preliminary | |||||||
| 2Excluding factor income flows | |||||||
| ..Chain linked series not additive except for 2015 and 2016 | |||||||
| Table 6.1 Annual Percentage Changes in the Main Constituents of Table 6 | |||||||
| Description | ESA Code | 2011-2016 | 2011-2012 | 2012-2013 | 2013-2014 | 2014-2015 | 2015-2016 |
| Personal consumption of goods and services | P.3 (Pt) | 1.6 | -0.9 | -0.7 | 2.0 | 4.2 | 3.3 |
| Net expenditure by central and local government on current goods and services | P.3 (Pt) | 1.7 | -3.8 | 0.4 | 4.8 | 1.8 | 5.3 |
| Gross domestic physical capital formation | P.5 | 22.5 | 16.7 | -5.2 | 26.4 | 24.0 | 59.2 |
| of which | |||||||
| Gross domestic fixed capital formation | P.51 (Pt) & P.53 | 22.2 | 16.4 | -3.7 | 18.1 | 27.9 | 61.2 |
| Exports of goods and services | P.6 | 11.6 | 1.6 | 3.0 | 14.4 | 38.4 | 4.6 |
| Imports of goods and services | P.7 | 11.7 | 2.5 | 0.9 | 14.9 | 26.0 | 16.4 |
| Gross domestic product at constant market prices | B.1*g | 7.8 | 0.0 | 1.6 | 8.3 | 25.6 | 5.1 |
| Gross national product at constant market prices | 8.2 | 1.1 | 5.5 | 9.0 | 16.3 | 9.6 | |
| Gross national income at constant market prices | B.5*g | 8.1 | 1.0 | 5.2 | 8.9 | 16.4 | 9.4 |
| Table 7 Gross National Disposable Income and its Use | |||||||
| € million | |||||||
| Description | ESA Code | 2011 | 2012 | 2013 | 2014 | 2015 | 2016 1 |
| 105. Gross domestic product at current market prices | B.1*g | 171,939 | 175,561 | 180,298 | 194,537 | 262,037 | 275,567 |
| 106. Net factor income from the rest of the world | D.1 & D.4 | -33,788 | -33,549 | -28,309 | -29,715 | -56,048 | -48,818 |
| (net to abroad) | |||||||
| 107. Gross national product at current market prices | 138,151 | 142,012 | 151,990 | 164,822 | 205,990 | 226,749 | |
| 108. EU subsidies | D.3 (Pt) | 1,698 | 1,632 | 1,450 | 1,318 | 1,571 | 1,479 |
| 109. EU taxes | D.2 (Pt) | -240 | -242 | -247 | -275 | -327 | -486 |
| 110. Gross national income at current market prices | B.5*g | 139,610 | 143,402 | 153,193 | 165,866 | 207,234 | 227,742 |
| 111. Current transfers from the rest of the world | |||||||
| less current transfers to the rest of the world (excluding EU subsidies and taxes) | D.7 (Pt) | -2,641 | -2,594 | -2,908 | -2,729 | -3,324 | -3,627 |
| 112. Gross national disposable income | B.6g | 136,968 | 140,808 | 150,284 | 163,136 | 203,910 | 224,115 |
| 113. Personal consumption of goods and services | P.3 (Pt) | 84,209 | 84,797 | 85,784 | 88,535 | 92,721 | 96,613 |
| 114. Net expenditure by central and local government on current goods and services | P.3 (Pt) | 26,370 | 25,745 | 25,471 | 26,244 | 26,953 | 28,354 |
| 115. Total consumption expenditure | P.3 | 110,579 | 110,542 | 111,254 | 114,779 | 119,674 | 124,968 |
| 116. Gross national savings | B.8g | 26,389 | 30,266 | 39,030 | 48,357 | 84,236 | 99,148 |
| 117. Provision for depreciation | P.51c | 23,992 | 25,650 | 27,177 | 29,486 | 56,781 | 62,893 |
| 118. Net national savings | B.8n | 2,397 | 4,616 | 11,853 | 18,871 | 27,455 | 36,255 |
| 1Preliminary | |||||||
| Table 7.1 Annual Percentage Changes in the Main Constituents of Table 7 | |||||||
| Description | ESA Code | 2011-2016 | 2011-2012 | 2012-2013 | 2013-2014 | 2014-2015 | 2015-2016 |
| Gross domestic product at current market prices | B.1*g | 9.9 | 2.1 | 2.7 | 7.9 | 34.7 | 5.2 |
| Gross national product at current market prices | 10.4 | 2.8 | 7.0 | 8.4 | 25.0 | 10.1 | |
| Gross national disposable income | B.6g | 10.3 | 2.8 | 6.7 | 8.6 | 25.0 | 9.9 |
| Personal consumption of goods and services | P.3 (Pt) | 2.8 | 0.7 | 1.2 | 3.2 | 4.7 | 4.2 |
| Net expenditure by central and local government on current goods and services | P.3 (Pt) | 1.5 | -2.4 | -1.1 | 3.0 | 2.7 | 5.2 |
| Total consumption expenditure | P.3 | 2.5 | -0.0 | 0.6 | 3.2 | 4.3 | 4.4 |
| Gross national savings | B.8g | 30.3 | 14.7 | 29.0 | 23.9 | 74.2 | 17.7 |
| Provision for depreciation | D.7 (Pt) | 21.3 | 6.9 | 6.0 | 8.5 | 92.6 | 10.8 |
| Net national savings | B.8n | 72.2 | 92.6 | 156.8 | 59.2 | 45.5 | 32.1 |
| Table 8 Gross National Disposable Income at Constant Market Prices (chain linked annually and referenced to year 2015) Adjusted for Terms of Trade (i.e. Real Gross National Disposable Income) | ||||||
| € million | ||||||
| Description | 2011 | 2012 | 2013 | 2014 | 2015 | 2016 1 |
| Gross national income (adjusted for terms of trade) | 150,879 | 149,351 | 156,828 | 166,394 | 207,234 | 225,883 |
| Net current transfers from abroad excluding EU subsidies and taxes | -2,838 | -2,702 | -3,077 | -2,897 | -3,324 | -3,873 |
| Gross national disposable income (adjusted for terms of trade) | 148,063 | 146,672 | 153,775 | 163,510 | 203,910 | 222,010 |
| Index of Real Gross National Disposable Income | 72.6 | 71.9 | 75.4 | 80.2 | 100.0 | 108.9 |
| 1 Preliminary | ||||||
| Chain linked series not additive except for 2015 and 2016 | ||||||
| Table 9 Personal Income and Personal Expenditure | ||||||
| € million | ||||||
| Description | 2011 | 2012 | 2013 | 2014 | 2015 | 2016 1 |
| 119. Net national product at factor cost before adjustment for stock appreciation | 99,789 | 100,814 | 107,971 | 116,669 | 130,027 | 141,996 |
| 120. less Government trading and investment income | -2,761 | -3,420 | -3,629 | -3,469 | -3,197 | -2,379 |
| 121. plus National debt interest | 5,768 | 7,298 | 7,774 | 7,608 | 6,864 | 6,202 |
| 122. plus Transfer income (including net transfers from the rest of the world) | 25,442 | 26,070 | 25,248 | 24,806 | 24,507 | 24,821 |
| 123. Private income | 128,239 | 130,763 | 137,364 | 145,615 | 158,201 | 170,641 |
| 124. less Undistributed profits of companies before tax | -15,742 | -14,955 | -22,949 | -28,584 | -34,443 | -41,819 |
| 125. Personal income | 112,497 | 115,808 | 114,415 | 117,031 | 123,758 | 128,822 |
| 126. Personal consumption of goods and services | 84,209 | 84,797 | 85,784 | 88,535 | 92,721 | 96,613 |
| 127. Taxes on personal income and wealth | 24,359 | 25,136 | 25,962 | 28,228 | 29,500 | 30,961 |
| 128. Total personal expenditure | 108,568 | 109,933 | 111,745 | 116,763 | 122,221 | 127,575 |
| 129. Personal savings 2 | 3,929 | 5,875 | 2,670 | 267 | 1,536 | 1,247 |
| 1Preliminary | ||||||
| 2Personal Savings are compiled on a different basis to those in the Institutional Sector Accounts published by CSO. The differences in the methodologies used in the two sets of estimates are outlined in the notes to the Annual releases on Institutional Sector Accounts. | ||||||
| Table 10 Net Current Income and Expenditure of Central and Local Government | ||||||
| € million | ||||||
| Description | 2011 | 2012 | 2013 | 2014 | 2015 | 2016 1 |
| 130. Taxes on income and wealth (including social insurance contributions) | 28,110 | 29,099 | 30,234 | 32,845 | 36,372 | 38,313 |
| 131. Taxes on expenditure (including rates) | 17,779 | 18,359 | 19,302 | 21,210 | 22,525 | 23,431 |
| 132. Net trading and investment income | 2,761 | 3,420 | 3,629 | 3,469 | 3,197 | 2,379 |
| 133. Current transfers from the rest of the world to central and local government | 45 | 46 | 11 | 36 | 93 | 32 |
| 134. Total income | 48,695 | 50,924 | 53,175 | 57,560 | 62,188 | 64,155 |
| 135. Subsidies (excluding EU subsidies) 2 | 1,725 | 1,910 | 1,906 | 1,863 | 1,766 | 1,674 |
| 136. Transfer payments (including transfers to the rest of the world) and national debt interest | 33,896 | 36,008 | 35,941 | 35,179 | 34,788 | 34,683 |
| 137. Net current expenditure on goods and services | 26,370 | 25,745 | 25,471 | 26,244 | 26,953 | 28,354 |
| 138. Total expenditure | 61,991 | 63,663 | 63,318 | 63,287 | 63,507 | 64,711 |
| 139. Central and local government savings | -13,296 | -12,739 | -10,142 | -5,727 | -1,319 | -556 |
| 1Preliminary | ||||||
| 2See explanatory note to Table 10 in methodology notes | ||||||
| Table 11 Savings and Capital Formation | ||||||
| € million | ||||||
| Description | 2011 | 2012 | 2013 | 2014 | 2015 | 2016 1 |
| Savings before adjustment for stock appreciation | ||||||
| 140. Personal | 3,929 | 5,875 | 2,670 | 267 | 1,536 | 1,247 |
| 141. Companies | 11,990 | 10,991 | 18,676 | 23,967 | 27,571 | 34,467 |
| 142. Central and local government 2 | -13,296 | -12,739 | -10,142 | -5,727 | -1,319 | -556 |
| 143. Net national savings before adjustment for stock appreciation | 2,623 | 4,127 | 11,204 | 18,508 | 27,789 | 35,158 |
| 144. Adjustment for stock appreciation | -226 | 489 | 649 | 364 | -334 | 1,097 |
| 145. Net national savings | 2,397 | 4,616 | 11,853 | 18,871 | 27,455 | 36,255 |
| 146. Provision for depreciation | 23,992 | 25,650 | 27,177 | 29,486 | 56,781 | 62,893 |
| 147. Net foreign capital transfers | 234 | 86 | -935 | -6,768 | -1,303 | -5,062 |
| 148. Net foreign disinvestment | 2,576 | 4,522 | -2,920 | 3,566 | -27,300 | -4,130 |
| 149. Statistical discrepancy (equals Item 12, Table 1) | 417 | 623 | -1,332 | -1,576 | -121 | 89 |
| 150. Gross total available for investment in domestic physical capital formation | 29,617 | 35,496 | 33,842 | 43,579 | 55,512 | 90,045 |
| Capital formation | ||||||
| 151. Building and construction | 9,342 | 9,362 | 10,833 | 12,576 | 14,164 | 17,694 |
| 152. Other home produced capital goods and services | 4,340 | 4,251 | 5,307 | 4,864 | 6,002 | 3,944 |
| 153. Imported capital goods and services | 15,131 | 20,839 | 17,487 | 22,980 | 32,993 | 66,024 |
| 154. Value of physical changes in agric. stocks | -52 | 198 | 122 | -67 | 136 | 176 |
| 155. Increase in value of non-agricultural stocks and work in progress (incl. EU intervention stocks) | 1,081 | 357 | -556 | 2,863 | 2,550 | 1,110 |
| 156. Adjustment for stock appreciation | -226 | 489 | 649 | 364 | -334 | 1,097 |
| 157. Gross domestic physical capital formation | 29,617 | 35,496 | 33,842 | 43,579 | 55,512 | 90,045 |
| 1Preliminary | ||||||
| 2See explanatory note to Table 10 in methodology notes | ||||||
| In this table the total amount available for investment, (i.e. current savings, the provision for depreciation, net foreign capital transfers and net foreign disinvestment) is equated to gross domestic physical capital formation. The figures for capital formation are obtained by adding figures for imported and home produced capital goods ready for use to the value of the physical changes in stocks, including the value of the changes in agricultural stocks. Since personal savings (item 129 in Table 9) is a residual figure it includes the effect of the changes in agricultural and certain other stocks. Personal savings accordingly includes a substantial non-monetary element. | ||||||
| Table 11.1 Gross National Investment | ||||||
| € million | ||||||
| Description | 2011 | 2012 | 2013 | 2014 | 2015 | 2016 1 |
| Gross national savings | 26,389 | 30,266 | 39,030 | 48,357 | 84,236 | 99,148 |
| Net foreign capital transfers | 234 | 86 | -935 | -6,768 | -1,303 | -5,062 |
| Statistical discrepancy | 417 | 623 | -1,332 | -1,576 | -121 | 89 |
| Total available for gross national investment | 27,040 | 30,975 | 36,763 | 40,014 | 82,812 | 94,175 |
| Gross domestic physical capital formation | 29,617 | 35,496 | 33,842 | 43,579 | 55,512 | 90,045 |
| Net foreign investment | -2,576 | -4,522 | 2,920 | -3,566 | 27,300 | 4,130 |
| Gross national investment | 27,040 | 30,975 | 36,763 | 40,014 | 82,812 | 94,175 |
| 1Preliminary | ||||||
| Table 12 Distribution of Personal Income and its relationship to Net National Product at Factor Cost | ||||||
| € million | ||||||
| Description | 2011 | 2012 | 2013 | 2014 | 2015 | 2016 1 |
| Remuneration of employees | 69,712 | 69,406 | 70,659 | 73,086 | 76,719 | 80,865 |
| Agriculture, etc. | 570 | 571 | 635 | 670 | 612 | 625 |
| Domestic non-agriculture | 63,923 | 64,028 | 64,838 | 66,756 | 69,985 | 73,667 |
| Foreign | -146 | -201 | -140 | -157 | -90 | -80 |
| Employers' contribution to social insurance | 5,365 | 5,008 | 5,326 | 5,817 | 6,211 | 6,653 |
| Income of independent traders etc. | 9,625 | 9,143 | 9,315 | 9,780 | 10,057 | 10,115 |
| Agriculture, etc. | 2,465 | 2,276 | 2,288 | 2,528 | 2,512 | 2,550 |
| Non-agriculture | 7,159 | 6,867 | 7,027 | 7,252 | 7,545 | 7,565 |
| Interest earned (prior to adjustment for FISIM) and dividends received | 4,821 | 6,064 | 5,186 | 4,661 | 5,214 | 4,634 |
| Adjustment for FISIM on interest earned | 69 | 129 | 503 | 417 | 353 | 267 |
| Rent of private dwellings | 6,800 | 7,262 | 7,355 | 7,830 | 8,621 | 9,385 |
| less Interest paid (prior to adjustment for FISIM) | 6,855 | 4,771 | 4,637 | 4,075 | 3,713 | 3,820 |
| less Adjustment for FISIM on interest paid | -2,467 | -1,881 | -2,118 | -2,103 | -2,120 | -2,466 |
| Current transfers to households (including net transfers from the rest of the world) | 25,442 | 26,070 | 25,248 | 24,806 | 24,507 | 24,821 |
| Statistical discrepancy (equals Item 12, Table 1) | 417 | 623 | -1,332 | -1,576 | -121 | 89 |
| Personal income of households and private non-profit institutions | 112,502 | 115,812 | 114,416 | 117,023 | 123,764 | 128,661 |
| Undistributed profits of companies | 15,742 | 14,955 | 22,949 | 28,584 | 34,443 | 41,819 |
| Private income | 128,244 | 130,766 | 137,365 | 145,607 | 158,207 | 170,480 |
| less National debt interest | -5,768 | -7,298 | -7,774 | -7,608 | -6,864 | -6,202 |
| less Current transfers to households (including net transfers from the rest of the world) | -25,424 | -26,055 | -25,234 | -24,785 | -24,492 | -24,646 |
| plus Government trading and investment income | 2,761 | 3,420 | 3,629 | 3,469 | 3,197 | 2,379 |
| Adjustment for stock appreciation | -226 | 489 | 649 | 364 | -334 | 1,097 |
| Net national product at factor cost | 99,587 | 101,322 | 108,635 | 117,047 | 129,715 | 143,108 |
| 1 Preliminary | ||||||
| Table 12.1 Annual Percentage Changes in the Main Constituents of Personal Income | ||||||
| Description | 2011-2016 | 2011-2012 | 2012-2013 | 2013-2014 | 2014-2015 | 2015-2016 |
| Remuneration of employees | 3.0 | -0.4 | 1.8 | 3.4 | 5.0 | 5.4 |
| Income of independent traders | 1.0 | -5.0 | 1.9 | 5.0 | 2.8 | 0.6 |
| Current transfers to households (including net transfers from the rest of the world) | -0.5 | 2.5 | -3.2 | -1.7 | -1.2 | 1.3 |
| Personal income of households and private non-profit institutions | 2.7 | 2.9 | -1.2 | 2.3 | 5.8 | 4.0 |
| Table 13 Consumption of Personal Income at Current Market Prices | ||||||
| € million | ||||||
| Description | 2011 | 2012 | 2013 | 2014 | 2015 | 2016 1 |
| Food, beverages and tobacco | 16,138 | 16,275 | 16,188 | 16,189 | 16,656 | 17,106 |
| Food (excl. meals out) | 7,263 | 7,553 | 7,525 | 7,300 | 7,596 | 7,705 |
| Non-alcoholic beverages | 606 | 667 | 789 | 766 | 778 | 794 |
| Alcoholic beverages (total incl pubs) | 6,284 | 6,157 | 6,226 | 6,498 | 6,502 | 6,803 |
| Tobacco | 1,984 | 1,898 | 1,647 | 1,625 | 1,780 | 1,804 |
| Clothing and footwear | 2,889 | 2,930 | 2,925 | 3,037 | 3,389 | 3,398 |
| Housing (rent, local government charges, repairs and decorations) | 14,549 | 14,681 | 15,126 | 15,993 | 17,226 | 18,698 |
| of which imputed rent | 10,106 | 10,180 | 10,512 | 11,146 | 12,066 | 12,954 |
| Fuel and power (excluding motor fuels) | 3,172 | 3,413 | 3,526 | 3,299 | 3,446 | 3,194 |
| Household equipment and operation | 3,362 | 3,483 | 3,655 | 4,251 | 4,326 | 4,284 |
| Durable household goods | 1,833 | 1,811 | 1,821 | 2,069 | 2,115 | 2,107 |
| Non-durable goods and services | 1,530 | 1,672 | 1,834 | 2,182 | 2,211 | 2,177 |
| Transport and communication | 12,989 | 12,970 | 12,600 | 13,413 | 14,049 | 14,750 |
| Personal transport equipment | 2,378 | 2,164 | 2,167 | 2,848 | 3,587 | 4,160 |
| Operation of personal transport equipment (incl. motor fuels) | 5,287 | 5,496 | 5,081 | 4,972 | 4,567 | 4,555 |
| Public transport | 2,904 | 3,004 | 3,112 | 3,255 | 3,480 | 3,665 |
| Communication | 2,420 | 2,306 | 2,239 | 2,337 | 2,414 | 2,370 |
| Recreation, entertainment and education | 7,636 | 7,343 | 7,338 | 7,304 | 7,584 | 7,969 |
| Equipment and accessories | 2,363 | 2,171 | 2,185 | 2,044 | 2,019 | 1,985 |
| Services (incl. education) | 5,273 | 5,171 | 5,153 | 5,260 | 5,566 | 5,984 |
| Miscellaneous goods and services | 21,470 | 21,892 | 22,867 | 23,598 | 24,888 | 25,828 |
| Professional services (incl. medical goods and services) | 9,361 | 9,930 | 10,297 | 10,463 | 11,306 | 11,465 |
| Goods (n.e.s.) | 3,394 | 3,201 | 2,796 | 2,871 | 3,232 | 3,211 |
| Services (n.e.s.) | 8,167 | 8,284 | 8,916 | 9,505 | 9,707 | 10,580 |
| FISIM (financial services indirectly measured) | 548 | 477 | 857 | 759 | 642 | 573 |
| Expenditure outside the State | 4,536 | 4,304 | 4,348 | 4,519 | 4,802 | 5,346 |
| less Expenditure by non-residents | -2,531 | -2,493 | -2,790 | -3,069 | -3,644 | -3,961 |
| 158. Personal consumption of goods and services at current market prices | 84,209 | 84,797 | 85,784 | 88,535 | 92,721 | 96,613 |
| 159. Taxes on personal income and wealth | 24,359 | 25,136 | 25,962 | 28,228 | 29,500 | 30,961 |
| 160. Total personal expenditure | 108,568 | 109,933 | 111,745 | 116,763 | 122,221 | 127,575 |
| 1Preliminary | ||||||
| Table 13.1 Annual Percentage Changes in the Main Constituents of Table 13 | ||||||
| Description | 2011-2016 | 2011-2012 | 2012-2013 | 2013-2014 | 2014-2015 | 2015-2016 |
| Food | 1.2 | 4.0 | -0.4 | -3.0 | 4.1 | 1.4 |
| Non-alcoholic Beverages | 5.5 | 10.0 | 18.3 | -3.0 | 1.6 | 2.0 |
| Alcoholic beverages | 1.6 | -2.0 | 1.1 | 4.4 | 0.0 | 4.6 |
| Tobacco | -1.9 | -4.3 | -13.2 | -1.3 | 9.5 | 1.4 |
| Clothing and footwear | 3.3 | 1.4 | -0.2 | 3.8 | 11.6 | 0.3 |
| Housing | 5.1 | 0.9 | 3.0 | 5.7 | 7.7 | 8.5 |
| Fuel and Power | 0.1 | 7.6 | 3.3 | -6.4 | 4.4 | -7.3 |
| Household equipment and operation | 5.0 | 3.6 | 4.9 | 16.3 | 1.8 | -1.0 |
| Transport and communication | 2.6 | -0.2 | -2.9 | 6.5 | 4.7 | 5.0 |
| Recreation, entertainment and education | 0.9 | -3.8 | -0.1 | -0.5 | 3.8 | 5.1 |
| Miscellaneous goods and services | 3.8 | 2.0 | 4.5 | 3.2 | 5.5 | 3.8 |
| Expenditure outside the State | 3.3 | -5.1 | 1.0 | 3.9 | 6.3 | 11.3 |
| Expenditure by non-residents | 9.4 | -1.5 | 11.9 | 10.0 | 18.8 | 8.7 |
| Personal consumption of goods and services | 2.8 | 0.7 | 1.2 | 3.2 | 4.7 | 4.2 |
| Table 14 Consumption of Personal Income (except Taxes on Personal Income and Wealth) at Constant Market Prices (chain linked annually and referenced to year 2015) | ||||||
| € million | ||||||
| Description | 2011 | 2012 | 2013 | 2014 | 2015 | 2016 1 |
| Food, beverages and tobacco | 16,683 | 16,625 | 16,124 | 16,052 | 16,656 | 17,101 |
| Food (excl. meals out) | 7,045 | 7,309 | 7,201 | 7,141 | 7,596 | 7,798 |
| Non-alcoholic beverages | 605 | 648 | 767 | 754 | 778 | 795 |
| Alcoholic beverages (total including pubs) | 6,774 | 6,594 | 6,376 | 6,455 | 6,502 | 6,818 |
| Tobacco | 2,358 | 2,114 | 1,783 | 1,704 | 1,780 | 1,690 |
| Clothing and footwear | 2,605 | 2,648 | 2,723 | 2,923 | 3,389 | 3,484 |
| Housing (rent, local government charges, repairs and decorations) | 18,254 | 18,085 | 17,699 | 17,373 | 17,226 | 17,180 |
| of which imputed rent | 13,100 | 12,877 | 12,539 | 12,204 | 12,066 | 11,831 |
| Fuel and power (excluding motor fuels) | 3,474 | 3,355 | 3,352 | 3,099 | 3,446 | 3,378 |
| Household equipment and operation | 3,048 | 3,219 | 3,482 | 4,159 | 4,326 | 4,395 |
| Durable household goods | 1,511 | 1,549 | 1,645 | 1,982 | 2,115 | 2,212 |
| Non-durable goods and services | 1,527 | 1,668 | 1,840 | 2,180 | 2,211 | 2,183 |
| Transport and communication | 12,606 | 12,189 | 12,014 | 12,999 | 14,049 | 15,233 |
| Personal transport equipment | 2,142 | 1,985 | 2,048 | 2,773 | 3,587 | 4,306 |
| Operation of personal transport equipment (including motor fuels) | 4,900 | 4,777 | 4,530 | 4,548 | 4,567 | 4,802 |
| Public transport | 3,238 | 3,187 | 3,203 | 3,287 | 3,480 | 3,728 |
| Communication | 2,276 | 2,203 | 2,217 | 2,380 | 2,414 | 2,396 |
| Recreation, entertainment and education | 8,017 | 7,619 | 7,477 | 7,395 | 7,584 | 8,010 |
| Equipment and accessories | 2,032 | 1,956 | 2,045 | 1,984 | 2,019 | 2,147 |
| Services (including education) | 6,018 | 5,685 | 5,426 | 5,411 | 5,566 | 5,862 |
| Miscellaneous goods and services | 22,098 | 22,502 | 23,035 | 23,636 | 24,888 | 25,643 |
| Professional services (including medical goods and services) | 9,442 | 9,993 | 10,319 | 10,454 | 11,306 | 11,421 |
| Goods (n.e.s.) | 2,866 | 2,807 | 2,566 | 2,770 | 3,232 | 3,314 |
| Services (n.e.s.) | 8,812 | 8,833 | 9,399 | 9,699 | 9,707 | 10,301 |
| FISIM (financial services indirectly measured) | 1,089 | 882 | 769 | 728 | 642 | 607 |
| Expenditure outside the State | 4,868 | 4,465 | 4,402 | 4,517 | 4,802 | 5,251 |
| less Expenditure by non-residents | -2,645 | -2,529 | -2,803 | -3,057 | -3,644 | -3,932 |
| 161. Personal consumption of goods and services at constant market prices | 88,620 | 87,837 | 87,240 | 88,989 | 92,721 | 95,743 |
| 1Preliminary | ||||||
| Chain linked series not additive except for 2015 and 2016 | ||||||
| Table 14.1 Annual Percentage Changes in the Main Constituents of Table 14 | ||||||
| Description | 2011-2016 | 2011-2012 | 2012-2013 | 2013-2014 | 2014-2015 | 2015-2016 |
| Food | 2.1 | 3.8 | -1.5 | -0.8 | 6.4 | 2.7 |
| Non-alcoholic Beverages | 5.6 | 7.2 | 18.4 | -1.8 | 3.2 | 2.2 |
| Alcoholic beverages | 0.1 | -2.7 | -3.3 | 1.2 | 0.7 | 4.9 |
| Tobacco | -6.4 | -10.4 | -15.6 | -4.4 | 4.5 | -5.1 |
| Clothing and footwear | 6.0 | 1.7 | 2.8 | 7.3 | 15.9 | 2.8 |
| Housing | -1.2 | -0.9 | -2.1 | -1.8 | -0.8 | -0.3 |
| Fuel and Power | -0.6 | -3.4 | -0.1 | -7.5 | 11.2 | -2.0 |
| Household equipment and operation | 7.6 | 5.6 | 8.2 | 19.5 | 4.0 | 1.6 |
| Transport and communication | 3.9 | -3.3 | -1.4 | 8.2 | 8.1 | 8.4 |
| Recreation, entertainment and education | -0.0 | -5.0 | -1.9 | -1.1 | 2.6 | 5.6 |
| Miscellaneous goods and services | 3.0 | 1.8 | 2.4 | 2.6 | 5.3 | 3.0 |
| Expenditure outside the State | 1.5 | -8.3 | -1.4 | 2.6 | 6.3 | 9.3 |
| Expenditure by non-residents | 8.3 | -4.4 | 10.8 | 9.1 | 19.2 | 7.9 |
| Personal consumption of goods and services | 1.6 | -0.9 | -0.7 | 2.0 | 4.2 | 3.3 |
| Table 15 Gross Domestic Physical Capital Formation at Current Market Prices | ||||||
| € million | ||||||
| Description | 2011 | 2012 | 2013 | 2014 | 2015 | 2016 1 |
| Fixed capital | ||||||
| Dwellings | 3,851 | 3,044 | 3,271 | 4,081 | 4,423 | 5,195 |
| Roads | 1,080 | 1,089 | 694 | 959 | 981 | 1,084 |
| Other building and construction (including land rehabilitation etc.) | 4,064 | 4,882 | 6,361 | 6,700 | 7,845 | 10,281 |
| Costs associated with transfer of land and buildings | 347 | 347 | 506 | 836 | 915 | 1,134 |
| Transport equipment | 7,419 | 10,178 | 7,568 | 9,557 | 9,093 | 14,008 |
| Agricultural machinery | 202 | 313 | 353 | 375 | 386 | 403 |
| Other machinery and equipment | 3,655 | 3,163 | 4,994 | 6,057 | 6,679 | 6,122 |
| Software | 1,138 | 1,332 | 1,383 | 1,511 | 1,840 | 2,163 |
| Exploration | 273 | 397 | 212 | 229 | 204 | 118 |
| Artistic originals | 174 | 135 | 160 | 175 | 167 | 171 |
| Research and development | 6,610 | 9,571 | 8,125 | 9,942 | 20,626 | 46,984 |
| Gross domestic fixed capital formation | 28,813 | 34,452 | 33,627 | 40,420 | 53,160 | 87,662 |
| Changes in stocks | ||||||
| Value of physical changes in stocks on farms | -52 | 198 | 122 | -67 | 136 | 176 |
| Value of physical changes in EU intervention stocks | -44 | -16 | 0 | 0 | 3 | 60 |
| Value of physical changes in other stocks | 900 | 862 | 94 | 3,227 | 2,213 | 2,147 |
| Total value of physical changes in stocks | 803 | 1,045 | 216 | 3,160 | 2,353 | 2,383 |
| 162. Gross domestic physical capital formation at current market prices | 29,617 | 35,496 | 33,842 | 43,579 | 55,512 | 90,045 |
| 1Preliminary | ||||||
| Table 16 Gross Domestic Fixed Capital Formation by Sector of Use at Current Market Prices | ||||||
| € million | ||||||
| Description | 2011 | 2012 | 2013 | 2014 | 2015 | 2016 1 |
| Agriculture, forestry and fishing | 641 | 721 | 810 | 866 | 900 | 914 |
| Fuel and power products | 1,272 | 1,373 | 1,818 | 1,647 | 1,623 | 1,803 |
| Manufacturing products | 3,995 | 5,412 | 6,204 | 6,863 | 10,387 | 41,629 |
| Building and construction | 14 | -12 | 22 | 66 | 84 | 145 |
| Market services | 20,724 | 24,984 | 22,262 | 28,441 | 37,200 | 39,783 |
| Dwellings (incl. transfer costs) | 4,031 | 3,227 | 3,538 | 4,521 | 4,905 | 5,792 |
| Roads | 1,080 | 1,089 | 694 | 959 | 981 | 1,084 |
| Other market services | 15,614 | 20,668 | 18,029 | 22,961 | 31,315 | 32,907 |
| Non-market services | 2,167 | 1,973 | 2,510 | 2,537 | 2,965 | 3,389 |
| 163. Gross domestic fixed capital formation at current market prices | 28,813 | 34,452 | 33,627 | 40,420 | 53,160 | 87,662 |
| 1Preliminary | ||||||
| Table 17 Gross Domestic Physical Capital Formation at Constant Market Prices (chain linked annually and referenced to year 2015) | ||||||
| € million | ||||||
| Description | 2011 | 2012 | 2013 | 2014 | 2015 | 2016 1 |
| Fixed capital | ||||||
| Dwellings | 4,418 | 3,413 | 3,564 | 4,200 | 4,423 | 5,012 |
| Roads | 1,262 | 1,237 | 767 | 1,012 | 981 | 1,027 |
| Other building and construction (including land rehabilitation etc.) | 4,752 | 5,549 | 7,026 | 7,069 | 7,845 | 9,669 |
| Costs associated with transfer of land and buildings | 335 | 432 | 615 | 902 | 915 | 1,069 |
| Transport equipment | 7,724 | 10,460 | 7,686 | 9,691 | 9,093 | 13,885 |
| Agricultural machinery | 215 | 339 | 387 | 384 | 386 | 447 |
| Other machinery and equipment | 4,019 | 3,364 | 5,320 | 6,197 | 6,679 | 6,334 |
| Software | 1,291 | 1,451 | 1,494 | 1,614 | 1,840 | 2,163 |
| Exploration | 319 | 451 | 235 | 242 | 204 | 111 |
| Artistic originals | 170 | 130 | 157 | 167 | 167 | 187 |
| Research and development | 6,951 | 9,559 | 8,068 | 10,137 | 20,626 | 45,770 |
| Gross domestic fixed capital formation | 31,385 | 36,530 | 35,190 | 41,560 | 53,160 | 85,674 |
| Changes in stocks | ||||||
| Value of physical changes in stocks on farms | -70 | 244 | 137 | -77 | 136 | 192 |
| Value of physical changes in EU intervention stocks | -40 | -14 | 0 | 0 | 3 | 63 |
| Value of physical changes in other stocks | 488 | 482 | 92 | 3,243 | 2,213 | 2,428 |
| Total value of physical changes in stocks | 617 | 810 | 214 | 3,198 | 2,353 | 2,682 |
| 164. Gross domestic physical capital formation at constant market prices | 32,050 | 37,434 | 35,291 | 44,779 | 55,512 | 88,356 |
| 1Preliminary | ||||||
| Chain linked series not additive except for 2015 and 2016 | ||||||
| Table 18 Gross Domestic Fixed Capital Formation by Sector of Use at Constant Market Prices (chain linked annually and referenced to year 2015) | ||||||
| € million | ||||||
| Description | 2011 | 2012 | 2013 | 2014 | 2015 | 2016 1 |
| Agriculture, forestry and fishing | 702 | 788 | 881 | 896 | 900 | 939 |
| Fuel and power products | 1,463 | 1,537 | 1,995 | 1,729 | 1,623 | 1,751 |
| Manufacturing products | 4,362 | 5,718 | 6,510 | 7,046 | 10,387 | 41,024 |
| Building and construction | 14 | -13 | 24 | 67 | 84 | 152 |
| Market services | 22,430 | 26,363 | 23,159 | 29,190 | 37,200 | 38,527 |
| Dwellings (incl. transfer costs) | 4,591 | 3,655 | 3,896 | 4,674 | 4,905 | 5,575 |
| Roads | 1,262 | 1,237 | 767 | 1,012 | 981 | 1,027 |
| Other market services | 16,679 | 21,462 | 18,518 | 23,519 | 31,315 | 31,925 |
| Non-market services | 2,450 | 2,146 | 2,685 | 2,650 | 2,965 | 3,280 |
| 165. Gross domestic fixed capital formation at constant market prices | 31,385 | 36,530 | 35,190 | 41,560 | 53,160 | 85,674 |
| 1Preliminary | ||||||
| Chain linked series not additive except for 2015 and 2016 | ||||||
| Table 19 Balance of International Payments: Current Account | |||||||
| € million | |||||||
| Description | 2011 | 2012 | 2013 | 2014 | 2015 | 2016 1 | |
| 1. Merchandise and services2 | Cr | 177,303 | 187,658 | 191,185 | 219,786 | 326,610 | 335,041 |
| Db | -145,143 | -157,512 | -157,315 | -185,184 | -239,880 | -274,398 | |
| 2. Net factor income | -33,788 | -33,549 | -28,309 | -29,715 | -56,048 | -48,818 | |
| 3. EU Subsidies less EU taxes | 1,458 | 1,390 | 1,203 | 1,044 | 1,244 | 994 | |
| 4. Net transfers | -2,641 | -2,594 | -2,909 | -2,729 | -3,324 | -3,625 | |
| 5. Net balance on current account | -2,810 | -4,607 | 3,855 | 3,202 | 28,603 | 9,193 | |
| 1Preliminary | |||||||
| 2Adjusted for balance of payments purposes | |||||||
| Table 20 Balance of International Payments: Capital and Financial Account and Net Errors and Omissions | ||||||
| € million | ||||||
| Description | 2011 | 2012 | 2013 | 2014 | 2015 | 2016 1 |
| 6. Balance on Capital Account | 234 | 86 | -936 | -6,769 | -1,303 | -5,063 |
| Financial Account | ||||||
| 7. Direct Investment | -18,698 | -18,957 | -12,996 | 3,031 | -42,790 | 13,435 |
| 8. Portfolio Investment | -26,908 | -833 | 45,576 | -56,662 | -116,710 | 34,156 |
| 9. Other Investment2 | 31,086 | 11,025 | -26,436 | 48,089 | 181,591 | -37,227 |
| 10. Reserve Assets | -329 | -12 | 10 | 136 | 494 | 1,456 |
| 11. Balance on Financial account | -14,849 | -8,777 | 6,155 | -5,404 | 22,583 | 11,820 |
| 12. Net errors and omissions | -12,272 | -4,256 | 3,236 | -1,837 | -4,717 | 7,690 |
| 1 Preliminary | ||||||
| 2 Including financial derivatives and trade credits | ||||||
| Table 21 Gross Value Added at Current Basic Prices | ||||||||
| € million | ||||||||
| NACE REV. 2 section | NACE REV. 2 division | Description | 2011 | 2012 | 2013 | 2014 | 2015 | 2016 1 |
| A | 01-03 | Agriculture, forestry and fishing | 2,079 | 1,741 | 2,027 | 2,505 | 2,340 | 2,548 |
| B | 05-09 | Mining and quarrying | 765 | 910 | 752 | 895 | 549 | 373 |
| C | 10-33 | Manufacturing | 36,838 | 35,771 | 35,768 | 38,414 | 89,928 | 88,566 |
| of which | ||||||||
| CA | 10-12 | food products, beverages and tobacco products | 6,792 | 7,024 | 7,909 | 8,793 | 9,298 | 9,676 |
| CB | 13-15 | textiles, wearing apparel and leather products | 161 | 152 | 149 | 155 | 166 | 158 |
| CC | 16-18 | wood and paper products, and printing | 767 | 645 | 759 | 760 | 781 | 860 |
| CD-CE | 19-20 | coke and refined petroleum products, chemicals and chemical products | 3,622 | 5,203 | 3,809 | 3,232 | 4,098 | 4,312 |
| CF2 | 21 | basic pharmaceutical products and pharmaceutical preparations | 14,885 | 12,302 | 12,048 | 13,596 | n/a | n/a |
| CG | 22-23 | rubber and plastic products, and other non-metallic mineral products | 853 | 819 | 964 | 989 | 1,133 | 1,294 |
| CH | 24-25 | basic metals and fabricated metal products, except machinery and equipment | 769 | 794 | 893 | 922 | 1,004 | 1,136 |
| CI2 | 26 | computer, electronic and optical products | 3,189 | 3,325 | 2,984 | 3,165 | n/a | n/a |
| CJ | 27 | electrical equipment | 263 | 258 | 299 | 350 | 381 | 405 |
| CK2 | 28 | machinery and equipment n.e.c. | 882 | 977 | 1,031 | 1,067 | n/a | n/a |
| CL | 29-30 | transport equipment | 341 | 307 | 302 | 266 | 312 | 311 |
| CM2 | 31-33 | furniture; other manufacturing; repair and installation of machinery and equipment | 4,313 | 3,964 | 4,622 | 5,118 | n/a | n/a |
| D | 35 | Electricity, gas, steam and air-conditioning supply | 3,023 | 3,297 | 3,505 | 3,232 | 3,064 | 3,414 |
| E | 36-39 | Water Supply; sewerage, waste management and remediation activities | 688 | 796 | 841 | 878 | 913 | 966 |
| F | 41-43 | Construction | 2,595 | 3,651 | 4,543 | 5,775 | 6,179 | 7,040 |
| G | 45-47 | Wholesale and retail trade, repair of motor vehicles and motorcycles | 16,536 | 17,160 | 18,873 | 18,565 | 19,856 | 20,008 |
| H | 49-53 | Transportation and storage | 5,597 | 5,513 | 5,750 | 6,177 | 6,451 | 7,258 |
| I | 55-56 | Accommodation and food services activities | 3,236 | 3,461 | 3,933 | 4,167 | 4,361 | 4,852 |
| JA | 58-60 | Publishing, audiovisual and broadcasting activities | 7,912 | 8,639 | 9,329 | 10,677 | 12,107 | 13,648 |
| JB | 61 | Telecommunications | 2,255 | 2,060 | 1,961 | 1,828 | 1,782 | 1,772 |
| JC | 62-63 | Computer programming, consultancy and related activities; information service activities | 3,609 | 4,576 | 5,156 | 6,415 | 7,644 | 9,497 |
| K | 64-66 | Financial and insurance activities | 15,116 | 14,519 | 13,137 | 14,731 | 16,393 | 17,346 |
| L | 68 | Real estate activities | 10,640 | 11,687 | 12,442 | 13,647 | 14,491 | 15,756 |
| MA | 69-71 | Legal and accounting activities; activities of head offices; management consultancy activities; architecture and engineering activities; technical testing and analysis | 5,232 | 5,600 | 6,029 | 7,098 | 7,431 | 9,950 |
| MB | 72 | Scientific research and development | 444 | 403 | 737 | 1,044 | 1,906 | 2,485 |
| MC | 73-75 | Advertising and market research; other professional, scientific and technical activities; veterinary activities | 1,165 | 1,035 | 1,242 | 1,417 | 1,691 | 1,767 |
| N | 77-82 | Administrative and support service activities | 7,947 | 8,261 | 8,966 | 10,041 | 14,186 | 15,153 |
| O | 84 | Public administration and defence; compulsory social security | 7,113 | 6,974 | 7,065 | 7,276 | 7,515 | 7,660 |
| P | 85 | Education | 8,668 | 8,737 | 8,802 | 8,657 | 8,841 | 9,027 |
| QA | 86 | Human health activities | 9,463 | 9,198 | 8,727 | 8,775 | 9,153 | 9,347 |
| QB | 87-88 | Social work activities | 2,752 | 2,823 | 3,165 | 3,276 | 3,470 | 3,676 |
| R | 90-93 | Arts, entertainment and recreation | 1,895 | 1,722 | 1,782 | 1,765 | 1,765 | 1,863 |
| S | 94-96 | Other service activities | 950 | 995 | 1,042 | 1,196 | 1,115 | 1,161 |
| T | 97-98 | Activities of households as employers of domestic personnel and undifferentiated goods and services production for households for own use | 145 | 155 | 141 | 129 | 171 | 135 |
| U 3 | 99 | Activities of extra-territorial organisations and bodies | 69 | 121 | 205 | 261 | 119 | 33 |
| Statistical Discrepancy (equals Item 12, Table 1) | 417 | 623 | -1,332 | -1,576 | -121 | 89 | ||
| Gross value added at current basic prices | 157,082 | 160,308 | 164,382 | 177,007 | 243,181 | 255,358 | ||
| 1Preliminary | ||||||||
| 2Nace Rev.2 sections CF, CI, CK and CM are suppressed for 2015 and 2016 for confidentiality reasons | ||||||||
| 3Sector U is not included in the total as per ESA 2010 Section 2.06. | ||||||||
| Table 22 Gross Value Added at Constant Basic Prices (chain linked annually and referenced to year 2015) | ||||||||
| € million | ||||||||
| NACE REV. 2 section | NACE REV. 2 division | Description | 2011 | 2012 | 2013 | 2014 | 2015 | 2016 1 |
| A | 01-03 | Agriculture, forestry and fishing | 1936 | 1645 | 1779 | 2229 | 2340 | 2644 |
| B | 05-09 | Mining and quarrying | 606 | 582 | 709 | 638 | 549 | 480 |
| C | 10-33 | Manufacturing | 45,231 | 44,517 | 43,001 | 46,387 | 89,928 | 92,364 |
| of which | ||||||||
| CA | 10-12 | food products, beverages and tobacco products | 7,808 | 7,762 | 8,311 | 8,923 | 9,298 | 8,963 |
| CB | 13-15 | textiles, wearing apparel and leather products | 174 | 157 | 159 | 164 | 166 | 165 |
| CC | 16-18 | wood and paper products, and printing | 769 | 736 | 739 | 794 | 781 | 737 |
| CD-CE | 19-20 | coke and refined petroleum products, chemicals and chemical products | 5,431 | 6,068 | 6,065 | 5,320 | 4,098 | 4,115 |
| CF2 | 21 | basic pharmaceutical products and pharmaceutical preparations | 17,912 | 16,652 | 14,768 | 15,593 | n/a | n/a |
| CG | 22-23 | rubber and plastic products, and other non-metallic mineral products | 1,026 | 953 | 980 | 1,014 | 1,133 | 1,227 |
| CH | 24-25 | basic metals and fabricated metal products, except machinery and equipment | 809 | 725 | 816 | 910 | 1,004 | 987 |
| CI2 | 26 | computer, electronic and optical products | 4,880 | 5,144 | 4,291 | 4,316 | n/a | n/a |
| CJ | 27 | electrical equipment | 411 | 409 | 408 | 385 | 381 | 435 |
| CK2 | 28 | machinery and equipment n.e.c. | 758 | 797 | 810 | 915 | n/a | n/a |
| CL | 29-30 | transport equipment | 443 | 416 | 397 | 322 | 312 | 366 |
| CM2 | 31-33 | furniture; other manufacturing; repair and installation of machinery and equipment | 2,505 | 2,547 | 2,613 | 3,605 | n/a | n/a |
| D | 35 | Electricity, gas, steam and air-conditioning supply | 2,870 | 2,846 | 2,754 | 3,053 | 3,064 | 3,166 |
| E | 36-39 | Water Supply; sewerage, waste management and remediation activities | 848 | 863 | 871 | 900 | 913 | 907 |
| F | 41-43 | Construction | 5,332 | 5,136 | 5,516 | 5,833 | 6,179 | 7,109 |
| G | 45-47 | Wholesale and retail trade, repair of motor vehicles and motorcycles | 17,016 | 16,934 | 17,153 | 18,327 | 19,856 | 21,056 |
| H | 49-53 | Transportation and storage | 6,410 | 6,401 | 6,357 | 6,379 | 6,451 | 6,600 |
| I | 55-56 | Accommodation and food services activities | 3,779 | 3,715 | 3,973 | 4,193 | 4,361 | 4,603 |
| JA | 58-60 | Publishing, audiovisual and broadcasting activities | 8,684 | 8,344 | 9,334 | 10,647 | 12,107 | 12,259 |
| JB | 61 | Telecommunications | 1,639 | 1,699 | 1,723 | 1,758 | 1,782 | 1,847 |
| JC | 62-63 | Computer programming, consultancy and related activities; information service activities | 3,947 | 4,810 | 5,449 | 6,768 | 7,644 | 9,542 |
| K | 64-66 | Financial and insurance activities | 16,724 | 14,961 | 14,269 | 15,186 | 16,393 | 16,944 |
| L | 68 | Real estate activities | 13,067 | 13,467 | 13,927 | 14,491 | 14,491 | 14,637 |
| MA | 69-71 | Legal and accounting activities; activities of head offices; management consultancy activities; architecture and engineering activities; technical testing and analysis | 5,683 | 5,914 | 6,318 | 7,356 | 7,431 | 9,821 |
| MB | 72 | Scientific research and development | 479 | 424 | 754 | 1,059 | 1,906 | 2,363 |
| MC | 73-75 | Advertising and market research; other professional, scientific and technical activities; veterinary activities | 1,261 | 1,099 | 1,297 | 1,451 | 1,691 | 1,732 |
| N | 77-82 | Administrative and support service activities | 9,046 | 9,035 | 9,746 | 10,788 | 14,186 | 14,933 |
| O | 84 | Public administration and defence; compulsory social security | 7,465 | 7,119 | 7,160 | 7,382 | 7,515 | 7,681 |
| P | 85 | Education | 8,545 | 8,558 | 8,628 | 8,735 | 8,841 | 8,986 |
| QA | 86 | Human health activities | 8,382 | 8,196 | 8,519 | 8,536 | 9,153 | 9,333 |
| QB | 87-88 | Social work activities | 2,979 | 3,077 | 3,247 | 3,269 | 3,470 | 3,433 |
| R | 90-93 | Arts, entertainment and recreation | 1,474 | 1,524 | 1,539 | 1,622 | 1,765 | 2,073 |
| S | 94-96 | Other service activities | 1,187 | 1,154 | 1,159 | 1,182 | 1,115 | 1,155 |
| T | 97-98 | Activities of households as employers of domestic personnel and undifferentiated goods and services production for households for own use | 143 | 159 | 148 | 133 | 171 | 132 |
| U3 | 99 | Activities of extra-territorial organisations and bodies | 74 | 129 | 214 | 267 | 119 | 32 |
| Statistical Discrepancy (equals Item 66, Table 4) 4 | ~ | ~ | ~ | ~ | -121 | -504 | ||
| Gross value added at constant basic prices 5 | 173,995 | 174,087 | 176,541 | 191,029 | 243,181 | 255,294 | ||
| 1Preliminary | ||||||||
| 2Nace Rev.2 sections CF, CI, CK and CM are suppressed for 2015 and 2016 for confidentiality reasons | ||||||||
| 3Sector U is not included in the total as per ESA 2010 Section 2.06. | ||||||||
| 4Chain linked series not additive except for 2015 and 2016 | ||||||||
| Annex 1. Modified Gross National Income at Current Market Prices | |||||||
| € million | |||||||
| Description | ESA Code | 2011 | 2012 | 2013 | 2014 | 2015 | 2016 1 |
| 1. Gross domestic product at current market prices | B.1*g | 171,939 | 175,561 | 180,298 | 194,537 | 262,037 | 275,567 |
| 2. Net factor income from the rest of the world | D.1 & D.4 | -33,788 | -33,549 | -28,309 | -29,715 | -56,048 | -48,818 |
| (net to abroad) | |||||||
| 3. Gross national product at current market prices | 138,151 | 142,012 | 151,990 | 164,822 | 205,990 | 226,749 | |
| 4. EU subsidies | D.3 (Pt) | 1,698 | 1,632 | 1,450 | 1,318 | 1,571 | 1,479 |
| 5. EU taxes | D.2 (Pt) | -240 | -242 | -247 | -275 | -327 | -486 |
| 6. Gross national income at current market prices | B.5*g | 139,610 | 143,402 | 153,193 | 165,866 | 207,234 | 227,742 |
| Adjustments: | |||||||
| 7. Factor income of redomiciled companies | -5,548 | -7,102 | -6,477 | -6,855 | -4,666 | -5,786 | |
| 8. Depreciation on R & D related intellectual property (IP) imports | -379 | -586 | -705 | -771 | -25,047 | -27,793 | |
| 9 Depreciation on aircraft leasing | -2,366 | -2,653 | -3,006 | -3,782 | -4,642 | -5,001 | |
| 10. Modified gross national income at current market prices | 131,316 | 133,060 | 143,005 | 154,457 | 172,878 | 189,163 | |
| 1Preliminary | |||||||
| Annex 1.1 Annual Percentage Changes in the Main Constituents of Annex 1 | |||||||
| Description | ESA Code | 2011-2016 | 2011-2012 | 2012-2013 | 2013-2014 | 2014-2015 | 2015-2016 |
| Gross domestic product at current market prices | B.1*g | 9.9 | 2.1 | 2.7 | 7.9 | 34.7 | 5.2 |
| Gross national product at current market prices | 10.4 | 2.8 | 7.0 | 8.4 | 25.0 | 10.1 | |
| Gross national income at current market prices | B.5*g | 10.3 | 2.7 | 6.8 | 8.3 | 24.9 | 9.9 |
| Modified gross national income at current market prices | 7.6 | 1.3 | 7.5 | 8.0 | 11.9 | 9.4 | |
This release contains the first detailed results of the main National Accounts aggregates and their components for 2016. It includes revisions for all years from 2011 to 2015. The estimates for the most recent years, especially 2016, are based on provisional indicators for the different aggregates and are subject to revision. (A preliminary estimate of the 2016 outturn was already provided in the quarterly accounts release for Q4).
National accounts are compiled in the EU according to the European System of National and Regional Accounts (ESA) framework. ESA 2010 is the European version of the current UN mandated international standards for national accounts statistics, the System of National Accounts (SNA) 2008. The results for all years in this release are published on an ESA 2010 basis.
In compliance with EU regulations the NACE Rev. 2 classification system is used in Tables 2 to 4. This change was introduced in the National Income and Expenditure 2011 release. The NACE Rev. 2 replaces the national classification system which was used up to NIE10.
Tables 2 to 4 show a full A10 breakdown which replaces the five sectors used up to NIE2015. The correspondence with the relevant sections of NACE Rev.2 is as follows:
|
Agriculture, forestry and fishing |
Section A |
|
Industry (excluding Construction) |
Sections B,C,D,E |
|
Of which: Manufacturing |
Section C |
|
Construction |
Section F |
|
Distribution, transport, hotels and restaurants |
Sections G,H,I |
|
Information and communication |
Section J |
|
Financial and insurance activities |
Section K |
|
Real estate activities |
Section L |
|
Professional, admin and support services |
Sections M,N |
|
Public admin, education and health |
Sections O,P,Q |
|
Arts, entertainment and other services |
Sections R,S,T |
For further information on the NACE Rev. 2 classification of industrial activity, visit the CSO website:
http://www.cso.ie/en/surveysandmethodology/classifications/classificationofindustrialactivity.
In Ireland, Gross Domestic Product (GDP) at current prices is calculated using two approaches viz. the income and expenditure approaches. The main components of the income estimate are (1) profits of companies and of the self-employed, (2) remuneration of employees (wages, salaries, pensions and employers’ contributions to social insurance) and (3) rent of dwellings (imputed in the case of owner-occupied). Adjustments are made in respect of stock appreciation (to eliminate the effect of price changes on the level of stocks). On the expenditure side estimates are made of personal expenditure on consumers’ goods and services, expenditure by public authorities on current goods and services, gross domestic fixed capital formation and the value of physical changes in stocks. The value of exports is then added and imports are deducted.
The two approaches (income and expenditure) should theoretically give the same answer. However, they will always diverge to some extent as they are measured using different data sources. The components of the two original estimates are shown unadjusted. The official level of GDP is taken to be an average of the expenditure and income estimates and a balancing item is displayed which is half of the difference between the two estimates. This is the amount by which both estimates have to be adjusted to agree with the official level of GDP.
A more detailed description of the Irish national accounts methodology is available at National Income and Expenditure Annual Results 2016 Methodology Note (PDF 680KB)
At constant prices, two measures (output and expenditure) are used. These measures are being produced using annual chain linked indices. On the output side, for each pair of successive years, the volume growth measures at a detailed level are weighted together using value added weights of the first year. Similarly, on the expenditure side, annual growth estimates are weighted by previous year expenditure weights. The average of the two measures is the official growth measure used. The change over a period of years is then calculated by linking together the annual changes. The estimates in this release are referenced to 2015 values.
The estimates in this release are based on more detailed and more recent data than that available at the time of publishing the quarterly estimates for 2016. In particular they incorporate revisions to the Balance of Payments figures for recent years and revised unit value indices for merchandise trade.
The revenue from the margin on lending and borrowing by financial intermediaries (mostly banks) is called financial intermediation services indirectly measured (FISIM). This margin is taken as the output of non-invoiced services produced by these financial intermediaries and has been included in the calculation of GDP since the publication of the 2004 annual results and the Q1 2005 quarterly results in July 2005.
The CSO has changed the methodology used to calculate FISIM to bring it into line with the European System of Accounts (ESA 2010) standards. A more detailed description of this new methodology is available at:
A quarterly national accounts release incorporating these latest annual results for the four quarters of 2016 and earlier years is also being published today. This includes an estimate for the first quarter of 2017. The previously published estimates for the quarters of earlier years are also revised.
is equal to the sum of the values of the goods and services (or parts thereof) produced in the country without deducting an amount in respect of capital consumption (i.e. depreciation). It excludes taxes on production and includes subsidies on production.
is equal to Gross Value Added at factor cost minus depreciation.
is equal to Gross Value Added at factor cost plus taxes on production less subsidies on production. It represents total expenditure on the output of goods and services produced in the country and valued at the prices at which the expenditure is incurred.
is equal to Gross Domestic Product at market prices plus net factor income from the rest of the world and represents the total of all payments for productive services accruing to the permanent residents of the country. Some income accrues to Irish residents as a result of economic activity abroad or property held abroad while some income arising in the state is paid to non-residents.
is equal to Gross National Product at market prices plus EU subsidies less EU taxes. This is more commonly described as being equal to Gross Domestic Product plus net primary incomes from abroad.
is equal to Gross National Income at current market prices less the factor income of redomiciled companies, less depreciation on research and development related intellectual property imports and less depreciation on aircraft related to aircraft leasing.
 Hide Background Notes
Scan the QR code below to view this release online or go to
http://www.cso.ie/en/releasesandpublications/er/nie/niear2016/
 Show Table A Main Aggregates, 2011-2016
 Hide Table A Main Aggregates, 2011-2016