
The CSO, through Ireland's Institute for SDGs (IIS), supports reporting on the Sustainable Development Goals.
SDG 14.1.1 (a) Index of Coastal Eutrophication and (b) Plastic Debris Density
SDG 14.2.1 Number of Countries Using Ecosystem-Based Approaches to Managing Marine Areas
SDG 14.3.1 Average Marine Acidity (Ph) Measured at Agreed Suite of Representative Sampling Stations
SDG 14.4.1 Proportion of Fish Stocks Within Biologically Sustainable Levels
SDG 14.1.1 (a) Index of coastal eutrophication is published by Eurostat. SDG 14.1.1 (b) Plastic debris density is published by OSPAR.
Indicator SDG 14.60 is part of the EU Sustainable Development Goals (SDG) indicator set. It is used to monitor progress towards SDG 14 on conserving and sustainably using the oceans, seas and marine resources for sustainable development, which is embedded in the European Commission’s Priorities under the 'European Green Deal'. SDG 14 aims to achieve conservation and sustainable use of oceans, seas and marine resources, and also aims to prevent and reduce marine pollution and the impact of ocean acidification. Indicator EU SDG 14.60 can be considered as similar to the global SDG indicator 14.1.1: (a) "Index of coastal eutrophication". The Marine Strategy Framework Directive (MSFD) requires member states to report on eutrophication for their regional seas.
The indicator EU SDG 14.60 shows the share of eutrophic marine waters in the Exclusive Economic Zone (EEZ). An area is classified as eutrophic if for more than 25% of the observation days of a given year the chlorophyll concentrations as a proxy for eutrophication are above the 90th percentile of the 1998–2017 reference base line. Eutrophication is the process by which an excess of nutrients – mainly phosphorus and nitrogen – leads to increased growth of plant material, particularly algal blooms, in an aquatic body resulting in a decrease in water quality. This can, in turn, cause death by hypoxia of aquatic organisms. Anthropogenic activities, such as farming, agriculture, aquaculture, industry and sewage, are the main source of nutrient input in problem areas. The Marine Strategy Framework Directive (MSFD) requires member states to report on eutrophication for their regional seas every 6 years. The Copernicus Marine Service has calculated the indicator from satellite imagery.
Based on the satellite imagery, indicator EU SDG 14.60 shows no marine waters were affected by eutrophication for Ireland between 2015 and 2020, see Table 4.1. However, in the succeeding section OSPAR (Oslo/Paris convention (for the Protection of the Marine Environment of the North-East Atlantic)) eutrophication is a different assessment (See Map 4.1).
OSPAR provides information on eutrophication status in areas assessed.
Eutrophication status in the OSPAR Maritime Area has improved since 1990, but eutrophication is still observed in 7% of the assessed area. The areas affected are mainly located in the south-eastern parts of the Greater North Sea, and in some coastal waters of the Celtic Sea and Bay of Biscay.
Map 4.1 shows the Eutrophication status in areas assessed in Arctic Waters, the Greater North Sea, Celtic Seas and the Bay of Biscay, 2006–2014 (The updated OSPAR assessment will be published as part of the OSPAR Quality Status Report (QSR) 2023).
For eutrophication, problem areas are indicated red, potential problem areas are yellow and non-problem areas are green.
For Ireland, Norway and the United Kingdom’s inshore and coastal waters the locations of problem areas and potential problem areas are illustrated with circles, because these assessed areas are too small to be seen if their actual area extent is mapped. White areas are not assessed.

OSPAR is the mechanism by which 15 Governments and the EU cooperate to protect the marine environment of the North-East Atlantic.
Information presented here is from OSPAR’s publication Composition and Spatial Distribution of Litter on the Seafloor.
The key message from this report is that litter is widespread on the seafloor across the area assessed, with plastic the predominant material encountered. Higher amounts of litter are found in the Eastern Bay of Biscay, Southern Celtic Seas and English Channel than in the northern Greater North Sea and Celtic Seas.
Map 4.2 shows the relative number of litter items per Km2 seafloor across the Greater North Sea, Celtic Seas and the Eastern Bay of Biscay, based on the number of items caught as by-catch in fisheries trawls.
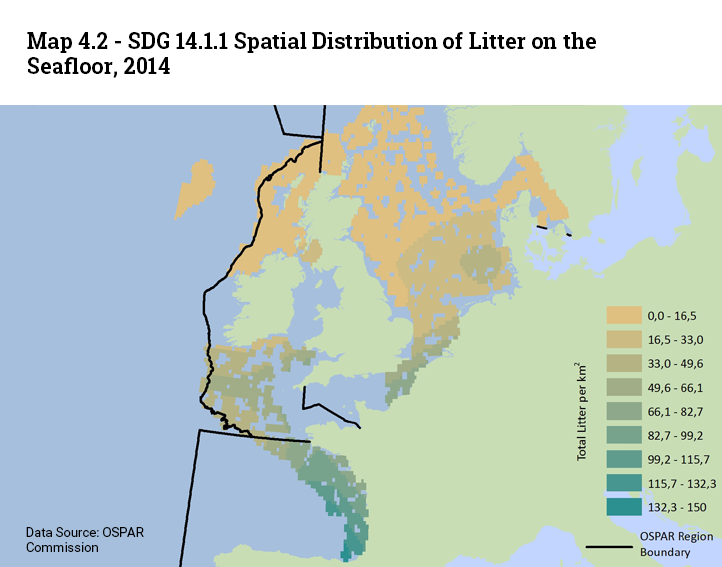
Widespread distribution of litter items, especially plastics, was discovered on the seafloor of the Greater North Sea, the Celtic Sea, the Bay of Biscay, the Iberian Coast and the Gulf of Cadiz.
The assessment mostly focuses on the Greater North Sea, Celtic Seas and Eastern Bay of Biscay (excluding the Iberian Coast and the Gulf of Cadiz) which were sampled with a Grande Ouverture Verticale (GOV) trawl (Note that this trawl is designed to catch fish, not to sample litter. The estimates give a relative indication of litter density).
For this area, the abundance of litter items (litter items per Km2) on the seafloor increases from north to south (See Map 4.2 above).
In 2014, of all litter items recorded the percentage of plastic items was 68% for the Greater North Sea, 58% for the Celtic Sea and 98% for the Eastern Bay of Biscay. Nearly all trawls in the Eastern Bay of Biscay contained at least one plastic item. The area also has the highest levels of recorded litter within the assessment area.
Details of the survey are available in OSPAR’s Composition and Spatial Distribution of Litter on the Seafloor.
SDG 14.2.1 Number of countries using ecosystem-based approaches to managing marine areas is published by the National Parks and Wildlife Service (NPWS).
Information presented here on Marine Habitats is extracted directly from the NPWS website as follows:
In Ireland, the 1992 EC Habitats Directive (92/43/EC), as transposed by the European Communities (Birds and Natural Habitats) Regulations 2011 (S.I. No. 477 of 2011), is currently the only legislative instrument providing protection to habitats in the marine environment. For habitats, this protection regime is applicable within the Exclusive Economic Zone (EEZ). Under this legislation, a series of habitats are identified for which Special Areas of Conservation (SACs) must be created and within which these habitats must be maintained at favourable conservation status.
These habitats include:
Favourable conservations status is achieved by ensuring the habitats’ national range, area, structure and function and future prospects are not adversely affected. Operations or activities proposed in or adjacent to SACs designated for these features must demonstrate they will not adversely affect the conservation status of these habitats.
Under the Wildlife Acts 1976 to 2018, Natural Heritage Areas (NHAs) may be established to protect habitats or species. While some terrestrial and coastal NHAs may encompass adjacent marine areas, no NHAs have been established for marine habitats to date.
Under the OSPAR Convention to Protect the Marine Environment of the North East Atlantic, Ireland committed to establishing marine protected areas to protect biodiversity (i.e., OSPAR Marine Protected Areas (MPAs)). No legislation is currently used in Ireland to legally underpin protected areas established to fulfil commitments under international conventions. Therefore, since the creation of OSPAR, MPAs would not afford any legal protection to the relevant areas on their own. Ireland (like other OSPAR contracting parties) established a number of its SACs as OSPAR MPAs for marine habitats.
In recent years, significant levels of survey work are being undertaken to investigate the structure, distribution and extent of these Annex I habitats in Irish SACs. From 2005-2009, a diving survey was undertaken to map the occurrence and distribution of some particularly sensitive biological communities (e.g., seagrass, maërl, sea pens, etc) that occur sub tidally in SACs designated for the Annex I habitat large shallow inlets and bays. In 2009, a national benthic survey commenced of all SACs designated for the habitats mentioned above to investigate their structure and function. This 3-4 year programme will lead to the development of site-specific conservation objectives and inform national monitoring and reporting efforts.
Marine Special Areas of Conservation and Special Protection Areas are shown in the Conservation chapter in this report. See Map 5.1 SDG 14.5.1 Coverage of Protected Areas in Relation to Marine Areas.
SDG 14.3.1 Average marine acidity (pH) measured at agreed suite of representative sampling stations - Information for this indicator is taken from the Final Report to OSPAR of the Joint OSPAR/ICES Ocean Acidification Study Group (SGOA) (2014).
OSPAR is the mechanism by which 15 Governments and the EU cooperate to protect the marine environment of the North-East Atlantic.
The Joint OSPAR/ICES Study Group on Ocean Acidification (SGOA) was formed in 2012 to address the eight specific terms of reference provided by OSPAR and adopted as a resolution by the ICES 2012 Annual Science Conference and Statutory Meeting. This follows on from previous ICES advice to OSPAR on ocean acidification (OA) monitoring in 2010 (ICES 2010). These terms of reference broadly related to developing harmonised monitoring and assessment capabilities for OA in the Northeast Atlantic taking account of current national, regional and global developments in the field and the current state of knowledge.
A number of nations are carrying out OA monitoring, with related research, in the OSPAR region and the wider North Atlantic. These activities were summarised by national members of SGOA. While this information may not be complete, it provides a good overview of diverse data-gathering activities. There are relevant monitoring/research activities (covering CO2 fluxes and a range of carbonate chemistry parameters, in addition to pH per se) in most, if not all, the OSPAR contracting parties.
Annex 4 of the report tabulates known OA observational activities in the Northeast Atlantic - the focus is on chemical parameters and is a continuation of work initiated for the ICES Cooperative.
Research report 'Chemical aspects of ocean acidification monitoring in the ICES marine area' (Hydes et al., 2013).
As part of a nationally funded project (2008–2011), the Irish Marine Institute and NUI Galway undertook a baseline study on the carbonate system in Irish coastal, shelf and off-shelf waters. Some initial pCO2 measurements and CO2 flux studies were undertaken at NUI Galway’s Mace Head station (a Global Atmospheric Watch station) and on board the RV Celtic Explorer. An initial assessment compared data obtained for the southern Rockall Trough with WOCE survey data from the same area in the 1990s. An increase in anthropogenic carbon (∆Cant) of ~1 μmol kg-1 yr-1 was estimated for subsurface winter-mixed layer waters of the Rockall Trough between 1991 and 2010. This equates to a calculated pH reduction of 0.02 pH units per decade (McGrath et al., 2012), in line with observations reported in other time-series for the North Atlantic.
Decreases in pH were also calculated for deeper water masses over the 19 year period including Labrador Seawater (LSW) at 1500–2000m deep a decrease in pH of ~0.015 units per decade was calculated.
Sampling of TA, DIC and nutrients on a hydrographic standard section on the shelf to the west of Ireland (53°N) and in the southern Rockall Trough has been continued (McGrath et al., 2013). TA, DIC sampling has also been included with ship based winter environmental sampling in Irish coastal and inshore shelf waters. A current project is investigating the carbonate chemistry of coastal and estuarine waters including seasonal aspects and riverine inputs (McGrath et al., 2016).
SDG 14.4.1 Proportion of fish stocks within biologically sustainable levels is published by the Marine Institute.
The Marine Institute launched the 2021 Stock Book in December 2021. This annual publication provides the latest impartial scientific advice on the status of 74 key fish stocks of interest to Ireland. It is available for download or through an interactive online application.
This is the 29th edition of the annual book, which also contains the latest management advice used by decision makers to set sustainable catch levels and fishing quotas for 2022. The publication is an invaluable reference guide to a wide audience, including the Department of Agriculture, Food and the Marine, the fishing industry, marine scientists, environmental NGOs, third level institutes and financial institutions.
In 2020, Irish vessels landed approximately 190,000 tonnes of wild caught fish worth more than €250 million at first sale. This supports a valuable processing industry and other activities in our coastal communities.
Ensuring long term sustainability is a key objective of the Common Fisheries Policy and all stakeholders. To that end, every year, the Marine Institute undertakes an extensive data collection programme - Every year, the RV Celtic Voyager and RV Celtic Explorer have facilitated scientific fisheries surveys, travelling approximately 23,776 nautical miles over 200 days, equating to 2,030 scientist days at sea.
Onshore and at sea sampling programmes measure over half a million fish and estimate age for a further 50,000 individuals across all commercial species. Irish data is compiled with that from other countries through the intergovernmental organisation International Council for the Exploration of the Seas (ICES). Marine Institute scientists play a key role in carrying out the assessments and developing the scientific evidence and advice at ICES. The Stock Book integrates the latest scientific advice from ICES with relevant information on Irish fisheries.
The Fisheries Ecosystems Advisory Services (FEAS) is one of six service areas of the Marine Institute. Their mission is to assess, research and advise on the marine fisheries resource in Irish Waters.
FEAS advise that number of sustainably fished stocks has increased from 33 (in 2020) to 35 (in 2021) out of 74 (47%). The number of stocks with biomasses higher than sustainable trigger reference levels has increased from 25 (in 2020) to 27 (in 2021) out of 74 (36%). There is gradual progress towards long-term sustainable utilisation of the resource base since 2012.
Table 4.2 summarises the fishing pressure status relative to FMSY of the 74 reference stocks and compares with the same evaluation presented in previous years’ Stock Books.
The number of sustainably fished stocks has increased to 35 (just under half the stocks evaluated 47%). The percentage (15%) and number of stocks (11) overfished has continued to decrease. The number of stocks with unknown status has remained the same at 28 (38%).
The fishing mortality rate (FMSY), which, if applied constantly, would result in Maximum Sustainable Yield (MSY). The largest annual catch that may be taken from a stock continuously without affecting the catch of future years - a constant long-term MSY is not a reality in most fisheries, where stock sizes vary with the strength of year classes moving through the fishery.
Details are in The Stock Book 2021: Annual Review of Fish Stocks in 2021 with Management Advice for 2022.
Eurostat provides information in EU SDG 14.30 on estimated trends in fishing pressure, by fishing area as shown in Table 4.3.
The indicator presents the model-based median value of fishing pressure (F/FMSY) in EU marine waters of the North-East Atlantic and adjacent seas (FAO area 27) and the Mediterranean and the Black Sea (FAO area 37) for which current fishing mortality (F) exceeds the estimated fishing mortality consistent with achieving maximum sustainable yield (FMSY). Fishing mortality is a measure for death or removal of fish from a population due to fishing.
The model-based median value of fishing pressure (F/FMSY) indicates the trend of exploitation - values below 1 indicate sustainable fishing levels. See Table 4.3.
Data published in the CSO's Fish Landings 2021 release contains data on fish landings by Irish vessels to Irish ports; Irish vessels to foreign ports; and foreign vessels to Irish ports. The Sea Fisheries Protection Authority Statistics Unit is responsible for collating all sea-fisheries data, particularly domestic and foreign landings by Irish vessels. Irish fishing vessels of 10 metres or longer are required to complete a logbook. Fishing vessels of less than 10 metres are not generally required to complete a fishing logbook so landing statistics are gathered using sales notes and gatherers documents. Aquaculture and angling are not included in this release.