
Your feedback can help us improve and enhance our services to the public. Tell us what matters to you in our online Customer Satisfaction Survey.
| Indicator | Q4 2018 | Q4 2019 | Annual change | Annual change (%) |
| Employees reporting earning less than National Minimum Wage | 24,500 | 21,900 | -2,600 | -10.6 |
| Employees reporting earning National Minimum Wage | 112,700 | 100,800 | -11,900 | -10.6 |
| Total employees reporting earning National Minimum Wage or less | 137,200 | 122,800 | -14,400 | -10.5 |
| Employees reporting earning more than National Minimum Wage | 1,679,600 | 1,787,400 | 107,800 | 6.4 |
| Not stated | 133,300 | 107,800 | -25,500 | -19.1 |
| Total employees | 1,950,100 | 2,018,100 | 67,900 | 3.5 |
| Proportion of employees reporting earning National Minimum Wage or less (%)1 | 7.6 | 6.4 | - | - |
| 1 Note: Denominator excludes employees whose National Minimum Wage status was Not stated | ||||
In Quarter 4 (Q4) 2019, 6.4% of employees for whom earnings data was reported, earned the National Minimum Wage (NMW) or less. This was down from 7.6% in Q4 2018. See table 1b.
The number of employees who self-reported earning less than the NMW in Q4 2019 was 21,900 and this was down by 2,600 (-10.6%) from Q4 2018. The number of employees who self-reported earnings equal to the NMW was 100,800 and this was down 11,900 (-10.6%) from a year earlier. In total therefore, 122,800 employees self-reported that they earned the NMW or less in Q4 2019 and this was down 14,400 (-10.5%) from Q4 2018. See tables 1a and 1b.
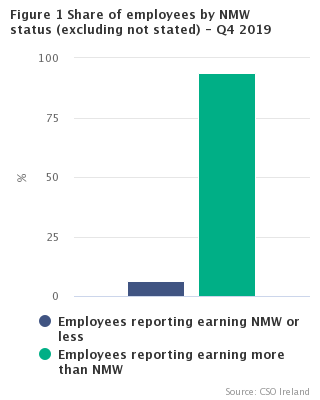
The proportion of employees who reported earning more than the NMW was 93.6%, up from 92.4% a year earlier. See table 1a and 1b and figure 1.
|
This release presents results based on questions relating to the National Minimum Wage (NMW) included in the Labour Force Survey (LFS) from Q2 2016. The LFS is not designed to be an earnings survey; rather it is the official source of employment and unemployment statistics in Ireland and is conducted across a representative sample of households throughout the country. Therefore, the earnings data in this release is based on each respondent self-reporting their income and as a result some caution is urged in the interpretation of this data. In addition, as the data presented in the release is collected directly from individual respondents, caution is urged in comparing these results to data collected directly from business enterprises. As a number of respondents did not report their status with regard to the NMW, these respondents are identified as ‘Not stated’ in the relevant data tables and are excluded from the denominator in calculating the share or proportion of all respondents on the NMW. |
Females more likely than males to earn NMW or less
The results show that females are more likely than males to earn the NMW or less and this has been a consistent feature of the series since it began in Q2 2016. Of the 122,800 employees who reported earning the NMW or less in Q4 2019, 66,600 or 54.2% were female while 56,200 or 45.8% were male. This compares to an overall even split of all employees in the State of 50.0% each for males and females. The greater share (9,300 or 64.6%) of the fall of 14,400 in the number of persons who reported earning the NMW or less in the year to Q4 2019 was accounted for by females. See tables 3a and 3b.
In total, 5.9% of all male employees in the State earned the NMW or less in Q4 2019 and the corresponding figure for females was 7.0%. See tables 3a and 3b and figure 2.