| Indicator | Q1 2018 | Q1 2019 | Annual change | Annual change (%) |
| Employees reporting agency worker status | 56,600 | 50,400 | -6,200 | -11.0 |
| Employees reporting non-agency worker status | 1,793,300 | 1,904,300 | 111,000 | 6.2 |
| Not stated | 17,600 | 12,200 | -5,400 | -30.7 |
| Total employees | 1,867,500 | 1,966,800 | 99,300 | 5.3 |
| Proportion of employees reporting agency worker status (%)1 | 3.1 | 2.6 | - | - |
| 1 Note: Denominator excludes employees whose agency worker status was Not stated | ||||
This release presents results of an analysis of employees in the Labour Force Survey who self-reported as being in the paid employment of an employment agency and are thus referred to as ‘agency workers’ in this release.
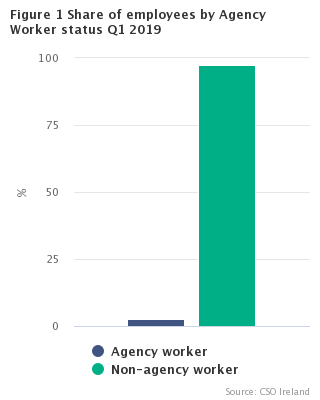
In Q1 2019, 2.6% of employees were classified as agency workers. This was down from 3.1% in Q1 2018.
The number of employees who reported as being an agency worker was 50,400 a decrease of 6,200 (-11.0%) from Q1 2018.
The proportion of employees who reported not being an agency worker was 97.4%, up from 96.9% a year earlier. See tables 1a and 1b and figure 1.
Agency workers more likely to be female than male
The results showed that in Q1 2019, agency workers were more likely to be female rather than male. Of the 50,400 employees who were agency workers in Q1 2019, 26,200 or 52.0% were female while 24,200 or 48.0% were male. This compares to an overall even split of all employees in the State of 50.0% each for males and females. The greater share (59.7%) of the fall of 6,200 in the number of agency workers in the year to Q1 2019 was accounted for by males. See table 2a and 2b and figure 2.
In Q1 2019, 2.5% of all male employees in the State were agency workers while the corresponding figure for females was 2.7%. See table 2b.