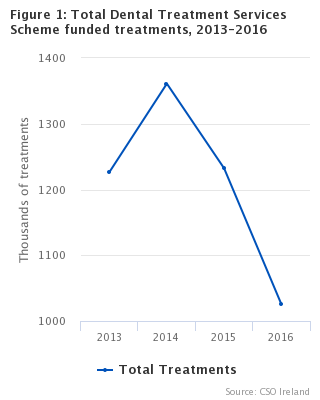
The number of Health Service Executive (HSE) funded treatments under the Dental Treatment Services Scheme (DTSS) fell from 1,227.0 thousand in 2013 to 1,025.6 thousand in 2016, a 16.4% reduction.
These payments were paid for by the Primary Care Reimbursement Service (PCRS).Please see background notes for a further description of the PCSR and DTSS.
Summary Points
In 2016, 566.5 thousand publicly funded dental treatments were carried out on females compared with 459.1 thousand on males. The corresponding figures for 2013 are 638.5 thousand and 528.3 thousand respectively. See Table 1 and Figure 1.
The South HSE region had the highest number of publicly funded dental treatments in 2016, with 312.1 thousand. The lowest number of treatments was carried out in the Dublin North-East region, where 206.4 thousand were carried out.
Oral examinations are the most commonly carried out dental procedure, accounting for over 30% of all publicly-funded treatments each year. The second most commonly performed treatment is Restoration using amalgam filling, which makes up approximately 20% of the total number of treatments each year. Apicectomy/amputation of roots is the least carried out treatment, with less than 0.5% of the total number of treatments. Exodontics, which is the removal of a tooth or teeth, has remained relatively constant at approximately 9.8% of total treatments each year. See Table 2.
Exodontics and surgical extractions were carried out more commonly on males (73.9 thousand combined) than on females (71.6 thousand combined) in 2016. A greater number of oral examinations were carried out on females (211.1 thousand) than on males (175.8 thousand) in the same period. See Table 3.
The number of treatments in the upper part of the mouth was 269.2 thousand in 2016, which is down from 336.9 thousand in 2013. The corresponding totals for the lower part of the mouth are 199.0 and 246.0 thousand respectively. See Table 4.