
| Seasonally Adjusted Retail Sales Index - All Businesses | ||
| (Base Year 2005 = 100) | ||
| Volume Index | Value Index | |
| December 2015 | 110.0 | 97.5 |
| November 2016 | 114.5 | 99.2 |
| December 2016 | 113.7 | 98.6 |
| Monthly % change | -0.7 | -0.6 |
| Annual % change | 3.4 | 1.2 |
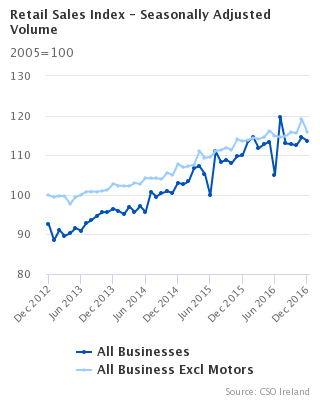
Seasonally adjusted, the volume of retail sales decreased by 0.7% in the month of December, with an annual increase of 3.4%. (See Table 1). If Motor Trades are excluded, there was a decrease of 2.7% in the volume of retail sales in December 2016 when compared with November 2016 and there was an increase of 2.0% in the annual figure. (See Table 2).
The sectors with the largest monthly volume decreases were Electrical goods (-22.7%), Hardware, Paints & Glass (-4.1%) and Fuel (-2.4). (See Table 3). The sector with the largest month on month volume increase was Non-Specialised Stores (+0.9%).
There was a decrease of 0.6% in the value of retail sales in December 2016 when compared with November 2016 and there was an annual increase of 1.2% when compared with December 2015. If Motor Trades are excluded, there was a decrease of 1.6% in the value of retail sales and an annual increase of 0.2%.
Provisional estimates for the year 2016 show that the volume of Retail Sales increased by 5.9% in 2016 when compared to 2015 and by 3.8% in value terms. If Motor Trades are excluded, there was an increase of 4.3% in the volume of retail sales and an increase of 2.1% in the value.
Unadjusted indices are available on CSO Statbank.
| Business Sectors | Annual | Monthly |
|---|---|---|
| All Businesses | 3.4 | -0.7 |
| All Businesses excl. Motor Trades | 2 | -2.7 |
| All Businesses excl. Motor Trades & Bars | 2.1 | -2.7 |
| Motors & Fuel | 6.9 | -1 |
| All Businesses excl. Motor Trades, Fuel & Bars | 2.4 | -2.2 |
| Food Businesses | 1.5 | 0.6 |
| Non-Food (excl. Motor trades, Fuel & Bars) | 3.3 | -4.6 |
| Household Equipment | 3.9 | -9.6 |
| Books, Newspapers Stationery & Other Goods | 2.6 | -1.2 |
| Table 1 Seasonally Adjusted Indices of Total Retail Sales 1 | |||||||||
| Base Year: 2005=100 | |||||||||
| Total Retail Sales for all Businesses Combined | |||||||||
| Period | Value of Sales | Volume of Sales | |||||||
| % change on previous period | % change on previous period | ||||||||
| Annual % change | Annual % change | ||||||||
| Index | Index | ||||||||
| 2013 | Year | 87.7 | -0.2 | -0.2 | 92.7 | 0.7 | 0.7 | ||
| 2014 | Year | 91.3 | 4.1 | 4.1 | 98.6 | 6.4 | 6.4 | ||
| 2015 | Year | 95.8 | 4.9 | 4.9 | 106.7 | 8.2 | 8.2 | ||
| 2016 | Year2 | 99.4 | 3.8 | 3.8 | 113.0 | 5.9 | 5.9 | ||
| 2015 | 1st quarter | 94.6 | 1.8 | 5.2 | 104.4 | 2.8 | 8.7 | ||
| 2nd quarter | 94.7 | 0.1 | 5.1 | 103.8 | -0.6 | 8.0 | |||
| 3rd quarter | 97.1 | 2.6 | 5.3 | 109.3 | 5.3 | 9.0 | |||
| 4th quarter | 97.0 | -0.1 | 4.4 | 109.3 | 0.0 | 7.6 | |||
| 2016 | 1st quarter | 100.6 | 3.7 | 6.3 | 113.1 | 3.5 | 8.3 | ||
| 2nd quarter | 98.1 | -2.5 | 3.6 | 110.0 | -2.8 | 6.0 | |||
| 3rd quarter | 100.1 | 2.1 | 3.1 | 114.9 | 4.5 | 5.2 | |||
| 4th quarter2 | 98.7 | -1.5 | 1.7 | 113.6 | -1.2 | 3.9 | |||
| 2015 | July | 97.9 | 5.4 | 6.3 | 110.9 | 11.1 | 10.1 | ||
| August | 96.7 | -1.2 | 5.0 | 108.3 | -2.4 | 8.8 | |||
| September | 96.8 | 0.1 | 4.7 | 108.8 | 0.5 | 8.4 | |||
| October | 96.0 | -0.8 | 3.7 | 108.0 | -0.7 | 7.1 | |||
| November | 97.4 | 1.4 | 5.7 | 109.8 | 1.6 | 9.2 | |||
| December | 97.5 | 0.1 | 4.0 | 110.0 | 0.2 | 6.7 | |||
| 2016 | January | 102.4 | 5.1 | 9.3 | 113.5 | 3.2 | 10.6 | ||
| February | 101.1 | -1.3 | 8.4 | 114.5 | 0.9 | 10.7 | |||
| March | 98.6 | -2.4 | 2.5 | 111.8 | -2.4 | 4.7 | |||
| April | 99.1 | 0.5 | 2.5 | 112.8 | 0.9 | 5.2 | |||
| May | 99.8 | 0.7 | 5.0 | 113.4 | 0.6 | 7.7 | |||
| June | 95.9 | -3.9 | 3.3 | 105.0 | -7.4 | 5.2 | |||
| July | 103.3 | 7.7 | 5.5 | 119.6 | 13.9 | 7.8 | |||
| August | 98.9 | -4.3 | 2.2 | 113.0 | -5.5 | 4.3 | |||
| September | 98.5 | -0.4 | 1.7 | 112.8 | -0.2 | 3.7 | |||
| October | 98.1 | -0.4 | 2.1 | 112.5 | -0.3 | 4.1 | |||
| November | 99.2 | 1.1 | 1.8 | 114.5 | 1.8 | 4.3 | |||
| December2 | 98.6 | -0.6 | 1.2 | 113.7 | -0.7 | 3.4 | |||
| 1Based on Seasonal Patterns up to December 2016 | |||||||||
| 2Provisional value and volume of sales indices based on early returns from sample retailers | |||||||||
| Table 2 Seasonally Adjusted Indices of Total Retail Sales (Excluding Motor Trades)1 | |||||||||
| Base Year: 2005=100 | |||||||||
| Total Retail Sales for all Businesses Combined (Excl Motor Trades) | |||||||||
| Period | Value of Sales | Volume of Sales | |||||||
| % change on previous period | % change on previous period | ||||||||
| Annual % change | Annual % change | ||||||||
| Index | Index | ||||||||
| 2013 | Year | 96.3 | -0.1 | -0.1 | 100.9 | 0.8 | 0.8 | ||
| 2014 | Year | 97.8 | 1.6 | 1.6 | 104.6 | 3.7 | 3.7 | ||
| 2015 | Year | 100.4 | 2.7 | 2.7 | 111.0 | 6.1 | 6.1 | ||
| 2016 | Year2 | 102.5 | 2.1 | 2.1 | 115.8 | 4.3 | 4.3 | ||
| 2015 | 1st quarter | 98.0 | 0.0 | 1.1 | 107.3 | 1.0 | 4.9 | ||
| 2nd quarter | 100.3 | 2.3 | 3.1 | 109.9 | 2.5 | 6.3 | |||
| 3rd quarter | 100.5 | 0.3 | 3.3 | 111.5 | 1.4 | 7.1 | |||
| 4th quarter | 101.2 | 0.6 | 3.2 | 113.0 | 1.4 | 6.4 | |||
| 2016 | 1st quarter | 102.1 | 0.9 | 4.1 | 114.1 | 0.9 | 6.4 | ||
| 2nd quarter | 102.6 | 0.5 | 2.3 | 115.2 | 1.0 | 4.8 | |||
| 3rd quarter | 101.9 | -0.7 | 1.3 | 115.1 | -0.1 | 3.3 | |||
| 4th quarter2 | 102.3 | 0.4 | 1.1 | 116.8 | 1.4 | 3.3 | |||
| 2015 | July | 100.7 | 0.9 | 3.2 | 111.0 | 1.4 | 6.6 | ||
| August | 100.6 | -0.1 | 3.1 | 111.3 | 0.3 | 6.9 | |||
| September | 100.4 | -0.2 | 3.7 | 111.9 | 0.5 | 7.7 | |||
| October | 100.1 | -0.3 | 2.0 | 111.4 | -0.5 | 5.5 | |||
| November | 101.8 | 1.7 | 4.7 | 114.0 | 2.3 | 8.6 | |||
| December | 101.6 | -0.2 | 2.9 | 113.6 | -0.4 | 5.4 | |||
| 2016 | January | 102.2 | 0.7 | 4.6 | 113.8 | 0.2 | 6.4 | ||
| February | 102.3 | 0.0 | 4.5 | 114.4 | 0.6 | 6.7 | |||
| March | 101.8 | -0.5 | 3.5 | 114.1 | -0.3 | 6.0 | |||
| April | 102.0 | 0.2 | 0.8 | 114.5 | 0.4 | 3.1 | |||
| May | 103.8 | 1.8 | 3.7 | 116.2 | 1.4 | 6.2 | |||
| June | 102.2 | -1.5 | 2.5 | 114.9 | -1.1 | 4.9 | |||
| July | 102.0 | -0.3 | 1.3 | 114.6 | -0.3 | 3.2 | |||
| August | 101.7 | -0.3 | 1.1 | 114.8 | 0.2 | 3.1 | |||
| September | 101.9 | 0.2 | 1.5 | 115.8 | 0.8 | 3.4 | |||
| October | 101.9 | 0.0 | 1.8 | 115.6 | -0.2 | 3.8 | |||
| November | 103.4 | 1.5 | 1.5 | 119.0 | 3.0 | 4.4 | |||
| December2 | 101.7 | -1.6 | 0.2 | 115.9 | -2.7 | 2.0 | |||
| 1Based on Seasonal Patterns up to December 2016 | |||||||||
| 2Provisional value and volume of sales indices based on early returns from sample retailers | |||||||||
| Table 3 Seasonally Adjusted1 Value and Volume Indices of Retail Sales for 13 Retail Businesses2 - Provisional Results December 2016 | |||||||
| (Provisional Estimates) | Base Year: 2005=100 | ||||||
| December 2016 | |||||||
| Retail Business - NACE REV 2 | Value of Sales | Volume of Sales | |||||
| Monthly % change | Annual % change | Monthly % change | Annual % change | ||||
| Index | Index | ||||||
| Motor Trades3 | 87.8 | -1.1 | 7.4 | 103.7 | -0.9 | 9.8 | |
| Non-Specialised Stores | 129.4 | 0.7 | 0.6 | 130.8 | 0.9 | 1.9 | |
| (excluding Department Stores) | |||||||
| Department Stores | 91.5 | -2.3 | -3.2 | 132.9 | -2.2 | 0.1 | |
| Food beverages & Tobacco | 84.1 | -1.1 | -4.1 | 84.4 | -1.1 | -2.5 | |
| Fuel | 100.1 | -2.2 | 1.3 | 80.7 | -2.4 | 0.2 | |
| Pharmaceuticals Medical & Cosmetic Articles | 101.1 | -0.7 | -0.1 | 118.0 | -0.7 | 1.4 | |
| Clothing, Footwear & Textiles | 90.4 | -1.3 | 1.9 | 142.8 | -0.5 | 5.8 | |
| Furniture and Lighting | 71.4 | -2.0 | 3.1 | 127.0 | -1.6 | 9.3 | |
| Hardware, Paints & Glass | 79.6 | -4.4 | -1.0 | 90.0 | -4.1 | 2.1 | |
| Electrical Goods | 75.0 | -22.7 | -4.2 | 175.4 | -22.7 | 2.4 | |
| Books, Newspapers and Stationery | 63.2 | -0.6 | -3.7 | 54.3 | -1.0 | -4.1 | |
| Other Retail Sales | 80.3 | -1.4 | -0.5 | 121.8 | -1.6 | 3.4 | |
| Bars | 82.0 | -0.2 | 3.0 | 70.2 | -0.4 | 2.1 | |
| All Businesses excl. Motor Trades | 101.7 | -1.6 | 0.2 | 115.9 | -2.7 | 2.0 | |
| All Businesses | 98.6 | -0.6 | 1.2 | 113.7 | -0.7 | 3.4 | |
| Of which:- | |||||||
| Combined Groups | |||||||
| All Businesses excl Motor Trades & Bars | 104.5 | -1.2 | -0.1 | 122.0 | -2.7 | 2.1 | |
| Motors & Fuel | 89.3 | -1.3 | 6.0 | 97.4 | -1.0 | 6.9 | |
| All Bus. Excl. Motor Trades, Fuel & Bars | 104.9 | -1.0 | -0.1 | 126.1 | -2.2 | 2.4 | |
| Food Businesses | 125.4 | 0.5 | 0.3 | 126.4 | 0.6 | 1.5 | |
| Non-Food (Excl Motor Trades, Fuel & Bars) | 85.0 | -3.8 | -0.5 | 124.9 | -4.6 | 3.3 | |
| Household Equipment | 76.4 | -8.7 | -1.4 | 135.3 | -9.6 | 3.9 | |
| Books, Newspapers Stationery & Other Goods | 77.6 | -0.1 | -1.0 | 110.0 | -1.2 | 2.6 | |
| 1Based on Seasonal Patterns up to December 2016, individual series are independently adjusted | |||||||
| 2See Background Notes for further detail | |||||||
| 3See Seasonal Adjustment in Background Notes | |||||||
| Table 4 Seasonally Adjusted1 Value and Volume Indices of Retail Sales for 13 Retail Businesses2 - Final Results November 2016 | |||||||
| Base Year: 2005=100 | |||||||
| November 2016 | |||||||
| Retail Business - NACE REV 2 | Value of Sales | Volume of Sales | |||||
| Monthly % change | Annual % change | Monthly % change | Annual % change | ||||
| Index | Index | ||||||
| Motor Trades3 | 88.8 | -0.8 | 4.4 | 104.6 | -0.7 | 6.2 | |
| Non-Specialised Stores | 128.5 | -0.3 | -0.2 | 129.6 | 0.1 | 1.0 | |
| (excluding Department Stores) | |||||||
| Department Stores | 93.7 | -0.0 | -0.9 | 135.9 | 0.2 | 1.4 | |
| Food beverages & Tobacco | 85.1 | 1.2 | 2.1 | 85.3 | 1.4 | 3.6 | |
| Fuel | 102.3 | 2.6 | 6.6 | 82.7 | 0.8 | 6.1 | |
| Pharmaceuticals Medical & Cosmetic Articles | 101.8 | 0.7 | 1.4 | 118.8 | 2.0 | 3.9 | |
| Clothing, Footwear & Textiles | 91.5 | 1.2 | 5.9 | 143.5 | 1.7 | 9.0 | |
| Furniture and Lighting | 72.8 | 3.0 | 6.7 | 129.1 | 3.5 | 13.3 | |
| Hardware, Paints & Glass | 83.2 | 2.4 | 6.2 | 93.8 | 2.8 | 9.3 | |
| Electrical Goods | 97.1 | 16.4 | 6.1 | 226.8 | 16.9 | 13.4 | |
| Books, Newspapers and Stationery | 63.5 | 0.1 | -2.4 | 54.8 | 0.7 | -2.1 | |
| Other Retail Sales | 81.5 | 4.3 | 1.2 | 123.8 | 3.3 | 6.9 | |
| Bars | 82.2 | -1.7 | 2.9 | 70.4 | -1.0 | 2.1 | |
| All Businesses excl. Motor Trades | 103.4 | 1.5 | 1.5 | 119.0 | 3.0 | 4.4 | |
| All Businesses | 99.2 | 1.1 | 1.8 | 114.5 | 1.8 | 4.3 | |
| Of which:- | |||||||
| Combined Groups | |||||||
| All Businesses excl Motor Trades & Bars | 105.7 | 1.2 | 1.2 | 125.4 | 3.4 | 4.6 | |
| Motors & Fuel | 90.4 | 0.7 | 4.8 | 98.4 | 0.3 | 5.7 | |
| All Bus. Excl. Motor Trades, Fuel & Bars | 106.0 | 0.9 | 0.9 | 128.9 | 3.1 | 4.3 | |
| Food Businesses | 124.8 | -0.0 | -0.1 | 125.7 | 0.1 | 1.1 | |
| Non-Food (Excl Motor Trades, Fuel & Bars) | 88.4 | 2.9 | 2.5 | 130.8 | 3.7 | 6.9 | |
| Household Equipment | 83.7 | 4.6 | 5.4 | 149.6 | 6.0 | 11.6 | |
| Books, Newspapers Stationery & Other Goods | 77.7 | 3.0 | 0.1 | 111.4 | 3.7 | 6.0 | |
| 1Based on Seasonal Patterns up to December 2016, individual series are independently adjusted | |||||||
| 2See Background Notes for further detail | |||||||
| 3See Seasonal Adjustment in Background Notes | |||||||
| Table 5 Seasonally Adjusted1 Value and Volume Indices of Retail Sales for 13 Retail Businesses2 - 3 Monthly Provisional Estimates | |||||||
| (Provisional Estimates) | Base Year: 2005=100 | ||||||
| October 2016 - December 2016 | |||||||
| Retail Business - NACE REV 2 | Value of Sales | Volume of Sales | |||||
| % change on previous period | Annual % change | % change on previous period | Annual % change | ||||
| Index | Index | ||||||
| Motor Trades3 | 88.6 | -4.1 | 5.5 | 104.4 | -3.6 | 7.5 | |
| Non-Specialised Stores | 128.9 | -0.5 | 0.5 | 130.0 | -0.0 | 1.7 | |
| (excluding Department Stores) | |||||||
| Department Stores | 92.8 | 1.9 | 0.0 | 134.7 | 3.1 | 2.7 | |
| Food beverages & Tobacco | 84.4 | 0.6 | -0.4 | 84.6 | 1.3 | 1.1 | |
| Fuel | 100.7 | 3.1 | 3.9 | 81.7 | 0.2 | 3.5 | |
| Pharmaceuticals Medical & Cosmetic Articles | 101.4 | 0.5 | 1.0 | 117.7 | 2.8 | 2.8 | |
| Clothing, Footwear & Textiles | 90.7 | 0.6 | 2.4 | 142.5 | 2.4 | 5.7 | |
| Furniture and Lighting | 71.6 | 1.7 | 4.0 | 127.0 | 4.1 | 10.2 | |
| Hardware, Paints & Glass | 81.2 | 1.0 | 2.8 | 91.5 | 2.0 | 5.8 | |
| Electrical Goods | 84.4 | -0.4 | 0.8 | 196.9 | 1.2 | 7.7 | |
| Books, Newspapers and Stationery | 63.4 | -1.1 | -2.8 | 54.5 | -1.3 | -3.1 | |
| Other Retail Sales | 80.0 | 3.7 | 0.2 | 121.8 | 4.3 | 5.4 | |
| Bars | 82.6 | 0.4 | 3.5 | 70.5 | 0.3 | 2.6 | |
| All Businesses excl. Motor Trades | 102.3 | 0.4 | 1.1 | 116.8 | 1.4 | 3.3 | |
| All Businesses | 98.7 | -1.5 | 1.7 | 113.6 | -1.2 | 3.9 | |
| Of which:- | |||||||
| Combined Groups | |||||||
| All Businesses excl Motor Trades & Bars | 104.9 | 0.3 | 0.8 | 122.8 | 1.5 | 3.4 | |
| Motors & Fuel | 89.8 | -3.2 | 5.2 | 97.9 | -6.5 | 6.2 | |
| All Bus. Excl. Motor Trades, Fuel & Bars | 105.3 | -0.1 | 0.6 | 126.6 | 1.3 | 3.4 | |
| Food Businesses | 125.0 | -0.5 | 0.5 | 126.0 | -0.0 | 1.6 | |
| Non-Food (Excl Motor Trades, Fuel & Bars) | 86.3 | 1.2 | 1.1 | 127.1 | 2.6 | 5.1 | |
| Household Equipment | 79.8 | -0.3 | 1.9 | 141.5 | 0.8 | 7.5 | |
| Books, Newspapers Stationery & Other Goods | 77.0 | 2.4 | -0.5 | 109.6 | 4.2 | 4.5 | |
| 1Based on Seasonal Patterns up to December 2016, individual series are independently adjusted | |||||||
| 2See Background Notes for further detail | |||||||
| 3See Seasonal Adjustment in Background Notes | |||||||
An updated Retail Sales Index (RSI) was introduced in the February 2009 release. The underlying methodology remains unchanged. The index is primarily intended to measure short-term trends. For long term analysis, allowance must be made for the fact that the series does not reflect changes in retail structures between updates.
The November 2016 period covers the 4 weeks from 30/10/16 to 26/11/16, and the December 2016 period covers the 5 weeks from 27/11/16 to 31/12/16.
This set of monthly retail sales indices has been compiled with reference to base year 2005=100. The underlying structural weighting system is mainly based on the 2005 Annual Services Inquiry. Weights are updated from year to year using ratios of average weekly turnover by size class within business type.
The Retail Sales Index covers, on a sample basis, the retail sales of retail businesses, wholesale businesses with sizeable retailing activity, and the separate sales establishments of non-distribution enterprises. Excluded from the index coverage are the direct retail sales from non-distribution establishments together with the incidental retail sales of wholesale businesses. Also excluded are sales by hawkers, street stalls, and other retailing activities not conducted from permanent business premises. The statistical unit used for reporting sales figures in this inquiry is the enterprise (i.e. complete business covering all branches).
The business categories are based mainly on the Statistical Classification of Economic Activities in the European Community (NACE Rev. 2). The index system is structured on the retailing enterprises covered in the 2005 Annual Services Inquiry classified by 13 retail business categories and four turnover (excluding VAT) ranges. The following NACE Rev.2 categories apply:
For a full NACE Rev2 breakdown of the above categories see attached link:
The value indices are calculated by updating the aggregate 2005 retail turnover (including VAT) of these enterprises in these cells using the monthly retail sales data provided by the enterprise respondent panel from 2005 onwards.
The compilation of the index for a current month is based on the percentage change in average weekly sales in these cells over the corresponding monthly period of the previous year. The monthly volume indices are calculated by deflating the seasonally unadjusted value indices by specially constructed retail price indices derived from the Consumer Price Index (CPI). A copy of the Retail Sales Index methodology is available on our website (www.cso.ie).
All Retail Sales “unadjusted” series are trading day adjusted as they are based on either a standardised four or five week reporting period (see reference period note above). Seasonal adjustment is conducted using the direct seasonal adjustment approach. Under this approach each individual series is independently adjusted, e.g. aggregate series are adjusted without reference to the component series. Each individual seasonally adjusted series is calculated based on unadjusted data spanning from January 2005 to the current period.
The adjustments are completed by applying the X-12-ARIMA model, developed by the U.S. Census Bureau, to the unadjusted data. This methodology estimates seasonal factors while also taking into consideration factors that impact on the quality of the seasonal adjustment, such as:
A detailed description of the Retail Sales Index is available on the CSO website http://www.cso.ie/en/surveysandmethodology/services/retailsalesindexsurveys/retailsalesindex/ Retrospective details for the current and previous series are also available on the CSO website.
 Hide Background Notes
Scan the QR code below to view this release online or go to
http://www.cso.ie/en/releasesandpublications/er/rsi/retailsalesindexdecember2016/
 Show Table 1 Seasonally Adjusted Indices of Total Retail Sales
 Hide Table 1 Seasonally Adjusted Indices of Total Retail Sales