
The Greater Dublin Area will see its population increase by just over 400,000 by 2031 if internal migration patterns return to the traditional pattern last observed in the mid-1990s. This increase would account for two thirds of the total projected population growth in the state over this period under the M2F2 scenario (613,000).
Alternatively, a modified 2011 internal migration pattern of more focused net inflow into Dublin would result in Dublin absorbing a greater share of this GDA growth, increasing by 286,000 of the total projected growth compared with just 110,000 in the Mid-East.
Results from the 2011 Census showed a return to a small net inflow into Dublin marking a change from patterns observed in 2002 and 2006 when Dublin witnessed a large net outflow to the neighbouring regions. The census also showed a fall in the total number of movers between regions from 76,182 in 2006 to just 54,246 in 2011.
The main findings of the regional population projections are:
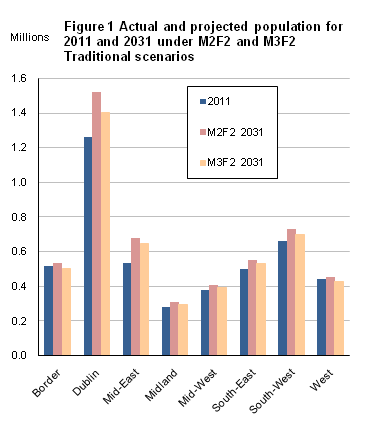
This release contains projections for the eight Regional Authority areas for 2016-2031. The assumptions used in relation to regional fertility, mortality trends and external migration from and to each region are consistent with those used at national level and published in April 2013. Three internal migration scenarios are examined, namely, “Recent”, “Traditional” and “Modified” (see section on Assumptions below).
Of the six scenarios in the national projections only M2F2 and M3F2 are considered for the regional projections. This results in six variants for the regional data, namely M2F2 for Recent, Traditional and Modified, and M3F2 for Recent, Traditional and Modified. The analysis in the following pages concentrates mainly on the M2F2 Traditional variant which combines a slow return to net inward migration with steadily falling fertility and a return to the traditional (1996) pattern of internal migration by 2016.
| Table 1 Actual and projected population of Regional Authority areas1, 2011 and 2031 (M2F2 Traditional) | ||||||||
| Regional Authority area | Population 2011 | Natural increase | Internal migration | External migration | Total increase | Population 2031 | Average annual increase | |
| Thousands | % | |||||||
| Border | 516 | 49 | -22 | -9 | 18 | 533 | 0.2 | |
| GDA | 1,795 | 298 | 92 | 11 | 401 | 2,197 | 1.0 | |
| Dublin | 1,262 | 188 | 47 | 23 | 257 | 1,519 | 0.9 | |
| Mid-East | 534 | 110 | 45 | -11 | 144 | 678 | 1.2 | |
| Midland | 284 | 39 | -21 | 7 | 25 | 309 | 0.4 | |
| Mid-West | 378 | 43 | -10 | -1 | 32 | 410 | 0.4 | |
| South-East | 499 | 58 | -16 | 9 | 51 | 550 | 0.5 | |
| South-West | 662 | 80 | -18 | 8 | 71 | 733 | 0.5 | |
| West | 441 | 31 | -6 | -10 | 15 | 456 | 0.2 | |
| State | 4,575 | 598 | 0 | 15 | 613 | 5,188 | 0.6 | |
| 1Defined in Background Notes. | ||||||||
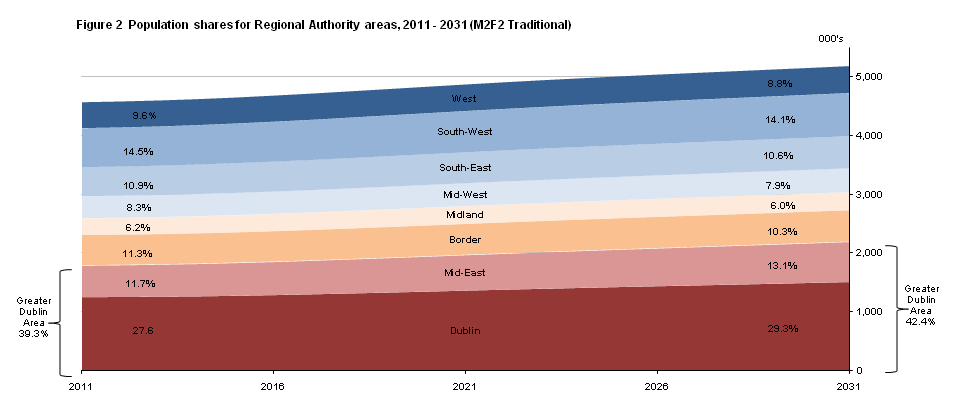
Regional population shares
In 2011 Dublin accounted for 27.6 per cent of the total population while the Mid-East represented 11.7 per cent of the total. This compares with just over 25.0 per cent for Dublin and 6.7 per cent for the Mid-East fifty years earlier. Over the 50-year period from 1961 to 2011 this increase in share of total population for Dublin and the Mid-East was at the expense of all other regions, which lost population share.
Under the M2F2 scenario the total population is projected to increase by 613,000 by 2031. If a return to the Traditional pattern of internal migration is experienced then the Greater Dublin Area (Dublin and Mid-East) is projected to grow by 401,400. This will account for 42.4 per cent of the total population by 2031 (see Figure 2). Within this scenario the population of the Mid-East will show an annual average increase of 1.2 per cent while Dublin will grow by 0.9 per cent (on an annual average basis) over the twenty year period. The population of all other regions will increase more slowly over the same period growing by between 0.2 per cent (Border and West) and 0.5 per cent (South-East and South-West) on an annual average basis and as a result will lose population share.
The number of births in a particular period is a function of both the number of women of child bearing age (15-49 years) and the fertility levels of these women. Over 90 per cent of births are to women aged 20-39 years and Table 2 shows the projected change in the number of women in this age group.
Under the M2F2 Traditional scenario fertility is projected to fall from its 2010 level of 2.1 to 1.8 by 2026, and remain steady thereafter. This falling fertility, combined with the projected decline of 81,000 in the number of women aged 20-39 during this period, will lead to a decline in the total number of births from the 2011 level of 74,000 to just over 55,000 in 2031, a decrease of 25.8 per cent. While all regions will experience a reduction in births over the period the West (-44.4%) and the Midlands (-30.7 %) will see the strongest falls. In other regions, births will decline by just over 28.0 per cent in the Border, the Mid-West and the South East while the Mid-East will show the smallest decrease of 10 per cent in 2031 compared to 2011.
| Regional Authority area | 2011 | 2031 |
|---|---|---|
| Border | 7.596 | 5.463 |
| Dublin | 21.532 | 16.227 |
| Mid-East | 9.634 | 8.667 |
| Midland | 4.614 | 3.196 |
| Mid-West | 5.98 | 4.298 |
| South-East | 7.746 | 5.551 |
| South-West | 10.288 | 7.853 |
| West | 6.643 | 3.692 |
| Table 2 Females aged 20-39 and total births, 1991, 2011 and 2031 (M2F2 Traditional) | |||||||
| Regional Authority | Females aged 20-39 | Births | |||||
| area | 1991 | 2011 | 2031 | 1991 | 2011 | 2031 | |
| Thousands | |||||||
| Border | 51 | 73 | 61 | 6 | 8 | 5 | |
| GDA | 217 | 313 | 308 | 21 | 31 | 25 | |
| Dublin | 171 | 229 | 220 | 16 | 22 | 16 | |
| Mid-East | 47 | 84 | 88 | 5 | 10 | 9 | |
| Midland | 26 | 42 | 32 | 3 | 5 | 3 | |
| Mid-West | 41 | 54 | 45 | 5 | 6 | 4 | |
| South-East | 51 | 72 | 57 | 6 | 8 | 6 | |
| South-West | 72 | 99 | 90 | 8 | 10 | 8 | |
| West | 43 | 64 | 43 | 5 | 7 | 4 | |
| State | 501 | 717 | 636 | 53 | 74 | 55 | |
The mortality assumptions at national level envisage a decrease in mortality rates consistent with increases in life expectancy at birth, of 4.7 years for males and 3.7 years for females, between 2011 and 2031. Because of the similarities in regional mortality rates the national assumptions have been applied uniformly at regional level. Differential age structural effects will therefore largely dictate changes in the number of deaths projected over the 2011 to 2031 period.
Given that in 2011 nearly four out of five deaths were to persons aged 65 years and over, any changes in the numbers in this age group would be expected to impact on the projected number of deaths. However, in spite of pronounced increases in this age group in all regions between 2011 and 2031 (+86% at State level), the increase in deaths is projected to be much more moderate at only 27 per cent. This is due to the moderating effect of assumed decreases in mortality rates.
The Mid-East and South-East will see the largest percentage increases in deaths, at 59 per cent and 29 per cent respectively. The Mid-West (+18 %) and Border (+19%) will have the smallest increases.
| Table 3 Old population and total deaths, 1991, 2011 and 2031 (M2F2 Traditional) | |||||||
| Regional Authority | Persons aged 65+ | Deaths | |||||
| area | 1991 | 2011 | 2031 | 1991 | 2011 | 2031 | |
| Thousands | |||||||
| Border | 54 | 65 | 115 | 4 | 4 | 4 | |
| GDA | 127 | 187 | 362 | 10 | 10 | 13 | |
| Dublin | 99 | 139 | 249 | 8 | 7 | 9 | |
| Mid-East | 29 | 48 | 114 | 2 | 2 | 4 | |
| Midland | 24 | 32 | 62 | 2 | 2 | 2 | |
| Mid-West | 37 | 47 | 85 | 3 | 3 | 3 | |
| South-East | 45 | 62 | 116 | 4 | 3 | 4 | |
| South-West | 65 | 82 | 150 | 5 | 4 | 6 | |
| West | 50 | 57 | 100 | 4 | 3 | 4 | |
| State | 403 | 532 | 991 | 31 | 28 | 36 | |
Age structure
The age structure of the projected population is shown in Table 5. Between 2011 and 2031 the number of young persons (i.e. those aged 0-14 years) is projected to increase steadily up to 2021 before falling again from 2026 and showing a decrease of 9.0 per cent over the twenty year period. However, the projected change will vary considerably across the regions. The Mid-East will be the only region to show an increase over the period of 4.7 per cent, while all other regions will experience a decrease in the population in this age group by 2031. The West will show the largest decrease at 23.9 per cent.
Projected gains from external migration, as well as earlier birth cohorts joining the age groups, will exert an influence on both the 15 to 24 and the 25 to 64 age groups. For those aged 15 to 24 years the Mid-East will see an increase of just under 52 per cent by 2031 while Dublin will see a 40.2 per cent increase in this age group. The Border and the West will experience smaller gains (+9.6% and +12.7%, respectively).
The numbers of people aged 25 to 64 is projected to increase by 3.4 per cent for the State but at a region level it will fluctuate. The Mid-East, Dublin and Midland regions are projected to increase by 13.4, 11.7 and 0.3 per cent respectively. All other regions will experience decreases in the population in this age group.
The number of old persons (65 years and over) will almost double in every region over the life-time of the projections, with the most marked increases likely to occur in the Mid-East (+136.5%) and Midland (+95.1%) regions.
All regions are expected to see rises in the Old dependency ratio (those aged 65 years and over as a percentage of those aged 15-64) during the projection period. By contrast, the Young dependency ratio (those aged 0-14 as a percentage of those aged 15-64) is projected to fluctuate across all regions, with initial increases in the period 2011-2016 followed by subsequent declines (with the South-West being the one exception, peaking in 2021 before decreasing). This reduction in the young dependency ratio will have a moderating effect on the increasing total dependency ratio. Movements in both ratios will be strongly affected by the denominator term (i.e. those aged 15-64).
The Dublin region (47.7%) will have the lowest total dependency ratio in 2031 under the M2F2 Traditional scenario, while the South-East region will have the highest, at 63.6 per cent. While the total dependency for all regions will increase over the twenty year period, Dublin’s total dependency ratio will noticeably peak in 2021 at 52.1 per cent before falling to the 47.7 per cent in 2031, although still higher than the 2011 total dependency ratio of 43.6 per cent.
| Regional Authority area | South-East | State | Dublin |
|---|---|---|---|
| 2011 | 52.468 | 49.2 | 43.641 |
| 2016 | 57.533 | 55.4 | 50.467 |
| 2021 | 60.695 | 57.8 | 52.059 |
| 2026 | 62.178 | 57.2 | 50.07 |
| 2031 | 63.58 | 56.9 | 47.674 |
The State is divided into two NUTS2 regions – the Border, Midland and West (BMW) and the South and East (S&E).
Under the M2F2 Traditional scenario the population of the BMW region is projected to grow on average by 0.2 per cent per annum between 2011 and 2031, while the corresponding rate for the S&E region is 0.8 per cent per annum (Table 4).
Because of its size, the Greater Dublin Area (GDA) – comprising Dublin and the Mid-East – is separately distinguished in Figure 5 within the South and East region. The remaining part of the South and East is termed ‘S&E remainder’. As can be seen from the graph the GDA will provide the main growth stimulus within the overall S&E region with its population projected to increase at an average annual rate of 1.0 per cent compared with 0.5 per cent for the remainder of the region – although higher than that for the BMW.
The projected increase of 58,000 in the population of the BMW region will be dominated by natural increase (119,000) which will be partially offset by a net outward flow of 49,000 to the South and East region as well as a net outward migration abroad of 12,000. Natural increase will also be the largest component of population growth in the South and East region between 2011 and 2031 and will account for 479,000 (86%) of the projected 555,000 increase. Just over 62 per cent of the natural increase will arise in the GDA.
| Regional Authority area | Natural Increase | Internal Migration | External Migration |
|---|---|---|---|
| BMW | 119.252 | -48.685 | -12.254 |
| GDA | 297.839 | 92.13 | 11.436 |
| S+E remainder | 180.91 | -43.445 | 15.918 |
| Table 4 Actual and projected population of NUTS2 regions, 2011 and 2031 (M2F2 Traditional) | |||||||||
| NUTS2 region | Population 2011 | Natural increase | Internal migration | External migration | Population 2031 | Total Increase | Average annual increase | ||
| Thousands | |||||||||
| % | |||||||||
| BMW | 1,240 | 119 | -49 | -12 | 1,298 | 58 | 0.2 | ||
| S+E | 3,335 | 479 | 49 | 27 | 3,890 | 555 | 0.8 | ||
| GDA | 1,795 | 298 | 92 | 11 | 2,197 | 401 | 1.0 | ||
| S+E rem | 1,539 | 181 | -43 | 16 | 1,693 | 153 | 0.5 | ||
| Total | 4,575 | 598 | 0 | 15 | 5,188 | 613 | 0.6 | ||
Different scenarios
All eight regions are projected to show population increases between 2011 and 2031 under the M2F2 scenario for all internal migration assumptions (Table 7). However, under the M3F2 scenario, a different picture emerges, with the West projected to experience a drop in population due predominantly to international migration. The Border is also projected to fall under the M3F2 Traditional and Modified scenarios, due to a combination of internal and international migration flows, as is the Mid-West under M3F2 Modified.
M2
Focusing on the M2 international migration assumption, all eight regions are projected to show population increases between 2011 and 2031 with the average annual growth rates varying from 0.2 to 0.9 per cent under the Recent scenario, 0.2 to 1.2 per cent under the Traditional scenario and 0.1 to 1.0 per cent under the Modified scenario.
In the Dublin region the population is projected to grow by 210,000 under the Recent scenario and by 286,000 under the Modified scenario, the variation arising directly because of the additional internal migration flows. The Mid-East region will show the highest growth rate of 1.2 per cent under the Traditional scenario, with corresponding growth rates of 0.9 per cent under the Recent and Modified scenarios.
| Regional Authority area | Natural Increase | Internal migration | External Migration |
|---|---|---|---|
| Border | 49.019 | -21.695 | -9.472 |
| Dublin | 187.861 | 46.663 | 22.711 |
| Mid-East | 109.978 | 45.467 | -11.275 |
| Midland | 39.384 | -21.36 | 7.079 |
| Mid-West | 42.838 | -9.832 | -0.941 |
| South-East | 58.013 | -16.075 | 8.676 |
| South-West | 80.059 | -17.538 | 8.183 |
| West | 30.849 | -5.63 | -9.861 |
M3
The M3 assumption considers net international migration remaining negative between 2011 and 2031. As a result, and unlike M2, not all eight regions are projected to show population increases between 2011 and 2031. However, as before, the average annual population growth rates will vary across the regions depending on the internal migration assumption chosen. These will be in the range -0.1 to 0.7 per cent for Recent, -0.1 to 1.0 per cent for Traditional and -0.2 to 0.7 per cent for Modified.
By 2031 the population of the Dublin region is projected to have an average annual increase in the range of 0.4 per cent to 0.6 per cent.
In the period to 2031 the population in the West region will fall under all three internal migration scenarios while the population in the Border region is also projected to fall under Traditional and Modified. The Mid-West is projected to fall under Modified and remain constant under Recent when compared to 2011.
| Regional Authority area | Natural Increase | Internal migration | External Migration |
|---|---|---|---|
| Border | 43.762 | -21.013 | -34.463 |
| Dublin | 168.465 | 45.345 | -72.263 |
| Mid-East | 102.948 | 44.008 | -35.33 |
| Midland | 36.67 | -20.566 | -4.888 |
| Mid-West | 39.367 | -9.771 | -17.318 |
| South-East | 54.437 | -15.627 | -6.585 |
| South-West | 73.472 | -16.936 | -21.482 |
| West | 25.704 | -5.44 | -32.969 |
| Table 5 Projected population and dependency ratios for Regional Authority areas, 2011 - 2031 (M2F2 Traditional) | |||||||||||
| Population | Dependency ratios | ||||||||||
| 0-14 | 15-24 | 25-44 | 45-64 | 65+ | Total | Young | Old | Total | |||
| Thousands | Percentage | ||||||||||
| Border | |||||||||||
| 2011 | 116 | 65 | 150 | 120 | 65 | 516 | 34.6% | 19.3% | 53.8% | ||
| 2016 | 117 | 62 | 136 | 129 | 75 | 518 | 35.8% | 22.9% | 58.7% | ||
| 2021 | 112 | 66 | 123 | 138 | 87 | 526 | 34.1% | 26.5% | 60.6% | ||
| 2026 | 99 | 72 | 116 | 144 | 100 | 531 | 30.0% | 30.2% | 60.2% | ||
| 2031 | 90 | 72 | 115 | 142 | 115 | 533 | 27.3% | 34.9% | 62.2% | ||
| GDA | |||||||||||
| 2011 | 374 | 230 | 618 | 386 | 187 | 1,795 | 30.3% | 15.1% | 45.4% | ||
| 2016 | 417 | 205 | 587 | 428 | 220 | 1,858 | 34.2% | 18.1% | 52.3% | ||
| 2021 | 431 | 252 | 547 | 482 | 261 | 1,973 | 33.7% | 20.3% | 54.0% | ||
| 2026 | 409 | 297 | 531 | 543 | 308 | 2,087 | 29.8% | 22.5% | 52.3% | ||
| 2031 | 377 | 330 | 550 | 578 | 362 | 2,197 | 25.8% | 24.9% | 50.7% | ||
| Of which: Dublin | |||||||||||
| 2011 | 245 | 166 | 444 | 269 | 139 | 1,262 | 27.9% | 15.8% | 43.6% | ||
| 2016 | 275 | 142 | 427 | 293 | 160 | 1,297 | 31.9% | 18.5% | 50.5% | ||
| 2021 | 285 | 176 | 399 | 327 | 185 | 1,373 | 31.6% | 20.5% | 52.1% | ||
| 2026 | 268 | 208 | 386 | 371 | 215 | 1,448 | 27.8% | 22.3% | 50.1% | ||
| 2031 | 241 | 232 | 396 | 400 | 249 | 1,519 | 23.5% | 24.2% | 47.7% | ||
| Mid-East | |||||||||||
| 2011 | 129 | 65 | 174 | 118 | 48 | 534 | 36.2% | 13.5% | 49.7% | ||
| 2016 | 142 | 63 | 160 | 135 | 61 | 561 | 39.6% | 17.0% | 56.6% | ||
| 2021 | 146 | 75 | 148 | 155 | 76 | 600 | 38.6% | 20.0% | 58.6% | ||
| 2026 | 141 | 89 | 145 | 172 | 93 | 639 | 34.8% | 22.9% | 57.7% | ||
| 2031 | 135 | 98 | 154 | 177 | 114 | 678 | 31.5% | 26.5% | 58.0% | ||
| Midland | |||||||||||
| 2011 | 66 | 35 | 87 | 64 | 32 | 284 | 35.6% | 17.1% | 52.7% | ||
| 2016 | 70 | 34 | 81 | 71 | 38 | 293 | 37.6% | 20.2% | 57.8% | ||
| 2021 | 69 | 36 | 75 | 78 | 45 | 302 | 36.7% | 23.6% | 60.3% | ||
| 2026 | 63 | 38 | 69 | 83 | 53 | 307 | 33.1% | 27.7% | 60.7% | ||
| 2031 | 56 | 40 | 66 | 85 | 62 | 309 | 29.4% | 32.4% | 61.8% | ||
| Mid-West | |||||||||||
| 2011 | 81 | 48 | 112 | 90 | 47 | 378 | 32.2% | 18.8% | 51.1% | ||
| 2016 | 84 | 46 | 101 | 95 | 56 | 383 | 34.6% | 23.0% | 57.6% | ||
| 2021 | 84 | 51 | 93 | 101 | 65 | 393 | 34.1% | 26.6% | 60.7% | ||
| 2026 | 78 | 54 | 91 | 105 | 75 | 403 | 31.1% | 30.0% | 61.0% | ||
| 2031 | 70 | 58 | 93 | 103 | 85 | 410 | 27.5% | 33.4% | 60.8% | ||
| South-East | |||||||||||
| 2011 | 109 | 62 | 148 | 118 | 62 | 499 | 33.4% | 19.0% | 52.5% | ||
| 2016 | 114 | 60 | 139 | 128 | 74 | 514 | 35.0% | 22.5% | 57.5% | ||
| 2021 | 114 | 63 | 129 | 138 | 86 | 531 | 34.6% | 26.1% | 60.7% | ||
| 2026 | 107 | 67 | 121 | 146 | 100 | 542 | 32.1% | 30.0% | 62.2% | ||
| 2031 | 97 | 71 | 118 | 147 | 116 | 550 | 29.0% | 34.6% | 63.6% | ||
| South-West | |||||||||||
| 2011 | 138 | 83 | 203 | 156 | 82 | 662 | 31.3% | 18.6% | 49.9% | ||
| 2016 | 148 | 77 | 189 | 168 | 96 | 678 | 34.0% | 22.2% | 56.2% | ||
| 2021 | 150 | 84 | 174 | 181 | 112 | 701 | 34.2% | 25.6% | 59.8% | ||
| 2026 | 141 | 93 | 162 | 193 | 130 | 719 | 31.5% | 29.1% | 60.7% | ||
| 2031 | 129 | 101 | 159 | 194 | 150 | 733 | 28.3% | 33.1% | 61.4% | ||
| West | |||||||||||
| 2011 | 92 | 56 | 131 | 105 | 57 | 441 | 31.7% | 19.6% | 51.3% | ||
| 2016 | 97 | 49 | 120 | 111 | 66 | 443 | 34.6% | 23.5% | 58.1% | ||
| 2021 | 94 | 54 | 108 | 118 | 77 | 451 | 33.6% | 27.4% | 60.9% | ||
| 2026 | 84 | 60 | 99 | 124 | 88 | 455 | 29.5% | 31.2% | 60.7% | ||
| 2031 | 70 | 63 | 96 | 126 | 100 | 456 | 24.6% | 35.1% | 59.8% | ||
| State | |||||||||||
| 2011 | 977 | 580 | 1,449 | 1,038 | 532 | 4,575 | 31.9% | 17.3% | 49.2% | ||
| 2016 | 1,047 | 533 | 1,353 | 1,129 | 624 | 4,687 | 34.7% | 20.7% | 55.4% | ||
| 2021 | 1,054 | 605 | 1,250 | 1,235 | 732 | 4,876 | 34.1% | 23.7% | 57.8% | ||
| 2026 | 981 | 681 | 1,190 | 1,337 | 855 | 5,044 | 30.6% | 26.7% | 57.2% | ||
| 2031 | 889 | 735 | 1,197 | 1,375 | 991 | 5,188 | 26.9% | 30.0% | 56.8% | ||
| Table 6 Actual and projected population of Regional Authority areas, 1981-2031 | ||||||||||||
| Year | Border | GDA | Dublin | Mid-East | Midland | Mid-West | South-East | South-West | West | State | ||
| Thousands | ||||||||||||
| Actual | ||||||||||||
| 1981 | 402 | 1,290 | 1,003 | 287 | 202 | 308 | 375 | 525 | 341 | 3,443 | ||
| 1986 | 411 | 1,336 | 1,021 | 315 | 208 | 315 | 385 | 537 | 348 | 3,541 | ||
| 1991 | 403 | 1,351 | 1,025 | 325 | 203 | 311 | 383 | 532 | 343 | 3,526 | ||
| 1996 | 407 | 1,406 | 1,058 | 347 | 206 | 317 | 392 | 547 | 352 | 3,626 | ||
| 2001 | 425 | 1,509 | 1,108 | 401 | 220 | 335 | 416 | 572 | 369 | 3,847 | ||
| 2006 | 470 | 1,662 | 1,183 | 479 | 252 | 359 | 461 | 619 | 411 | 4,233 | ||
| 2011 | 516 | 1,795 | 1,262 | 534 | 284 | 378 | 499 | 662 | 441 | 4,575 | ||
| Projected | ||||||||||||
| M2F2 Recent | ||||||||||||
| 2016 | 520 | 1,851 | 1,293 | 558 | 296 | 382 | 515 | 679 | 443 | 4,687 | ||
| 2021 | 532 | 1,949 | 1,360 | 589 | 311 | 389 | 534 | 706 | 453 | 4,875 | ||
| 2026 | 544 | 2,038 | 1,421 | 617 | 326 | 394 | 551 | 730 | 459 | 5,043 | ||
| 2031 | 555 | 2,115 | 1,472 | 644 | 341 | 397 | 566 | 751 | 462 | 5,188 | ||
| M2F2 Traditional | ||||||||||||
| 2016 | 518 | 1,858 | 1,297 | 561 | 293 | 383 | 514 | 678 | 443 | 4,687 | ||
| 2021 | 526 | 1,973 | 1,373 | 600 | 302 | 393 | 531 | 701 | 451 | 4,876 | ||
| 2026 | 531 | 2,087 | 1,448 | 639 | 307 | 403 | 542 | 719 | 455 | 5,044 | ||
| 2031 | 533 | 2,197 | 1,519 | 678 | 309 | 410 | 550 | 733 | 456 | 5,188 | ||
| M2F2 Modified | ||||||||||||
| 2016 | 518 | 1,861 | 1,303 | 558 | 295 | 381 | 514 | 678 | 442 | 4,687 | ||
| 2021 | 527 | 1,978 | 1,389 | 589 | 308 | 386 | 529 | 701 | 447 | 4,875 | ||
| 2026 | 534 | 2,089 | 1,472 | 617 | 319 | 389 | 541 | 721 | 450 | 5,043 | ||
| 2031 | 540 | 2,192 | 1,548 | 644 | 331 | 389 | 552 | 737 | 448 | 5,188 | ||
| M3F2 Recent | ||||||||||||
| 2016 | 518 | 1,843 | 1,286 | 556 | 295 | 380 | 514 | 677 | 442 | 4,669 | ||
| 2021 | 522 | 1,901 | 1,322 | 579 | 307 | 383 | 528 | 694 | 443 | 4,778 | ||
| 2026 | 525 | 1,943 | 1,347 | 597 | 317 | 382 | 539 | 707 | 441 | 4,853 | ||
| 2031 | 525 | 1,969 | 1,357 | 612 | 326 | 378 | 547 | 715 | 434 | 4,895 | ||
| M3F2 Traditional | ||||||||||||
| 2016 | 516 | 1,849 | 1,290 | 559 | 293 | 381 | 513 | 676 | 441 | 4,669 | ||
| 2021 | 516 | 1,924 | 1,334 | 590 | 297 | 387 | 524 | 689 | 442 | 4,779 | ||
| 2026 | 512 | 1,992 | 1,373 | 619 | 298 | 390 | 530 | 696 | 437 | 4,854 | ||
| 2031 | 504 | 2,049 | 1,403 | 646 | 295 | 390 | 532 | 697 | 428 | 4,895 | ||
| M3F2 Modified | ||||||||||||
| 2016 | 516 | 1,852 | 1,296 | 556 | 294 | 379 | 512 | 676 | 440 | 4,669 | ||
| 2021 | 517 | 1,929 | 1,351 | 579 | 303 | 380 | 523 | 689 | 438 | 4,778 | ||
| 2026 | 515 | 1,994 | 1,397 | 597 | 310 | 376 | 529 | 697 | 432 | 4,853 | ||
| 2031 | 510 | 2,044 | 1,431 | 613 | 316 | 370 | 533 | 701 | 420 | 4,895 | ||
| Table 7 Actual and projected population of Regional Authority areas, 2011 and 2031 | |||||||||||
| Regional Authority area | Population 2011 | Population Share 2011 | Births | Deaths | Internal migration | External Migration | Population 2031 | Population Share 2031 | Total Increase | Average annual increase | |
| Thousands | |||||||||||
| % | % | % | |||||||||
| M2F2 Recent | |||||||||||
| Border | 516 | 11.3 | 128 | 74 | -4 | -9 | 555 | 10.7 | 40 | 0.4% | |
| GDA | 1,795 | 39.2 | 499 | 223 | 32 | 11 | 2,115 | 40.8 | 320 | 0.8% | |
| Dublin | 1,262 | 27.6 | 333 | 160 | 15 | 23 | 1,472 | 28.4 | 210 | 0.8% | |
| Mid-East | 534 | 11.7 | 167 | 63 | 17 | -11 | 644 | 12.4 | 110 | 0.9% | |
| Midland | 284 | 6.2 | 85 | 38 | 3 | 7 | 341 | 6.6 | 57 | 0.9% | |
| Mid-West | 378 | 8.3 | 95 | 54 | -21 | -1 | 397 | 7.7 | 19 | 0.3% | |
| South-East | 499 | 10.9 | 137 | 73 | -7 | 9 | 566 | 10.9 | 66 | 0.6% | |
| South-West | 662 | 14.5 | 180 | 96 | -3 | 8 | 751 | 14.5 | 89 | 0.6% | |
| West | 441 | 9.6 | 98 | 66 | -1 | -10 | 462 | 8.9 | 21 | 0.2% | |
| State | 4,575 | 100.0 | 1,222 | 624 | -0 | 15 | 5,188 | 100.0 | 613 | 0.5% | |
| M2F2 Traditional | |||||||||||
| Border | 516 | 11.3 | 123 | 74 | -22 | -9 | 533 | 10.3 | 18 | 0.2% | |
| GDA | 1,795 | 39.2 | 521 | 223 | 92 | 11 | 2,197 | 42.3 | 401 | 1.0% | |
| Dublin | 1,262 | 27.6 | 348 | 161 | 47 | 23 | 1,519 | 29.3 | 257 | 0.9% | |
| Mid-East | 534 | 11.7 | 173 | 63 | 45 | -11 | 678 | 13.1 | 144 | 1.2% | |
| Midland | 284 | 6.2 | 77 | 38 | -21 | 7 | 309 | 6.0 | 25 | 0.4% | |
| Mid-West | 378 | 8.3 | 97 | 54 | -10 | -1 | 410 | 7.9 | 32 | 0.4% | |
| South-East | 499 | 10.9 | 131 | 73 | -16 | 9 | 550 | 10.6 | 51 | 0.5% | |
| South-West | 662 | 14.5 | 176 | 96 | -18 | 8 | 733 | 14.1 | 71 | 0.5% | |
| West | 441 | 9.6 | 97 | 66 | -6 | -10 | 456 | 8.8 | 15 | 0.2% | |
| State | 4,575 | 100.0 | 1,222 | 624 | 0 | 15 | 5,188 | 100.0 | 613 | 0.5% | |
| M2F2 Modified | |||||||||||
| Border | 516 | 11.3 | 124 | 74 | -16 | -9 | 540 | 10.4 | 25 | 0.2% | |
| GDA | 1,795 | 39.2 | 516 | 223 | 93 | 11 | 2,192 | 42.2 | 396 | 1.0% | |
| Dublin | 1,262 | 27.6 | 349 | 161 | 76 | 23 | 1,548 | 29.8 | 286 | 1.0% | |
| Mid-East | 534 | 11.7 | 167 | 63 | 17 | -11 | 644 | 12.4 | 110 | 0.9% | |
| Midland | 284 | 6.2 | 82 | 38 | -5 | 7 | 331 | 6.4 | 47 | 0.8% | |
| Mid-West | 378 | 8.3 | 94 | 54 | -28 | -1 | 389 | 7.5 | 11 | 0.1% | |
| South-East | 499 | 10.9 | 134 | 73 | -18 | 9 | 552 | 10.6 | 52 | 0.5% | |
| South-West | 662 | 14.5 | 177 | 96 | -14 | 8 | 737 | 14.2 | 75 | 0.5% | |
| West | 441 | 9.6 | 95 | 66 | -12 | -10 | 448 | 8.6 | 7 | 0.1% | |
| State | 4,575 | 100.0 | 1,222 | 624 | 0 | 15 | 5,188 | 100.0 | 613 | 0.5% | |
| M3F2 Recent | |||||||||||
| Border | 516 | 11.3 | 122 | 74 | -4 | -34 | 525 | 10.7 | 10 | 0.1% | |
| GDA | 1,795 | 39.2 | 472 | 221 | 31 | -108 | 1,969 | 40.2 | 174 | 0.5% | |
| Dublin | 1,262 | 27.6 | 312 | 159 | 15 | -72 | 1,357 | 27.7 | 96 | 0.4% | |
| Mid-East | 534 | 11.7 | 160 | 62 | 16 | -35 | 612 | 12.5 | 78 | 0.7% | |
| Midland | 284 | 6.2 | 82 | 38 | 3 | -5 | 326 | 6.7 | 42 | 0.7% | |
| Mid-West | 378 | 8.3 | 92 | 54 | -20 | -17 | 378 | 7.7 | 0 | 0.0% | |
| South-East | 499 | 10.9 | 133 | 73 | -6 | -7 | 547 | 11.2 | 48 | 0.5% | |
| South-West | 662 | 14.5 | 173 | 95 | -3 | -21 | 715 | 14.6 | 53 | 0.4% | |
| West | 441 | 9.6 | 93 | 66 | -1 | -33 | 434 | 8.9 | -7 | -0.1% | |
| State | 4,575 | 100.0 | 1,166 | 621 | -0 | -225 | 4,894 | 100.0 | 320 | 0.3% | |
| M3F2 Traditional | |||||||||||
| Border | 516 | 11.3 | 118 | 74 | -21 | -34 | 504 | 10.3 | -12 | -0.1% | |
| GDA | 1,795 | 39.2 | 493 | 222 | 89 | -108 | 2,049 | 41.9 | 253 | 0.7% | |
| Dublin | 1,262 | 27.6 | 328 | 159 | 45 | -72 | 1,403 | 28.7 | 142 | 0.5% | |
| Mid-East | 534 | 11.7 | 165 | 62 | 44 | -35 | 645 | 13.2 | 112 | 1.0% | |
| Midland | 284 | 6.2 | 75 | 38 | -21 | -5 | 295 | 6.0 | 11 | 0.2% | |
| Mid-West | 378 | 8.3 | 93 | 54 | -10 | -17 | 390 | 8.0 | 12 | 0.2% | |
| South-East | 499 | 10.9 | 127 | 73 | -16 | -7 | 532 | 10.9 | 32 | 0.3% | |
| South-West | 662 | 14.5 | 169 | 95 | -17 | -21 | 697 | 14.2 | 35 | 0.3% | |
| West | 441 | 9.6 | 91 | 66 | -5 | -33 | 428 | 8.7 | -13 | -0.1% | |
| State | 4,575 | 100.0 | 1,166 | 621 | 0 | -225 | 4,894 | 100.0 | 320 | 0.3% | |
| M3F2 Modified | |||||||||||
| Border | 516 | 11.3 | 119 | 74 | -16 | -34 | 510 | 10.4 | -5 | -0.1% | |
| GDA | 1,795 | 39.2 | 488 | 222 | 90 | -108 | 2,044 | 41.8 | 249 | 0.7% | |
| Dublin | 1,262 | 27.6 | 328 | 160 | 73 | -72 | 1,431 | 29.2 | 170 | 0.6% | |
| Mid-East | 534 | 11.7 | 160 | 62 | 17 | -35 | 613 | 12.5 | 79 | 0.7% | |
| Midland | 284 | 6.2 | 80 | 38 | -5 | -5 | 316 | 6.5 | 32 | 0.5% | |
| Mid-West | 378 | 8.3 | 90 | 54 | -27 | -17 | 370 | 7.6 | -8 | -0.1% | |
| South-East | 499 | 10.9 | 130 | 72 | -17 | -7 | 533 | 10.9 | 34 | 0.3% | |
| South-West | 662 | 14.5 | 170 | 95 | -14 | -21 | 701 | 14.3 | 39 | 0.3% | |
| West | 441 | 9.6 | 90 | 66 | -11 | -33 | 420 | 8.6 | -20 | -0.2% | |
| State | 4,575 | 100.0 | 1,166 | 621 | 0 | -225 | 4,894 | 100.0 | 320 | 0.3% | |
Expert Group
The Expert Group which advised the CSO on the assumptions to be used in the population and labour force projections at national level was retained for the regional projections exercise. The membership is given in Appendix 1 of the national report2 published in April 2013.
Fertility
The national population projections distinguished two fertility assumptions as follows:
Only F2 is considered in the present release. The age specific fertility rates for each region in 2011 were used as the starting point. The projection model reflects not only the overall fall in total fertility to 1.8 by 2026, but also incorporates the differential rate of change in regional fertility observed in the past (from 2007-2011) and projects this into the future. For example, the annual average change in regional fertility rates varied from a high of 2.31 in the Mid-East to a low of 1.86 in Dublin; this differential in rates of change was maintained in the projected regional fertility rates between 2011 and 2031, while being constrained by the projected total fertility rate for the State for any given year.
| Table A1 Actual and assumed TFRs (under M2F2 Traditional) for Regional Authority areas, 1994-2031 | |||||||||
| Year | Border | Dublin | Mid-East | Midland | Mid-West | South-East | South-West | West | State |
| 2007 | 2.04 | 1.82 | 2.34 | 2.21 | 2.17 | 2.17 | 2.02 | 2.03 | 2.02 |
| 2011 | 2.05 | 1.90 | 2.22 | 2.16 | 2.16 | 2.13 | 2.02 | 2.02 | 2.03 |
| 2031 | 1.81 | 1.62 | 2.01 | 1.96 | 1.92 | 1.90 | 1.78 | 1.79 | 1.80 |
Mortality
While consideration was given to examining the use of Regional life tables for this exercise it was decided to use the national mortality assumption across the regions given the relatively small number of deaths in some regions, combined with the relatively small impact of regional differentials in the number of deaths.
At national level the assumptions are that mortality rates will decrease (by 3.5% p.a. for men and 2.5% p.a. for women) consistent with gains in life expectancy at birth from:
International migration
The following three migration assumptions were used in compiling the state projections and reflect assumed average annual net migration:
| 2011-2016 | 2016-2021 | 2021-2031 | |
| M1 | -19,100 | +18,200 | +30,000 |
| M2 | -21,600 | +4,700 | +10,000 |
| M3 | -25,100 | -10,000 | -5,000 |
A zero net migration scenario M0 was also introduced to allow a full assessment of the impact of migration to be made. Only M2 and M3 are considered in this release.
The gross flow components of these two assumptions, (M2 and M3), were regionally distributed using patterns observed in the Quarterly National Household Survey (QNHS) for the period 2010-2013 (as shown in table A2). This short three year pattern of distribution of international migration was used in order to avoid the volatility of the flows witnessed in the period 2002-2009. Flows were also broken down by single year of age and sex on the same basis as for the total flows into and out of the State (i.e. no region-specific age distribution has been applied).
| Table A2 Percentage distribution of gross migration flows by Regional Authority area | ||||||||
| Border | Dublin | Mid-East | Midland | Mid-West | South-East | South-West | West | |
| Percentage | ||||||||
| Immigration | 10.1 | 40.0 | 9.7 | 5.1 | 6.8 | 6.6 | 12.5 | 9.3 |
| Emigration | 11.0 | 38.5 | 10.8 | 4.6 | 6.9 | 5.9 | 12.0 | 10.3 |
| Source: QNHS, 2010-2013 | ||||||||
Internal migration
By examining a person’s usual residence at the time of a census and one year previously it is possible to determine inter-regional migration patterns. An analysis of the data from the 1981, 1986, 1991 and 1996 censuses for internal migration between regions reveals a fairly stable picture in terms of the magnitude of the inward, outward and net migration flows. During this period the Dublin and Mid-East regions had net inward migration flows while flows for all other regions showed a net outflow. The 2002 and 2006 Censuses, however, revealed a substantially different pattern of internal migration between regions, and in particular for the Dublin region which showed a net outward flow of 12,600 persons in the year to April 2002 and 10,200 in the year to April 2006.
The 2011 census has now shown a reversal of these patterns with a return to a small net inflow of 689 persons into Dublin in the year to April. While there was no hard evidence available to the expert group as to whether this reversal back towards movements into the capital city was likely to persist into the future there was a general consensus among the group that the large movements out of Dublin observed in 2002 and 2006 were unlikely to re-emerge in the short to medium term. It was further felt that the Greater Dublin Area would be the main beneficiary of internal migration over the coming decades but at varying intensity. Accordingly the Expert Group opted for three internal migration scenarios:
In each scenario the volume of inter-regional flows is adjusted in line with changes in the overall population.
| Table A3 Census internal migration flows | |||||||||
| Migration | Border | Dublin | Mid-East | Midland | Mid-West | South-East | South-West | West | State |
| Traditional | |||||||||
| Inwards | 3,563 | 14,903 | 8,549 | 2,788 | 4,997 | 4,695 | 4,575 | 4,762 | 48,832 |
| Outwards | 4,547 | 12,848 | 6,590 | 3,814 | 5,252 | 5,388 | 5,376 | 5,017 | 48,832 |
| Net flow | -984 | 2,055 | 1,959 | -1,026 | -255 | -693 | -801 | -255 | 0 |
| Recent | |||||||||
| Inwards | 5,038 | 15,428 | 9,635 | 4,292 | 4,084 | 5,082 | 5,114 | 5,573 | 54,246 |
| Outwards | 5,212 | 14,739 | 8,839 | 4,130 | 5,073 | 5,384 | 5,263 | 5,606 | 54,246 |
| Net flow | -174 | 689 | 796 | 162 | -989 | -302 | -149 | -33 | 0 |
| Modified | |||||||||
| Inwards | 4,781 | 17,453 | 9,635 | 4,107 | 3,949 | 4,847 | 4,908 | 5,352 | 55,032 |
| Outwards | 5,615 | 13,500 | 8,839 | 4,383 | 5,310 | 5,761 | 5,656 | 5,968 | 55,032 |
| Net flow | -834 | 3,953 | 796 | -276 | -1,361 | -914 | -748 | -616 | 0 |
Methodology
The regional population projections contained in this release represent a top-down disaggregation of the national projections published in April 2013. The assumptions used in the national model (fertility, mortality and international migration) are regionalised mainly based on recent historical data, while migration between regions is also assessed. The outcome of this procedure is a set of regional population projections based on what would be likely to happen if recent trends in fertility, mortality and international migration were to continue, subject to the overall constraint of the national population projections.
Limitations
Because of the greater uncertainty attaching to regional as distinct from national population projections, the results for individual Regional Authority areas must be regarded as somewhat tentative. The objective of the regional population projections is to determine how the population of the various regions would evolve in the period to 2031 if recent demographic trends were to continue.
More detailed results
More detailed results on population, births, deaths, net internal migration and net international migration under the six regional projection scenarios are available below. The data on births, deaths and net migration are broken down by sex for each year from 2011 to 2031. The population data are broken down by single year of age and sex from 2011 to 2031.
Zip file of detailed population data under the M2F2 scenario in comma delimited format (ZIP 384KB)
Zip file of detailed population data under the M2F3 scenario in comma delimited format (ZIP 384KB)
Zip file of detailed births, deaths and migration data in comma delimited format (ZIP 66KB)
You can unzip these files using a suitable file extraction utility (the CSO uses WinZip).
NUTS2 and NUTS3 regions
The regional classifications in this release are based on the NUTS (Nomenclature of Territorial Units) classification used by Eurostat. The NUTS3 regions correspond to the eight Regional Authorities established under the Local Government Act, 1991 (Regional Authorities) (Establishment) Order, 1993, which came into operation on 1 January 1994. The NUTS2 regions, which were proposed by Government and agreed by Eurostat in 1999, are groupings of the NUTS3 regions. The composition of the regions is set out below.
| Border, Midlands and Western NUTS2 Region | Southern and Eastern NUTS2 Region | ||
| Border | Cavan | Dublin | Dublin City |
| Donegal | Dún Laoghaire/Rathdown | ||
| Leitrim | Fingal | ||
| Louth | South Dublin | ||
| Monaghan | Mid-East | Kildare | |
| Sligo | Meath | ||
| Midland | Laois | Wicklow | |
| Longford | Mid-West | Clare | |
| Offaly | Limerick City | ||
| Westmeath | Limerick County | ||
| West | Galway City | Tipperary North | |
| Galway County | South-East | Carlow | |
| Mayo | Kilkenny | ||
| Roscommon | Tipperary South | ||
| Waterford City | |||
| Waterford County | |||
| Wexford | |||
| South-West | Cork City | ||
| Cork County | |||
| Kerry | |||
 Hide Background Notes
Scan the QR code below to view this release online or go to
http://www.cso.ie/en/releasesandpublications/er/rpp/regionalpopulationprojections2016-2031/
 Show Table 1 Actual and projected population of Regional Authority areas, 2011 and 2031 (M2F2 Traditional)
 Hide Table 1 Actual and projected population of Regional Authority areas, 2011 and 2031 (M2F2 Traditional)