
| % of row | |||||||||
| Main fuel used to heat homes | |||||||||
| Region | Natural gas | Diesel / gas oil | Kerosene | LPG | Electricity | Coal | Peat | Wood | Other |
| Border | 11 | 18 | 42 | 1 | 2 | 15 | 7 | 2 | 1 |
| Dublin | 72 | 6 | 5 | 1 | 13 | 1 | 0 | 0 | 2 |
| Mid-East | 44 | 13 | 27 | 1 | 2 | 6 | 3 | 3 | 0 |
| Mid-West | 21 | 28 | 27 | 1 | 4 | 7 | 7 | 5 | 1 |
| Midland | 12 | 4 | 38 | 1 | 3 | 4 | 34 | 2 | 1 |
| South-East | 14 | 31 | 30 | 1 | 4 | 11 | 0 | 6 | 1 |
| South-West | 29 | 19 | 27 | 1 | 6 | 9 | 2 | 5 | 1 |
| Western | 5 | 11 | 45 | 1 | 3 | 7 | 24 | 3 | 1 |
| Total | 35 | 15 | 25 | 1 | 6 | 7 | 7 | 3 | 1 |
Some of the main findings from this CSO report examining the behaviours of households in relation to environmental awareness, waste management, and energy use are:
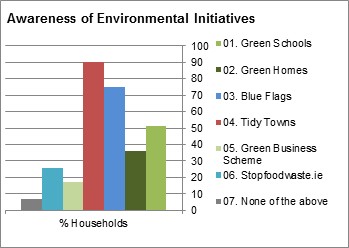
Awareness of environmental schemes and initiatives (Table 4)
Tidy Towns was the best known environmental initiative with just over 1.5 million households (90%) familiar with this initiative. Blue Flag was the second best known programme with 75% of households aware of it. The least known scheme was Green Business with 17% of households aware of this initiative.
Households living in apartments were the least likely to be familiar with environmental schemes: 20% were not aware of the various initiatives compared with a national average of 7%.
Persons living alone, aged 65 and over were less likely to be familiar with any of the initiatives (11% of such households) compared with other types of households.
Installation of energy saving products in owner occupied and other non rented households (Table 2)
63% of owner-occupied households installed energy efficient lighting in the last ten years. Insulation (48%) and efficient glazing (29%) were the next most popular energy efficiency measures for these households.
50% of apartment dwellers had not installed any energy saving products in the last ten years, compared with 18% of the total households surveyed.
| Energy Saving product | Energy saving installation |
|---|---|
| 01. Insulation | 47 |
| 02. Thermal solar panels (heat water) | 3 |
| 03. Photo-voltaic solar panels (generate electricity) | 0 |
| 04. Heating controls | 16 |
| 05. Efficient glazing (e.g. double, triple) | 29 |
| 06. Draught proofing | 19 |
| 07. Replaced an open fire with a stove | 21 |
| 08. Energy efficient lighting (e.g. CFL or LED) | 63 |
| 09. High efficiency boiler (e.g. boiler upgrade) | 19 |
| 10. Other Measure taken | 1 |
| 11. Have not installed any energy saving products | 18 |
Main determinant when buying a car (Table 3)
28% of households reported that the most important element they considered when buying a car, excluding price, was the annual fuel costs. Annual motor tax was the most important factor for 18% of respondents, other running costs was reported by 14%, and family requirements was reported by 12% - family requirements was selected by 25% of households with two adults and 1-3 children. Environmental concerns was selected by 2% of households.
Influence of Energy Efficiency rating or label (Table 1b)
19% of households said that their last purchase of a large electrical item was fully influenced by the energy efficiency rating compared with 22% reporting that it had no influence. Only 12% of rented dwellings were fully influenced by the energy efficiency rating compared with 22% of owner occupied households.
Just over one-fifth (21%) of all households had not purchased a large electrical item - this rate was 47% for apartments and 42% for rented households.
32% of householders, aged 65 and over who were living alone, reported that the energy efficiency rating had no influence.
| Owner-occupied | Rented and other | |
| 01. Fully influenced | 22 | 12 |
| 02. Influenced decision | 42 | 24 |
| 03. Had no influence | 22 | 21 |
| 04. Have not purchased a large electrical item | 14 | 42 |
| 05. Not answered | 0 | 2 |
Household’s main method for disposing of non-recyclable household waste (Table 5)
A wheelie bin collection service was used by 80% of households to dispose of non-recyclable household waste. Another 8% of households brought their non-recyclable household waste to a recycling centre and 4% of households shared a bin with another household such as a neighbour, relative or friend - in one-person households, where the person was aged 65 and over, the rate for sharing was 12%. Apartment dwellers were also more likely to share a bin (18% of apartments).
Dublin and the Mid-East had the highest percentage of wheelie bin use at 86%. Rural households made much more use of recycling centres (18% of rural households) compared with 3% of urban households.
Household’s main method for disposing of recyclable household waste (Table 6)
The most popular method of disposing of recyclable waste was through a wheelie bin service with 76% of households using this method. The second most popular method was to bring this waste to a recycling centre (12%). There was a clear urban/rural divide with 24% of rural households bringing the recyclable waste to a recycling centre compared with 6% of urban households. 2% of households did not recycle waste.
| Recyclables wheelie bin collection service | |
| Total | 76 |
| Border | 61 |
| Dublin | 84 |
| Mid-East | 80 |
| Mid-West | 73 |
| Midland | 75 |
| South-East | 72 |
| South-West | 73 |
| Western | 73 |
Measures to reduce waste (Table 10)
The most popular method taken by households to reduce waste was to purchase only what can be consumed by the sell-by date (51% of households chose this method). The next most popular measure was to purchase products with less packaging (35% of households). In the Dublin region, 25% of households used a No junk mail sign compared with only 3% of rural households. 29% of households did not take any specific measures to reduce waste.
| Measures to reduce waste | Rural areas | Urban areas |
|---|---|---|
| 01. Purchase products with less packaging | 37 | 33 |
| 02. Avoid disposable products in favour of reusable | 27 | 24 |
| 03. Purchase only what can be consumed by sell-by-date | 55 | 49 |
| 04. Control serving/portion sizes for meals | 23 | 26 |
| 05. Have a No junk mail sign up | 3 | 15 |
| 06. Other | 2 | 1 |
| 07. Don’t do anything specific to reduce waste | 29 | 29 |
Main fuel source used to heat homes (Table 12)
Natural gas was the main fuel used to heat 35% of households. These rates were highest for terraced houses (59%) and semi-detached houses (54%). In urban areas, 53% of households used natural gas as their main heating source whereas only 1% used it in rural areas reflecting the availability of the gas distribution network.
43% of households in rural areas used kerosene as their primary heating source. A further 20% used diesel or gas oil. In the Midland region 38% of households used kerosene and 34% used peat.
Electricity was the main heating source in 45% of apartments compared with a national rate of 6% of households. Natural gas was the main heating source used in 44% of apartments.
| 01. Natural gas | 02. Diesel / gas oil | 03. Kerosene | 04. LPG | 05. Electricity | 06. Coal / smokeless coal | 07. Peat ( sod (turf) / briquettes) | 08. Other | |
| Apartment | 44 | 2 | 2 | 1 | 45 | 1 | 0 | 2 |
| Bungalow | 4 | 21 | 40 | 1 | 2 | 10 | 16 | 5 |
| Detached house | 13 | 20 | 40 | 1 | 1 | 6 | 11 | 8 |
| Semi-detached house | 54 | 15 | 18 | 1 | 2 | 6 | 3 | 1 |
| Terraced house and other | 59 | 9 | 13 | 1 | 5 | 9 | 3 | 2 |
Use of additional heating sources (Tables 13a,13b and 13c)
The most popular additional home heating source was an open fire or open fire with a back boiler which was reported by 38% of households. Stoves or ranges were the next most popular option at 24%.
There were sharp differences between rural and urban areas in relation to the use of stoves or ranges: 47% of rural households used them compared with 12% of urban households. 73% of apartments did not use any additional heating sources.
Coal (28% of households), wood logs (23%), and peat (16%) were the most popular fuels used in the open fire for supplementary heating.
Wood logs were used by 29% of rural households as a fuel in their stove or range.
Heating tap water (Tables 14a and 14b)
During winter 82% of households used the central heating system to heat their tap water. This contrasts with summer when just 34% used the central heating system. The immersion heater was used by 52% of households in summer to heat tap water compared with only 10% using it in winter. Just 3% of households used solar panels, in conjunction with the central heating system or immersion, to heat water during the summer.
Main fuel used for cooking (Table 15)
65% of households used electricity as their main cooking fuel, 13% used natural gas and 12% used a combination of gas and electricity. The combination of electricity and gas was more prevalent in recently built dwellings with 16% of households constructed since 2001 using this combination.
Rural areas had a higher reliance on LPG for their cooking needs (16%) while urban areas used this source in only 3% of households. Electricity was the main cooking fuel for 82% of apartments.
How often is an electric shower used in the household (Table 14c)
Just under half of all households (49%) used an electric shower every day. This rate was 21% for households with persons living alone aged 65 and over
At national level, 29% of households did not use or have an electric shower. 54% of apartments, and 41% of households with persons living alone aged 65 or over did not use or have an electric shower.
Recognition of energy rating labels (Table 1a)
Respondents were asked whether they recognised either an energy efficiency label for a washing machine or a Building Energy Rating label. Recognition levels were very high with 83% of households responding that they recognised the labels. Recognition was significantly lower in one-person households aged 65 and over (54%). In one-person households aged under 65, recognition was 82% and much closer to the national average. Recognition levels for the labels were 90% for dwellings that were constructed in 2001 or later.
Main method of disposing of food and garden waste (Table 7)
The most popular method of disposing of food and garden waste was through using a brown bin or bringing the waste to a recycling centre (35% of households). The second most popular method was disposing of this waste in another bin (26%) – this proportion was 56% for apartments. The third most popular method of disposing of food and garden waste was feeding it to animals (22%) – this rate varied from 45% of households in rural areas to 10% in urban areas. Rural households were more likely to compost garden waste at home (34%) than urban households (12%).
| Household management of food and garden waste: | Rural areas | Urban areas |
|---|---|---|
| 01. Compost food waste at home | 25 | 11 |
| 02. Feed food waste to animals | 45 | 10 |
| 03. Compost garden waste at home | 34 | 12 |
| 04. Use a brown bin or bring waste to a recycling centre | 16 | 45 |
| 05. Use a collection bin other than a brown bin | 18 | 30 |
| 06. Other method | 11 | 9 |
Disposing of out-of-date and unwanted household medicines (Table 8a)
The most popular option was to return out-of-date and unwanted medicines to a pharmacy (34% of households). This choice was highest at 51% for households with two adults, with one person aged 65 and over, and no children. 22% of households disposed of out-of-date and unwanted medicines with household waste.
Disposing of small electrical items (Table 8b)
Half of all households brought small electrical and electronic equipment to recycling centres. The rate was higher in rural areas (57%) compared with urban areas (46%). Urban areas were more likely to return goods to the retailer (28%) compared with rural areas (23%).
12% of apartment dwellers disposed of electrical items with household waste compared with a national average of 7%. Owner-occupiers were less likely to dispose of small electrical items with household waste (5%) compared with rented households (11%).
Small batteries recycling (Tables 9a and 9b)
Almost three-quarters (72%) of households recycled small batteries. Over half of all households (52%) brought them to a shop or recycling centre. Similar proportions of households brought them into work for recycling (10%) or school (8%).
Rented households (36%) and persons living alone, aged 65 and over (41%) were the least likely to recycle small batteries.
36% of nationals from outside the EU 27 (other areas), don't recycle batteries compared to 27% of Irish nationals and 24% of EU 27 (other EU) nationals.
| Nationality | 01. Bring to a shop or a recycling centre | 02. Bring in to work for recycling | 03. Children bring into school for recycling | 04. Other collection point | 05. Not relevant (Does not recycle batteries/Not answered) |
|---|---|---|---|---|---|
| Irish | 52 | 10 | 8 | 4 | 28 |
| Other EU | 55 | 10 | 7 | 4 | 25 |
| Other areas | 42 | 8 | 9 | 6 | 38 |
Note: Households could select more than one method of battery recycling.
| Table 1a: Do you recognise either of these labels? | |||||
| % of row | |||||
| 01. Recognised label | 02. Did not recognise label | 03. Not answered | Weighted Households | Sampled Households | |
| Total | 83 | 16 | 0 | 1,688,215 | 13,032 |
| Region | |||||
| Border | 82 | 18 | 0 | 187,428 | 1,409 |
| Dublin | 83 | 16 | 1 | 472,011 | 3,490 |
| Mid-East | 90 | 10 | . | 186,846 | 1,312 |
| Mid-West | 80 | 19 | 0 | 138,754 | 985 |
| Midland | 78 | 22 | 0 | 104,979 | 860 |
| South-East | 87 | 12 | 0 | 186,280 | 1,615 |
| South-West | 81 | 19 | 0 | 248,706 | 2,035 |
| Western | 84 | 16 | 0 | 163,212 | 1,326 |
| Urban/Rural | |||||
| Rural areas | 82 | 18 | 0 | 586,711 | 4,647 |
| Urban areas | 84 | 16 | 0 | 1,101,504 | 8,385 |
| Dwelling type | |||||
| Apartment | 76 | 24 | 1 | 156,844 | 1,161 |
| Bungalow | 80 | 20 | 0 | 192,336 | 1,521 |
| Detached house | 85 | 15 | 0 | 546,005 | 4,313 |
| Semi-detached house | 87 | 13 | 0 | 485,625 | 3,693 |
| Terraced house and other | 80 | 19 | 0 | 307,405 | 2,344 |
| Household Composition | |||||
| 1 adult aged 65+, living alone | 54 | 45 | 0 | 164,745 | 1,235 |
| 1 adult aged under 65, living alone | 82 | 17 | 0 | 192,868 | 1,506 |
| 1 adult with children | 84 | 15 | 0 | 88,062 | 667 |
| 2 adults at least one 65+, no children | 74 | 26 | 0 | 202,069 | 1,550 |
| 2 adults both under 65, no children | 89 | 11 | 0 | 277,289 | 2,145 |
| 2 adults with 1-3 children | 93 | 7 | 0 | 407,141 | 3,131 |
| 3 or more adults, no children | 84 | 15 | 1 | 203,280 | 1,604 |
| Other households with children | 89 | 11 | 0 | 152,760 | 1,194 |
| Construction date | |||||
| Before 1960 | 75 | 25 | 0 | 390,825 | 3,033 |
| 1961-1980 | 82 | 17 | 0 | 321,930 | 2,468 |
| 1981-2000 | 88 | 12 | 0 | 421,532 | 3,277 |
| 2001 or later | 90 | 10 | 0 | 431,296 | 3,313 |
| Unknown construction period | 75 | 24 | 1 | 122,632 | 941 |
| Nature of occupancy | |||||
| Owner-occupied | 85 | 15 | 0 | 1,252,554 | 9,739 |
| Rented and other | 78 | 21 | 1 | 435,660 | 3,293 |
| Nationality | |||||
| Ireland | 84 | 16 | 0 | 1,529,619 | 11,835 |
| Other EU | 82 | 18 | 1 | 126,125 | 952 |
| Other areas | 70 | 29 | 1 | 32,472 | 245 |
| Household working status | |||||
| All adults working full time | 92 | 7 | 0 | 426,928 | 3,268 |
| One adult working and one adult not working | 88 | 12 | 0 | 437,591 | 3,403 |
| One adult or more working part time, all other adults (if any) working | 90 | 10 | 0 | 245,792 | 1,925 |
| All adults not working: Adults aged 65+ and inactive | 61 | 38 | 0 | 260,487 | 1,953 |
| All adults not working : Other | 78 | 22 | 0 | 277,029 | 2,172 |
| Not specified | 82 | 17 | 1 | 40,387 | 311 |
| Table 1b: Thinking about the last time your household purchased a large electrical item how much did the Energy Efficiency rating or label influence your decision? | |||||||
| % of row | |||||||
| 01. Fully influenced decisions | 02. Influenced decision but also considered other factors | 03. Had no influence | 04. Have not purchased a large electrical item | 05. Not answered | Weighted Households | Sampled Households | |
| Total | 19 | 37 | 22 | 21 | 1 | 1,688,215 | 13,032 |
| Region | |||||||
| Border | 18 | 36 | 28 | 17 | 1 | 187,428 | 1,409 |
| Dublin | 19 | 35 | 18 | 27 | 1 | 472,011 | 3,490 |
| Mid-East | 21 | 43 | 19 | 17 | 0 | 186,846 | 1,312 |
| Mid-West | 16 | 36 | 29 | 19 | . | 138,754 | 985 |
| Midland | 17 | 36 | 27 | 20 | 0 | 104,979 | 860 |
| South-East | 24 | 39 | 19 | 17 | 1 | 186,280 | 1,615 |
| South-West | 16 | 38 | 21 | 24 | 0 | 248,706 | 2,035 |
| Western | 22 | 35 | 26 | 18 | 0 | 163,212 | 1,326 |
| Urban/Rural | |||||||
| Rural areas | 21 | 39 | 26 | 15 | 0 | 586,711 | 4,647 |
| Urban areas | 18 | 36 | 20 | 25 | 1 | 1,101,504 | 8,385 |
| Dwelling type | |||||||
| Apartment | 12 | 24 | 16 | 47 | 1 | 156,844 | 1,161 |
| Bungalow | 20 | 39 | 27 | 14 | 1 | 192,336 | 1,521 |
| Detached house | 22 | 42 | 21 | 15 | 0 | 546,005 | 4,313 |
| Semi-detached house | 20 | 38 | 21 | 21 | 0 | 485,625 | 3,693 |
| Terraced house and other | 16 | 33 | 25 | 24 | 1 | 307,405 | 2,344 |
| Household Composition | |||||||
| 1 adult aged 65+, living alone | 12 | 21 | 32 | 35 | 1 | 164,745 | 1,235 |
| 1 adult aged under 65, living alone | 16 | 33 | 24 | 27 | 1 | 192,868 | 1,506 |
| 1 adult with children | 16 | 29 | 27 | 28 | 0 | 88,062 | 667 |
| 2 adults at least one 65+, no children | 18 | 34 | 29 | 19 | 0 | 202,069 | 1,550 |
| 2 adults both under 65, no children | 20 | 39 | 18 | 22 | 1 | 277,289 | 2,145 |
| 2 adults with 1-3 children | 22 | 46 | 17 | 14 | 0 | 407,141 | 3,131 |
| 3 or more adults, no children | 19 | 36 | 21 | 23 | 1 | 203,280 | 1,604 |
| Other households with children | 24 | 43 | 19 | 14 | 1 | 152,760 | 1,194 |
| Construction date | |||||||
| Before 1960 | 18 | 32 | 25 | 24 | 1 | 390,825 | 3,033 |
| 1961-1980 | 20 | 35 | 26 | 18 | 0 | 321,930 | 2,468 |
| 1981-2000 | 20 | 43 | 21 | 16 | 1 | 421,532 | 3,277 |
| 2001 or later | 21 | 41 | 19 | 19 | 0 | 431,296 | 3,313 |
| Unknown construction period | 9 | 25 | 18 | 46 | 1 | 122,632 | 941 |
| Nature of occupancy | |||||||
| Owner-occupied | 22 | 42 | 22 | 14 | 0 | 1,252,554 | 9,739 |
| Rented and other | 12 | 24 | 21 | 42 | 1 | 435,660 | 3,293 |
| Nationality | |||||||
| Ireland | 19 | 38 | 23 | 19 | 0 | 1,529,619 | 11,835 |
| Other EU | 19 | 27 | 11 | 41 | 1 | 126,125 | 952 |
| Other areas | 10 | 22 | 14 | 52 | 2 | 32,472 | 245 |
| Household working status | |||||||
| All adults working full time | 21 | 44 | 18 | 16 | 0 | 426,928 | 3,268 |
| One adult working and one adult not working | 21 | 41 | 21 | 17 | 0 | 437,591 | 3,403 |
| One adult or more working part time, all other adults (if any) working | 22 | 42 | 19 | 18 | 0 | 245,792 | 1,925 |
| All adults not working: Adults aged 65+ and inactive | 15 | 25 | 31 | 29 | 1 | 260,487 | 1,953 |
| All adults not working : Other | 16 | 29 | 26 | 28 | 1 | 277,029 | 2,172 |
| Not specified | 14 | 20 | 18 | 46 | 1 | 40,387 | 311 |
| Table 2: Has your household installed any of the following energy saving products in the last 10 years? 1 See Footnote | ||||||||||||||
| % of row | ||||||||||||||
| 01. Insulation | 02. Thermal solar panels (heat water) | 03. Photo-voltaic solar panels (generate electricity) | 04. Heating controls | 05. Efficient glazing (e.g. double, triple) | 06. Draught proofing | 07. Replaced an open fire with a stove | 08. Energy efficient lighting (e.g. CFL or LED) | 09. High efficiency boiler (e.g. boiler upgrade) | 10. Other Measure taken | 11. Have not installed any energy saving products | 12. Not answered | Weighted Households 2 | Sampled Households | |
| Total | 48 | 3 | 0 | 16 | 29 | 19 | 21 | 63 | 19 | 1 | 18 | 0 | 1,252,554 | 9,739 |
| Region | 0 | 0 | 0 | 0 | 0 | 0 | 0 | 0 | 0 | 0 | 0 | 0 | ||
| Border | 46 | 4 | 0 | 9 | 23 | 16 | 18 | 56 | 12 | 2 | 24 | 0 | 145,087 | 1,102 |
| Dublin | 43 | 2 | 0 | 23 | 35 | 20 | 9 | 59 | 31 | 1 | 19 | 1 | 311,368 | 2,303 |
| Mid-East | 39 | 4 | 1 | 14 | 22 | 23 | 19 | 63 | 15 | 1 | 23 | 0 | 150,725 | 1,052 |
| Mid-West | 54 | 4 | 1 | 16 | 24 | 20 | 28 | 70 | 15 | 2 | 14 | 0 | 110,523 | 790 |
| Midland | 49 | 2 | 0 | 11 | 25 | 13 | 25 | 68 | 10 | . | 15 | 1 | 81,979 | 676 |
| South-East | 47 | 5 | 1 | 15 | 25 | 16 | 30 | 68 | 14 | 2 | 17 | 1 | 144,518 | 1,265 |
| South-West | 53 | 4 | 0 | 17 | 32 | 22 | 25 | 65 | 19 | 1 | 17 | 0 | 177,998 | 1,486 |
| Western | 55 | 5 | 0 | 19 | 33 | 22 | 35 | 68 | 15 | 0 | 14 | . | 130,354 | 1,065 |
| Urban/Rural | 0 | 0 | 0 | 0 | 0 | 0 | 0 | 0 | 0 | 0 | 0 | 0 | ||
| Rural areas | 52 | 6 | 1 | 16 | 30 | 20 | 32 | 65 | 15 | 1 | 17 | 0 | 525,381 | 4,172 |
| Urban areas | 45 | 2 | 0 | 17 | 28 | 19 | 14 | 62 | 22 | 1 | 19 | 1 | 727,173 | 5,567 |
| Dwelling type | 0 | 0 | 0 | 0 | 0 | 0 | 0 | 0 | 0 | 0 | 0 | 0 | ||
| Apartment | 10 | . | 0 | 8 | 9 | 10 | 1 | 42 | 5 | 3 | 50 | . | 30,855 | 226 |
| Bungalow | 54 | 4 | 0 | 13 | 26 | 18 | 29 | 63 | 14 | 1 | 17 | 0 | 175,403 | 1,393 |
| Detached house | 52 | 6 | 1 | 18 | 30 | 21 | 29 | 67 | 18 | 1 | 16 | 0 | 504,172 | 3,988 |
| Semi-detached house | 42 | 1 | 0 | 16 | 27 | 19 | 13 | 63 | 23 | 1 | 20 | 0 | 353,154 | 2,693 |
| Terraced house and other | 46 | 1 | 0 | 17 | 33 | 20 | 12 | 57 | 20 | 1 | 18 | 1 | 188,970 | 1,439 |
| Household Composition | 0 | 0 | 0 | 0 | 0 | 0 | 0 | 0 | 0 | 0 | 0 | 0 | ||
| 1 adult aged 65+, living alone | 43 | 1 | 0 | 10 | 27 | 15 | 15 | 48 | 12 | 1 | 27 | 0 | 139,814 | 1,046 |
| 1 adult aged under 65, living alone | 41 | 2 | 1 | 15 | 25 | 17 | 17 | 58 | 15 | 2 | 24 | 0 | 117,294 | 930 |
| 1 adult with children | 39 | 1 | 1 | 10 | 16 | 13 | 13 | 62 | 15 | 1 | 23 | 1 | 26,285 | 208 |
| 2 adults at least one 65+, no children | 54 | 3 | 0 | 13 | 31 | 18 | 24 | 59 | 17 | 1 | 17 | 0 | 192,401 | 1,478 |
| 2 adults both under 65, no children | 47 | 4 | 0 | 17 | 30 | 19 | 23 | 65 | 20 | 1 | 18 | 1 | 186,823 | 1,472 |
| 2 adults with 1-3 children | 48 | 6 | 0 | 22 | 27 | 22 | 24 | 71 | 22 | 2 | 16 | 0 | 306,041 | 2,370 |
| 3 or more adults, no children | 48 | 3 | 0 | 15 | 32 | 20 | 21 | 65 | 22 | 1 | 15 | 1 | 161,784 | 1,277 |
| Other households with children | 50 | 5 | 0 | 19 | 30 | 21 | 24 | 71 | 22 | 1 | 14 | 1 | 122,112 | 958 |
| Construction date | 0 | 0 | 0 | 0 | 0 | 0 | 0 | 0 | 0 | 0 | 0 | 0 | ||
| Before 1960 | 48 | 2 | 0 | 16 | 34 | 22 | 21 | 55 | 18 | 1 | 21 | 1 | 319,472 | 2,490 |
| 1961-1980 | 58 | 3 | 0 | 17 | 35 | 20 | 20 | 65 | 23 | 1 | 13 | 0 | 277,542 | 2,133 |
| 1981-2000 | 45 | 4 | 0 | 16 | 23 | 18 | 25 | 67 | 21 | 1 | 17 | 0 | 335,272 | 2,623 |
| 2001 or later | 40 | 6 | 1 | 18 | 23 | 19 | 19 | 68 | 14 | 2 | 22 | 0 | 289,352 | 2,248 |
| Unknown construction period | 42 | 1 | 1 | 8 | 27 | 14 | 20 | 52 | 13 | 1 | 22 | 4 | 30,916 | 245 |
| Nature of occupancy | 0 | 0 | 0 | 0 | 0 | 0 | 0 | 0 | 0 | 0 | 0 | 0 | ||
| Owner-occupied | 48 | 3 | 0 | 16 | 29 | 19 | 21 | 63 | 19 | 1 | 18 | 0 | 1,252,554 | 9,739 |
| Nationality | 0 | 0 | 0 | 0 | 0 | 0 | 0 | 0 | 0 | 0 | 0 | 0 | ||
| Ireland | 48 | 3 | 0 | 16 | 29 | 19 | 21 | 63 | 19 | 1 | 18 | 0 | 1,204,605 | 9,363 |
| Other EU | 43 | 5 | . | 19 | 26 | 17 | 23 | 65 | 21 | 2 | 17 | 1 | 41,807 | 329 |
| Other areas | 39 | 4 | 2 | 15 | 22 | 23 | 19 | 55 | 12 | . | 31 | 2 | 6,143 | 47 |
| Household working status | 0 | 0 | 0 | 0 | 0 | 0 | 0 | 0 | 0 | 0 | 0 | 0 | ||
| All adults working full time | 44 | 4 | 1 | 21 | 28 | 19 | 21 | 67 | 20 | 1 | 18 | 1 | 322,579 | 2,502 |
| One adult working and one adult not working | 49 | 4 | 0 | 16 | 30 | 22 | 24 | 68 | 20 | 1 | 15 | 1 | 354,535 | 2,772 |
| One adult or more working part time, all other adults (if any) working | 50 | 5 | 0 | 20 | 28 | 21 | 25 | 68 | 22 | 1 | 16 | 0 | 190,336 | 1,505 |
| All adults not working: Adults aged 65+ and inactive | 49 | 2 | 0 | 11 | 28 | 16 | 18 | 52 | 14 | 1 | 22 | 0 | 232,423 | 1,742 |
| All adults not working : Other | 45 | 2 | 1 | 13 | 28 | 17 | 18 | 58 | 16 | 1 | 21 | 1 | 141,668 | 1,132 |
| Not specified | 32 | . | . | 18 | 24 | 14 | 19 | 52 | 17 | . | 26 | 3 | 11,014 | 86 |
| 1 More than one option allowed | ||||||||||||||
| 2 Only owner occupied households were asked this question, see background notes for further details | ||||||||||||||
| Table 3: Apart from price, what would most influence your decision when buying a car? | |||||||||||
| % of row | |||||||||||
| 01. Annual fuel costs | 02. Annual level of motor tax | 03. Other running costs (e.g. insurance, servicing, etc.) | 04. Environmental concerns (e.g. car emissions) | 05. Resale value | 06. Family requirements | 07. Other influences | 08. Not applicable | 09. Not answered | Weighted Households | Sampled Households | |
| Total | 28 | 18 | 14 | 2 | 4 | 12 | 5 | 17 | 0 | 1,688,215 | 13,032 |
| Region | |||||||||||
| Border | 28 | 23 | 17 | 1 | 3 | 8 | 5 | 15 | 0 | 187,428 | 1,409 |
| Dublin | 23 | 16 | 11 | 3 | 3 | 12 | 5 | 25 | 1 | 472,011 | 3,490 |
| Mid-East | 30 | 17 | 17 | 1 | 3 | 14 | 5 | 13 | 0 | 186,846 | 1,312 |
| Mid-West | 26 | 20 | 16 | 4 | 5 | 13 | 4 | 13 | 0 | 138,754 | 985 |
| Midland | 34 | 20 | 10 | 2 | 4 | 12 | 4 | 14 | 0 | 104,979 | 860 |
| South-East | 30 | 18 | 14 | 2 | 3 | 11 | 7 | 16 | 0 | 186,280 | 1,615 |
| South-West | 33 | 14 | 14 | 2 | 4 | 12 | 5 | 16 | 0 | 248,706 | 2,035 |
| Western | 31 | 23 | 12 | 3 | 5 | 12 | 3 | 12 | . | 163,212 | 1,326 |
| Urban/Rural | |||||||||||
| Rural areas | 32 | 19 | 15 | 2 | 4 | 12 | 5 | 11 | 0 | 586,711 | 4,647 |
| Urban areas | 26 | 17 | 13 | 2 | 3 | 11 | 5 | 21 | 0 | 1,101,504 | 8,385 |
| Dwelling type | |||||||||||
| Apartment | 26 | 12 | 12 | 3 | 3 | 5 | 5 | 33 | 1 | 156,844 | 1,161 |
| Bungalow | 32 | 19 | 15 | 2 | 4 | 10 | 5 | 12 | 0 | 192,336 | 1,521 |
| Detached house | 32 | 19 | 14 | 2 | 4 | 14 | 5 | 9 | 0 | 546,005 | 4,313 |
| Semi-detached house | 27 | 21 | 13 | 2 | 3 | 12 | 5 | 15 | 0 | 485,625 | 3,693 |
| Terraced house and other | 23 | 14 | 13 | 2 | 3 | 10 | 4 | 30 | 1 | 307,405 | 2,344 |
| Household Composition | |||||||||||
| 1 adult aged 65+, living alone | 17 | 10 | 10 | 2 | 3 | 2 | 7 | 48 | 0 | 164,745 | 1,235 |
| 1 adult aged under 65, living alone | 28 | 15 | 14 | 3 | 5 | 2 | 8 | 25 | 0 | 192,868 | 1,506 |
| 1 adult with children | 27 | 22 | 13 | 1 | 1 | 10 | 3 | 23 | 0 | 88,062 | 667 |
| 2 adults at least one 65+, no children | 29 | 16 | 14 | 3 | 4 | 6 | 6 | 21 | 0 | 202,069 | 1,550 |
| 2 adults both under 65, no children | 34 | 19 | 17 | 3 | 4 | 4 | 5 | 12 | 0 | 277,289 | 2,145 |
| 2 adults with 1-3 children | 30 | 21 | 12 | 2 | 3 | 25 | 3 | 4 | 0 | 407,141 | 3,131 |
| 3 or more adults, no children | 29 | 19 | 14 | 3 | 5 | 8 | 5 | 19 | 0 | 203,280 | 1,604 |
| Other households with children | 27 | 19 | 14 | 1 | 3 | 25 | 3 | 8 | 0 | 152,760 | 1,194 |
| Construction date | |||||||||||
| Before 1960 | 25 | 13 | 14 | 2 | 4 | 9 | 5 | 28 | 0 | 390,825 | 3,033 |
| 1961-1980 | 28 | 18 | 13 | 3 | 4 | 10 | 6 | 19 | 0 | 321,930 | 2,468 |
| 1981-2000 | 29 | 20 | 15 | 3 | 4 | 13 | 5 | 11 | 0 | 421,532 | 3,277 |
| 2001 or later | 33 | 22 | 13 | 2 | 3 | 15 | 5 | 9 | 0 | 431,296 | 3,313 |
| Unknown construction period | 23 | 15 | 13 | 2 | 3 | 10 | 4 | 29 | 1 | 122,632 | 941 |
| Nature of occupancy | |||||||||||
| Owner-occupied | 29 | 19 | 14 | 3 | 4 | 13 | 5 | 13 | 0 | 1,252,554 | 9,739 |
| Rented and other | 25 | 17 | 13 | 2 | 3 | 8 | 4 | 29 | 1 | 435,660 | 3,293 |
| Nationality | |||||||||||
| Ireland | 28 | 18 | 14 | 2 | 4 | 12 | 5 | 17 | 0 | 1,529,619 | 11,835 |
| Other EU | 30 | 19 | 13 | 2 | 1 | 12 | 5 | 17 | 1 | 126,125 | 952 |
| Other areas | 28 | 8 | 11 | 4 | 2 | 14 | 2 | 29 | 1 | 32,472 | 245 |
| Household working status | |||||||||||
| All adults working full time | 34 | 19 | 14 | 3 | 5 | 13 | 6 | 6 | 0 | 426,928 | 3,268 |
| One adult working and one adult not working | 28 | 20 | 15 | 2 | 4 | 15 | 4 | 11 | 0 | 437,591 | 3,403 |
| One adult or more working part time, all other adults (if any) working | 33 | 21 | 13 | 2 | 3 | 15 | 4 | 8 | 0 | 245,792 | 1,925 |
| All adults not working: Adults aged 65+ and inactive | 22 | 12 | 11 | 2 | 3 | 4 | 7 | 38 | 0 | 260,487 | 1,953 |
| All adults not working : Other | 23 | 18 | 12 | 2 | 2 | 8 | 4 | 32 | 0 | 277,029 | 2,172 |
| Not specified | 23 | 15 | 18 | 4 | 4 | 6 | 5 | 23 | 1 | 40,387 | 311 |
| Table 4: Which of these environmental initiatives are you familiar with? 1 See footnote | ||||||||||
| % of row | ||||||||||
| 01. Green Schools | 02. Green Homes | 03. Blue Flags | 04. Tidy Towns | 05. Green Business Scheme | 06. Stopfoodwaste.ie | 07. None of the above | 08. Not answered | Weighted Households | Sampled Households | |
| Total | 51 | 36 | 75 | 90 | 17 | 26 | 7 | 0 | 1,688,215 | 13,032 |
| Region | ||||||||||
| Border | 55 | 32 | 73 | 92 | 11 | 20 | 5 | 1 | 187,428 | 1,409 |
| Dublin | 42 | 35 | 75 | 87 | 18 | 31 | 8 | 1 | 472,011 | 3,490 |
| Mid-East | 63 | 41 | 77 | 90 | 23 | 24 | 7 | 0 | 186,846 | 1,312 |
| Mid-West | 52 | 38 | 74 | 91 | 15 | 24 | 7 | 0 | 138,754 | 985 |
| Midland | 52 | 26 | 62 | 90 | 13 | 19 | 8 | 0 | 104,979 | 860 |
| South-East | 57 | 32 | 79 | 92 | 19 | 25 | 6 | 0 | 186,280 | 1,615 |
| South-West | 51 | 36 | 75 | 88 | 14 | 26 | 8 | 0 | 248,706 | 2,035 |
| Western | 53 | 41 | 76 | 93 | 20 | 30 | 3 | . | 163,212 | 1,326 |
| Urban/Rural | ||||||||||
| Rural areas | 59 | 39 | 77 | 92 | 18 | 26 | 5 | 0 | 586,711 | 4,647 |
| Urban areas | 47 | 34 | 74 | 88 | 16 | 26 | 7 | 1 | 1,101,504 | 8,385 |
| Dwelling type | ||||||||||
| Apartment | 32 | 28 | 58 | 70 | 15 | 22 | 20 | 1 | 156,844 | 1,161 |
| Bungalow | 54 | 34 | 76 | 90 | 14 | 22 | 6 | 0 | 192,336 | 1,521 |
| Detached house | 59 | 40 | 80 | 94 | 20 | 30 | 4 | 0 | 546,005 | 4,313 |
| Semi-detached house | 52 | 36 | 76 | 91 | 17 | 27 | 6 | 0 | 485,625 | 3,693 |
| Terraced house and other | 45 | 33 | 72 | 91 | 14 | 25 | 6 | 1 | 307,405 | 2,344 |
| Household Composition | ||||||||||
| 1 adult aged 65+, living alone | 25 | 18 | 63 | 86 | 7 | 14 | 11 | 0 | 164,745 | 1,235 |
| 1 adult aged under 65, living alone | 38 | 34 | 75 | 89 | 16 | 24 | 8 | 1 | 192,868 | 1,506 |
| 1 adult with children | 64 | 33 | 66 | 87 | 15 | 25 | 8 | 0 | 88,062 | 667 |
| 2 adults at least one 65+, no children | 38 | 29 | 78 | 92 | 11 | 20 | 6 | 0 | 202,069 | 1,550 |
| 2 adults both under 65, no children | 46 | 40 | 76 | 89 | 22 | 29 | 7 | 0 | 277,289 | 2,145 |
| 2 adults with 1-3 children | 68 | 42 | 77 | 91 | 20 | 33 | 5 | 0 | 407,141 | 3,131 |
| 3 or more adults, no children | 48 | 35 | 74 | 90 | 17 | 27 | 6 | 1 | 203,280 | 1,604 |
| Other households with children | 74 | 43 | 79 | 92 | 19 | 29 | 4 | 0 | 152,760 | 1,194 |
| Construction date | ||||||||||
| Before 1960 | 42 | 32 | 73 | 90 | 15 | 24 | 7 | 0 | 390,825 | 3,033 |
| 1961-1980 | 46 | 33 | 78 | 92 | 15 | 25 | 5 | 0 | 321,930 | 2,468 |
| 1981-2000 | 60 | 41 | 80 | 93 | 20 | 30 | 4 | 0 | 421,532 | 3,277 |
| 2001 or later | 59 | 39 | 75 | 89 | 18 | 28 | 7 | 0 | 431,296 | 3,313 |
| Unknown construction period | 39 | 26 | 53 | 75 | 13 | 20 | 17 | 1 | 122,632 | 941 |
| Nature of occupancy | ||||||||||
| Owner-occupied | 54 | 38 | 80 | 93 | 18 | 28 | 4 | 0 | 1,252,554 | 9,739 |
| Rented and other | 42 | 28 | 59 | 79 | 13 | 21 | 15 | 1 | 435,660 | 3,293 |
| Nationality | ||||||||||
| Ireland | 53 | 37 | 78 | 93 | 17 | 27 | 4 | 0 | 1,529,619 | 11,835 |
| Other EU | 35 | 28 | 47 | 63 | 13 | 19 | 26 | 1 | 126,125 | 952 |
| Other areas | 32 | 21 | 26 | 46 | 8 | 13 | 37 | 1 | 32,472 | 245 |
| Household working status | ||||||||||
| All adults working full time | 56 | 43 | 81 | 92 | 24 | 32 | 5 | 0 | 426,928 | 3,268 |
| One adult working and one adult not working | 57 | 38 | 76 | 91 | 18 | 28 | 5 | 0 | 437,591 | 3,403 |
| One adult or more working part time, all other adults (if any) working | 64 | 42 | 79 | 92 | 20 | 32 | 5 | 0 | 245,792 | 1,925 |
| All adults not working: Adults aged 65+ and inactive | 29 | 21 | 69 | 88 | 8 | 16 | 9 | 0 | 260,487 | 1,953 |
| All adults not working : Other | 45 | 29 | 66 | 86 | 11 | 19 | 9 | 0 | 277,029 | 2,172 |
| Not specified | 39 | 31 | 58 | 73 | 17 | 24 | 17 | 2 | 40,387 | 311 |
| 1: More than one option allowed | ||||||||||
| Table 5: What is your household's main method for disposing of NON-RECYCLABLE household waste (e.g. contaminated food packaging)? | ||||||||||
| % of row | ||||||||||
| 01. Wheelie bin collection service | 02. Pre-paid bag collection service | 03. Share bin with a neighbour, relative or friend | 04. Bring it to a recycling centre that accepts it | 05. Bring it to a Pay-to-Use unit at a petrol station or similar location | 06. Bring it to work | 07. Other method | 08. Not answered | Weighted Households | Sampled Households | |
| Total | 80 | 4 | 4 | 8 | 0 | 1 | 3 | 0 | 1,688,215 | 13,032 |
| Region | ||||||||||
| Border | 77 | 3 | 4 | 11 | 0 | 1 | 4 | 0 | 187,428 | 1,409 |
| Dublin | 86 | 5 | 5 | 1 | 0 | 0 | 2 | 1 | 472,011 | 3,490 |
| Mid-East | 86 | 3 | 4 | 5 | 0 | 1 | 1 | . | 186,846 | 1,312 |
| Mid-West | 74 | 3 | 5 | 11 | 1 | 1 | 5 | 0 | 138,754 | 985 |
| Midland | 76 | 1 | 5 | 12 | 1 | 0 | 4 | 0 | 104,979 | 860 |
| South-East | 78 | 4 | 4 | 10 | 1 | 1 | 2 | 0 | 186,280 | 1,615 |
| South-West | 74 | 1 | 3 | 17 | 1 | 1 | 4 | 0 | 248,706 | 2,035 |
| Western | 74 | 7 | 4 | 10 | 0 | 1 | 3 | . | 163,212 | 1,326 |
| Urban/Rural | 0 | 0 | 0 | 0 | 0 | 0 | 0 | 0 | ||
| Rural areas | 67 | 4 | 5 | 18 | 1 | 1 | 5 | 0 | 586,711 | 4,647 |
| Urban areas | 86 | 4 | 4 | 3 | 0 | 0 | 2 | 0 | 1,101,504 | 8,385 |
| Dwelling type | 0 | 0 | 0 | 0 | 0 | 0 | 0 | 0 | ||
| Apartment | 69 | 5 | 18 | 2 | 0 | 0 | 5 | 1 | 156,844 | 1,161 |
| Bungalow | 69 | 4 | 5 | 16 | 1 | 1 | 5 | 0 | 192,336 | 1,521 |
| Detached house | 74 | 3 | 4 | 15 | 1 | 1 | 3 | 0 | 546,005 | 4,313 |
| Semi-detached house | 92 | 2 | 1 | 3 | 0 | 0 | 1 | 0 | 485,625 | 3,693 |
| Terraced house and other | 84 | 7 | 3 | 3 | 0 | 1 | 2 | 1 | 307,405 | 2,344 |
| Household Composition | 0 | 0 | 0 | 0 | 0 | 0 | 0 | 0 | ||
| 1 adult aged 65+, living alone | 67 | 5 | 12 | 9 | 1 | 0 | 7 | 0 | 164,745 | 1,235 |
| 1 adult aged under 65, living alone | 67 | 6 | 9 | 11 | 1 | 1 | 6 | 0 | 192,868 | 1,506 |
| 1 adult with children | 87 | 3 | 4 | 3 | 1 | 0 | 2 | 0 | 88,062 | 667 |
| 2 adults at least one 65+, no children | 77 | 4 | 4 | 11 | 1 | 0 | 3 | 0 | 202,069 | 1,550 |
| 2 adults both under 65, no children | 79 | 4 | 5 | 8 | 1 | 1 | 2 | 0 | 277,289 | 2,145 |
| 2 adults with 1-3 children | 88 | 2 | 2 | 6 | 0 | 0 | 1 | 0 | 407,141 | 3,131 |
| 3 or more adults, no children | 82 | 3 | 1 | 10 | 0 | 0 | 2 | 0 | 203,280 | 1,604 |
| Other households with children | 86 | 3 | 1 | 8 | 1 | 0 | 1 | 0 | 152,760 | 1,194 |
| Construction date | 0 | 0 | 0 | 0 | 0 | 0 | 0 | 0 | ||
| Before 1960 | 69 | 7 | 6 | 12 | 0 | 1 | 5 | 0 | 390,825 | 3,033 |
| 1961-1980 | 84 | 2 | 3 | 8 | 1 | 0 | 2 | 0 | 321,930 | 2,468 |
| 1981-2000 | 83 | 3 | 2 | 8 | 0 | 0 | 2 | 0 | 421,532 | 3,277 |
| 2001 or later | 83 | 2 | 5 | 6 | 0 | 1 | 2 | 0 | 431,296 | 3,313 |
| Unknown construction period | 76 | 5 | 6 | 7 | 1 | 0 | 4 | 1 | 122,632 | 941 |
| Nature of occupancy | 0 | 0 | 0 | 0 | 0 | 0 | 0 | 0 | ||
| Owner-occupied | 80 | 3 | 3 | 10 | 1 | 1 | 3 | 0 | 1,252,554 | 9,739 |
| Rented and other | 78 | 5 | 8 | 5 | 0 | 0 | 3 | 1 | 435,660 | 3,293 |
| Nationality | 0 | 0 | 0 | 0 | 0 | 0 | 0 | 0 | ||
| Ireland | 80 | 3 | 4 | 8 | 0 | 1 | 3 | 0 | 1,529,619 | 11,835 |
| Other EU | 75 | 5 | 6 | 9 | 1 | 1 | 3 | 1 | 126,125 | 952 |
| Other areas | 73 | 6 | 7 | 6 | 0 | 1 | 6 | 1 | 32,472 | 245 |
| Household working status | 0 | 0 | 0 | 0 | 0 | 0 | 0 | 0 | ||
| All adults working full time | 80 | 3 | 5 | 8 | 0 | 1 | 2 | 0 | 426,928 | 3,268 |
| One adult working and one adult not working | 83 | 3 | 2 | 10 | 0 | 0 | 2 | 0 | 437,591 | 3,403 |
| One adult or more working part time, all other adults (if any) working | 83 | 3 | 3 | 8 | 1 | 0 | 2 | 0 | 245,792 | 1,925 |
| All adults not working: Adults aged 65+ and inactive | 72 | 4 | 9 | 9 | 1 | 0 | 5 | 1 | 260,487 | 1,953 |
| All adults not working : Other | 79 | 4 | 5 | 8 | 1 | . | 4 | 0 | 277,029 | 2,172 |
| Not specified | 80 | 7 | 7 | 3 | 1 | 0 | 1 | 1 | 40,387 | 311 |
| Table 6: What is your household's main method for disposing of RECYCLABLE household waste (e.g. paper and cardboard packaging)? | ||||||||||
| % of row | ||||||||||
| 01. Recyclables wheelie bin collection service | 02. Recyclables pre-paid bag collection service | 03. Share recyclables bin with a neighbour | 04. Bring it to a recycling centre | 05. Bring it to work | 06. Do not recycle | 07. Other method | 08. Not answered | Weighted Households | Sampled Households | |
| Total | 76 | 3 | 4 | 12 | 0 | 2 | 2 | 0 | 1,688,215 | 13,032 |
| Region | ||||||||||
| Border | 61 | 2 | 4 | 23 | 1 | 6 | 5 | 0 | 187,428 | 1,409 |
| Dublin | 84 | 4 | 5 | 2 | 0 | 2 | 2 | 1 | 472,011 | 3,490 |
| Mid-East | 80 | 2 | 4 | 12 | 1 | 1 | 1 | . | 186,846 | 1,312 |
| Mid-West | 73 | 2 | 5 | 15 | 1 | 0 | 3 | 0 | 138,754 | 985 |
| Midland | 75 | 1 | 4 | 14 | 0 | 1 | 3 | 0 | 104,979 | 860 |
| South-East | 72 | 7 | 6 | 12 | 1 | 0 | 2 | 0 | 186,280 | 1,615 |
| South-West | 73 | 1 | 2 | 19 | 0 | 1 | 2 | 0 | 248,706 | 2,035 |
| Western | 73 | 6 | 4 | 14 | 1 | 0 | 2 | . | 163,212 | 1,326 |
| Urban/Rural | ||||||||||
| Rural areas | 62 | 4 | 5 | 24 | 1 | 2 | 3 | 0 | 586,711 | 4,647 |
| Urban areas | 83 | 3 | 4 | 6 | 0 | 2 | 2 | 0 | 1,101,504 | 8,385 |
| Dwelling type | ||||||||||
| Apartment | 62 | 4 | 16 | 4 | 0 | 7 | 6 | 1 | 156,844 | 1,161 |
| Bungalow | 65 | 3 | 5 | 20 | 1 | 2 | 3 | 0 | 192,336 | 1,521 |
| Detached house | 69 | 3 | 4 | 21 | 1 | 1 | 2 | 0 | 546,005 | 4,313 |
| Semi-detached house | 88 | 2 | 2 | 5 | 0 | 1 | 1 | 0 | 485,625 | 3,693 |
| Terraced house and other | 81 | 6 | 3 | 6 | 1 | 1 | 2 | 1 | 307,405 | 2,344 |
| Household Composition | ||||||||||
| 1 adult aged 65+, living alone | 64 | 4 | 10 | 12 | 0 | 3 | 6 | 0 | 164,745 | 1,235 |
| 1 adult aged under 65, living alone | 61 | 5 | 8 | 16 | 1 | 3 | 5 | 0 | 192,868 | 1,506 |
| 1 adult with children | 80 | 2 | 4 | 7 | 0 | 4 | 2 | 0 | 88,062 | 667 |
| 2 adults at least one 65+, no children | 73 | 4 | 4 | 15 | 0 | 1 | 3 | 0 | 202,069 | 1,550 |
| 2 adults both under 65, no children | 75 | 4 | 5 | 12 | 1 | 1 | 2 | 0 | 277,289 | 2,145 |
| 2 adults with 1-3 children | 84 | 2 | 2 | 9 | 0 | 1 | 1 | 0 | 407,141 | 3,131 |
| 3 or more adults, no children | 79 | 4 | 2 | 12 | 0 | 1 | 2 | 0 | 203,280 | 1,604 |
| Other households with children | 82 | 3 | 1 | 12 | 1 | 1 | 1 | 0 | 152,760 | 1,194 |
| Construction date | ||||||||||
| Before 1960 | 67 | 5 | 6 | 15 | 0 | 2 | 3 | 0 | 390,825 | 3,033 |
| 1961-1980 | 80 | 2 | 2 | 12 | 0 | 1 | 2 | 0 | 321,930 | 2,468 |
| 1981-2000 | 79 | 4 | 2 | 12 | 1 | 1 | 1 | 0 | 421,532 | 3,277 |
| 2001 or later | 78 | 2 | 5 | 10 | 1 | 1 | 2 | 0 | 431,296 | 3,313 |
| Unknown construction period | 72 | 5 | 6 | 10 | 0 | 3 | 4 | 1 | 122,632 | 941 |
| Nature of occupancy | ||||||||||
| Owner-occupied | 77 | 3 | 3 | 14 | 0 | 1 | 2 | 0 | 1,252,554 | 9,739 |
| Rented and other | 72 | 5 | 7 | 8 | 0 | 3 | 3 | 1 | 435,660 | 3,293 |
| Nationality | ||||||||||
| Ireland | 76 | 3 | 4 | 12 | 0 | 2 | 2 | 0 | 1,529,619 | 11,835 |
| Other EU | 72 | 5 | 5 | 12 | 1 | 2 | 3 | 1 | 126,125 | 952 |
| Other areas | 66 | 8 | 8 | 7 | 1 | 3 | 6 | 1 | 32,472 | 245 |
| Household working status | ||||||||||
| All adults working full time | 77 | 3 | 5 | 11 | 1 | 1 | 2 | 0 | 426,928 | 3,268 |
| One adult working and one adult not working | 79 | 3 | 2 | 13 | 0 | 1 | 1 | 0 | 437,591 | 3,403 |
| One adult or more working part time, all other adults (if any) working | 79 | 3 | 3 | 12 | 0 | 1 | 2 | 0 | 245,792 | 1,925 |
| All adults not working: Adults aged 65+ and inactive | 69 | 4 | 8 | 12 | . | 2 | 4 | 0 | 260,487 | 1,953 |
| All adults not working : Other | 71 | 4 | 5 | 13 | 0 | 3 | 3 | 0 | 277,029 | 2,172 |
| Not specified | 75 | 6 | 6 | 6 | 0 | 3 | 1 | 1 | 40,387 | 311 |
| Table 7: How does your household usually manage food and garden waste? 1 See footnote | |||||||||
| % of row | |||||||||
| 01. Compost food waste at home | 02. Feed food waste to animals | 03. Compost garden waste at home | 04. Use a brown bin or bring waste to a recycling centre that accepts it | 05. Use a collection bin other than a brown bin | 06. Other method | 07. Not answered | Weighted Households | Sampled Households | |
| Total | 16 | 22 | 19 | 35 | 26 | 10 | 0 | 1,688,215 | 13,032 |
| Region | |||||||||
| Border | 18 | 30 | 28 | 14 | 32 | 14 | . | 187,428 | 1,409 |
| Dublin | 7 | 4 | 7 | 54 | 29 | 9 | 1 | 472,011 | 3,490 |
| Mid-East | 13 | 18 | 20 | 30 | 35 | 11 | . | 186,846 | 1,312 |
| Mid-West | 21 | 29 | 23 | 42 | 15 | 8 | 0 | 138,754 | 985 |
| Midland | 17 | 42 | 27 | 18 | 24 | 9 | 0 | 104,979 | 860 |
| South-East | 22 | 29 | 25 | 32 | 20 | 9 | 0 | 186,280 | 1,615 |
| South-West | 20 | 30 | 21 | 28 | 26 | 9 | 0 | 248,706 | 2,035 |
| Western | 19 | 34 | 29 | 31 | 20 | 9 | . | 163,212 | 1,326 |
| Urban/Rural | |||||||||
| Rural areas | 25 | 45 | 34 | 16 | 18 | 11 | 0 | 586,711 | 4,647 |
| Urban areas | 11 | 10 | 12 | 45 | 30 | 9 | 0 | 1,101,504 | 8,385 |
| Dwelling type | |||||||||
| Apartment | 3 | 2 | 2 | 20 | 56 | 18 | 1 | 156,844 | 1,161 |
| Bungalow | 23 | 41 | 35 | 21 | 18 | 10 | . | 192,336 | 1,521 |
| Detached house | 24 | 38 | 32 | 24 | 19 | 9 | 0 | 546,005 | 4,313 |
| Semi-detached house | 11 | 10 | 12 | 52 | 25 | 7 | 0 | 485,625 | 3,693 |
| Terraced house and other | 10 | 11 | 9 | 45 | 28 | 10 | 0 | 307,405 | 2,344 |
| Household Composition | |||||||||
| 1 adult aged 65+, living alone | 12 | 24 | 15 | 31 | 22 | 15 | 0 | 164,745 | 1,235 |
| 1 adult aged under 65, living alone | 13 | 19 | 15 | 29 | 30 | 15 | 0 | 192,868 | 1,506 |
| 1 adult with children | 9 | 15 | 9 | 36 | 34 | 11 | 0 | 88,062 | 667 |
| 2 adults at least one 65+, no children | 21 | 29 | 25 | 35 | 19 | 7 | 0 | 202,069 | 1,550 |
| 2 adults both under 65, no children | 15 | 19 | 19 | 33 | 30 | 9 | 0 | 277,289 | 2,145 |
| 2 adults with 1-3 children | 16 | 21 | 20 | 37 | 28 | 8 | 0 | 407,141 | 3,131 |
| 3 or more adults, no children | 17 | 22 | 21 | 39 | 24 | 7 | 0 | 203,280 | 1,604 |
| Other households with children | 17 | 28 | 23 | 38 | 24 | 7 | 0 | 152,760 | 1,194 |
| Construction date | |||||||||
| Before 1960 | 17 | 28 | 19 | 33 | 20 | 10 | 0 | 390,825 | 3,033 |
| 1961-1980 | 15 | 20 | 21 | 43 | 23 | 7 | 0 | 321,930 | 2,468 |
| 1981-2000 | 16 | 22 | 22 | 37 | 26 | 8 | 0 | 421,532 | 3,277 |
| 2001 or later | 15 | 19 | 18 | 31 | 32 | 12 | 0 | 431,296 | 3,313 |
| Unknown construction period | 11 | 17 | 11 | 30 | 33 | 13 | 0 | 122,632 | 941 |
| Nature of occupancy | |||||||||
| Owner-occupied | 18 | 26 | 23 | 36 | 22 | 8 | 0 | 1,252,554 | 9,739 |
| Rented and other | 8 | 12 | 8 | 32 | 37 | 13 | 0 | 435,660 | 3,293 |
| Nationality | |||||||||
| Ireland | 16 | 23 | 20 | 35 | 25 | 9 | 0 | 1,529,619 | 11,835 |
| Other EU | 14 | 14 | 14 | 34 | 31 | 12 | 0 | 126,125 | 952 |
| Other areas | 12 | 3 | 9 | 31 | 38 | 17 | 1 | 32,472 | 245 |
| Household working status | |||||||||
| All adults working full time | 14 | 19 | 18 | 36 | 29 | 9 | 0 | 426,928 | 3,268 |
| One adult working and one adult not working | 17 | 25 | 22 | 37 | 23 | 8 | 0 | 437,591 | 3,403 |
| One adult or more working part time, all other adults (if any) working | 19 | 23 | 22 | 34 | 27 | 9 | 0 | 245,792 | 1,925 |
| All adults not working: Adults aged 65+ and inactive | 16 | 24 | 19 | 34 | 21 | 12 | 0 | 260,487 | 1,953 |
| All adults not working : Other | 13 | 22 | 17 | 33 | 27 | 11 | 0 | 277,029 | 2,172 |
| Not specified | 9 | 10 | 6 | 33 | 37 | 14 | 2 | 40,387 | 311 |
| 1 More than one option allowed | |||||||||
| Table 8a: What is your household's main method for disposing of out-of-date and unwanted household medicines? | |||||||||
| % of row | |||||||||
| 01. Put them in with household waste | 02. Bring to a recycling centre that accepts them | 03. Bring to a pharmacy | 04. Stored at home pending disposal | 05. Other disposal method | 06. Not applicable | 07. Not answered | Weighted Households | Sampled Households | |
| Total | 22 | 4 | 34 | 5 | 4 | 29 | 1 | 1,688,215 | 13,032 |
| Region | |||||||||
| Border | 27 | 4 | 24 | 8 | 5 | 31 | 1 | 187,428 | 1,409 |
| Dublin | 25 | 2 | 35 | 5 | 4 | 28 | 1 | 472,011 | 3,490 |
| Mid-East | 20 | 6 | 36 | 4 | 4 | 29 | 0 | 186,846 | 1,312 |
| Mid-West | 23 | 3 | 38 | 6 | 5 | 26 | 1 | 138,754 | 985 |
| Midland | 15 | 3 | 29 | 5 | 4 | 42 | 2 | 104,979 | 860 |
| South-East | 17 | 6 | 36 | 5 | 4 | 32 | 0 | 186,280 | 1,615 |
| South-West | 18 | 7 | 40 | 7 | 3 | 24 | 1 | 248,706 | 2,035 |
| Western | 24 | 5 | 34 | 4 | 4 | 29 | 0 | 163,212 | 1,326 |
| Urban/Rural | |||||||||
| Rural areas | 17 | 6 | 33 | 6 | 4 | 33 | 0 | 586,711 | 4,647 |
| Urban areas | 25 | 3 | 35 | 5 | 4 | 27 | 1 | 1,101,504 | 8,385 |
| Dwelling type | |||||||||
| Apartment | 30 | 3 | 22 | 4 | 2 | 38 | 1 | 156,844 | 1,161 |
| Bungalow | 17 | 5 | 35 | 7 | 5 | 31 | 1 | 192,336 | 1,521 |
| Detached house | 18 | 6 | 37 | 6 | 4 | 29 | 0 | 546,005 | 4,313 |
| Semi-detached house | 25 | 3 | 34 | 5 | 4 | 28 | 1 | 485,625 | 3,693 |
| Terraced house and other | 24 | 3 | 37 | 5 | 4 | 26 | 1 | 307,405 | 2,344 |
| Household Composition | |||||||||
| 1 adult aged 65+, living alone | 11 | 2 | 49 | 6 | 5 | 26 | 1 | 164,745 | 1,235 |
| 1 adult aged under 65, living alone | 19 | 3 | 27 | 5 | 3 | 42 | 1 | 192,868 | 1,506 |
| 1 adult with children | 38 | 3 | 24 | 5 | 4 | 26 | 0 | 88,062 | 667 |
| 2 adults at least one 65+, no children | 11 | 5 | 51 | 5 | 5 | 22 | 1 | 202,069 | 1,550 |
| 2 adults both under 65, no children | 22 | 4 | 30 | 5 | 3 | 36 | 1 | 277,289 | 2,145 |
| 2 adults with 1-3 children | 32 | 5 | 27 | 6 | 4 | 27 | 0 | 407,141 | 3,131 |
| 3 or more adults, no children | 17 | 5 | 39 | 5 | 5 | 28 | 1 | 203,280 | 1,604 |
| Other households with children | 26 | 5 | 33 | 5 | 5 | 25 | 1 | 152,760 | 1,194 |
| Construction date | |||||||||
| Before 1960 | 17 | 4 | 39 | 6 | 4 | 29 | 1 | 390,825 | 3,033 |
| 1961-1980 | 18 | 4 | 42 | 5 | 5 | 25 | 1 | 321,930 | 2,468 |
| 1981-2000 | 22 | 5 | 35 | 6 | 4 | 28 | 0 | 421,532 | 3,277 |
| 2001 or later | 29 | 5 | 26 | 4 | 3 | 32 | 0 | 431,296 | 3,313 |
| Unknown construction period | 24 | 4 | 26 | 5 | 4 | 37 | 1 | 122,632 | 941 |
| Nature of occupancy | |||||||||
| Owner-occupied | 20 | 4 | 38 | 6 | 4 | 28 | 1 | 1,252,554 | 9,739 |
| Rented and other | 29 | 3 | 24 | 4 | 3 | 34 | 1 | 435,660 | 3,293 |
| Nationality | |||||||||
| Ireland | 22 | 4 | 35 | 5 | 4 | 29 | 1 | 1,529,619 | 11,835 |
| Other EU | 25 | 4 | 29 | 4 | 1 | 35 | 1 | 126,125 | 952 |
| Other areas | 25 | 7 | 20 | 5 | 2 | 40 | 2 | 32,472 | 245 |
| Household working status | |||||||||
| All adults working full time | 26 | 4 | 25 | 6 | 3 | 36 | 1 | 426,928 | 3,268 |
| One adult working and one adult not working | 22 | 5 | 36 | 5 | 5 | 26 | 1 | 437,591 | 3,403 |
| One adult or more working part time, all other adults (if any) working | 26 | 5 | 30 | 5 | 4 | 29 | 0 | 245,792 | 1,925 |
| All adults not working: Adults aged 65+ and inactive | 10 | 3 | 52 | 6 | 5 | 23 | 1 | 260,487 | 1,953 |
| All adults not working : Other | 22 | 3 | 37 | 5 | 4 | 28 | 1 | 277,029 | 2,172 |
| Not specified | 30 | 3 | 25 | 4 | 1 | 35 | 2 | 40,387 | 311 |
| Table 8b: What is your household's main method for disposing of small electrical and electronic equipment such as hair-dryers, toasters, kettles and calculators? | ||||||||||
| % of row | ||||||||||
| 01. Bring them back to retailer | 02. Put them in with household waste | 03. Bring to a recycling centre that accepts them | 04. Reuse e.g. give it to family member or friend | 05. Stored at home pending disposal | 06. Other method | 07. Not applicable | 08. Not answered | Weighted Households | Sampled Households | |
| Total | 27 | 7 | 50 | 2 | 6 | 2 | 7 | 1 | 1,688,215 | 13,032 |
| Region | ||||||||||
| Border | 21 | 6 | 53 | 2 | 8 | 2 | 8 | 1 | 187,428 | 1,409 |
| Dublin | 35 | 7 | 39 | 2 | 6 | 3 | 8 | 1 | 472,011 | 3,490 |
| Mid-East | 26 | 7 | 55 | 3 | 5 | 1 | 3 | 0 | 186,846 | 1,312 |
| Mid-West | 16 | 6 | 65 | 0 | 6 | 3 | 4 | 0 | 138,754 | 985 |
| Midland | 17 | 8 | 50 | 1 | 9 | 2 | 13 | 1 | 104,979 | 860 |
| South-East | 38 | 7 | 42 | 1 | 5 | 1 | 6 | 0 | 186,280 | 1,615 |
| South-West | 22 | 7 | 55 | 1 | 5 | 2 | 7 | 0 | 248,706 | 2,035 |
| Western | 19 | 5 | 62 | 1 | 5 | 2 | 6 | 0 | 163,212 | 1,326 |
| Urban/Rural | 0 | 0 | 0 | 0 | 0 | 0 | 0 | 0 | ||
| Rural areas | 23 | 5 | 57 | 1 | 6 | 2 | 6 | 0 | 586,711 | 4,647 |
| Urban areas | 28 | 8 | 46 | 2 | 6 | 2 | 8 | 1 | 1,101,504 | 8,385 |
| Dwelling type | 0 | 0 | 0 | 0 | 0 | 0 | 0 | 0 | ||
| Apartment | 24 | 12 | 32 | 4 | 4 | 4 | 19 | 1 | 156,844 | 1,161 |
| Bungalow | 22 | 5 | 58 | 1 | 5 | 2 | 5 | 0 | 192,336 | 1,521 |
| Detached house | 24 | 5 | 58 | 1 | 5 | 1 | 5 | 0 | 546,005 | 4,313 |
| Semi-detached house | 30 | 7 | 48 | 1 | 6 | 2 | 6 | 0 | 485,625 | 3,693 |
| Terraced house and other | 29 | 8 | 42 | 2 | 8 | 3 | 7 | 1 | 307,405 | 2,344 |
| Household Composition | 0 | 0 | 0 | 0 | 0 | 0 | 0 | 0 | ||
| 1 adult aged 65+, living alone | 28 | 5 | 37 | 3 | 10 | 5 | 13 | 0 | 164,745 | 1,235 |
| 1 adult aged under 65, living alone | 25 | 7 | 46 | 2 | 7 | 3 | 11 | 0 | 192,868 | 1,506 |
| 1 adult with children | 24 | 12 | 41 | 2 | 7 | 3 | 10 | 0 | 88,062 | 667 |
| 2 adults at least one 65+, no children | 32 | 4 | 52 | 1 | 5 | 1 | 4 | 1 | 202,069 | 1,550 |
| 2 adults both under 65, no children | 27 | 6 | 51 | 2 | 5 | 2 | 8 | 1 | 277,289 | 2,145 |
| 2 adults with 1-3 children | 24 | 8 | 54 | 2 | 6 | 2 | 5 | 0 | 407,141 | 3,131 |
| 3 or more adults, no children | 28 | 6 | 51 | 1 | 6 | 1 | 6 | 1 | 203,280 | 1,604 |
| Other households with children | 26 | 8 | 55 | 1 | 4 | 1 | 4 | 0 | 152,760 | 1,194 |
| Construction date | 0 | 0 | 0 | 0 | 0 | 0 | 0 | 0 | ||
| Before 1960 | 28 | 6 | 46 | 2 | 8 | 3 | 8 | 1 | 390,825 | 3,033 |
| 1961-1980 | 31 | 4 | 51 | 1 | 6 | 2 | 4 | 1 | 321,930 | 2,468 |
| 1981-2000 | 27 | 6 | 55 | 1 | 4 | 2 | 5 | 0 | 421,532 | 3,277 |
| 2001 or later | 24 | 8 | 51 | 2 | 6 | 2 | 7 | 0 | 431,296 | 3,313 |
| Unknown construction period | 20 | 10 | 38 | 2 | 8 | 3 | 17 | 1 | 122,632 | 941 |
| Nature of occupancy | 0 | 0 | 0 | 0 | 0 | 0 | 0 | 0 | ||
| Owner-occupied | 28 | 5 | 54 | 1 | 5 | 2 | 4 | 0 | 1,252,554 | 9,739 |
| Rented and other | 22 | 11 | 39 | 3 | 7 | 3 | 15 | 1 | 435,660 | 3,293 |
| Nationality | 0 | 0 | 0 | 0 | 0 | 0 | 0 | 0 | ||
| Ireland | 27 | 6 | 51 | 1 | 6 | 2 | 6 | 0 | 1,529,619 | 11,835 |
| Other EU | 22 | 10 | 41 | 3 | 4 | 4 | 15 | 1 | 126,125 | 952 |
| Other areas | 16 | 8 | 35 | 6 | 5 | 2 | 27 | 2 | 32,472 | 245 |
| Household working status | 0 | 0 | 0 | 0 | 0 | 0 | 0 | 0 | ||
| All adults working full time | 27 | 6 | 51 | 1 | 5 | 2 | 7 | 0 | 426,928 | 3268 |
| One adult working and one adult not working | 27 | 6 | 54 | 1 | 5 | 2 | 4 | 0 | 437,591 | 3403 |
| One adult or more working part time, all other adults (if any) working | 25 | 6 | 55 | 1 | 6 | 2 | 5 | 0 | 245,792 | 1,925 |
| All adults not working: Adults aged 65+ and inactive | 30 | 4 | 43 | 2 | 9 | 3 | 9 | 1 | 260,487 | 1,953 |
| All adults not working : Other | 25 | 10 | 44 | 2 | 7 | 2 | 10 | 1 | 277,029 | 2,172 |
| Not specified | 20 | 10 | 39 | 3 | 5 | 3 | 18 | 2 | 40,387 | 311 |
| Table 8c: What is your household's main method for disposing of non-cooking waste oils (e.g. car or lawnmower oil)? | |||||||||
| % of row | |||||||||
| 01. Put them in with household waste | 02. Bring to a recycling centre that accepts them | 03. Dispose of in a skip | 04. Stored at home pending disposal | 05. Other method | 06. Not relevant | 07. Not answered | Weighted Households | Sampled Households | |
| Total | 3 | 12 | 1 | 4 | 4 | 75 | 1 | 1,688,215 | 13,032 |
| Region | |||||||||
| Border | 5 | 10 | 3 | 7 | 7 | 67 | 1 | 187,428 | 1,409 |
| Dublin | 2 | 8 | 1 | 1 | 1 | 86 | 1 | 472,011 | 3,490 |
| Mid-East | 4 | 17 | 2 | 5 | 2 | 71 | 0 | 186,846 | 1,312 |
| Mid-West | 4 | 17 | 1 | 6 | 4 | 66 | 1 | 138,754 | 985 |
| Midland | 2 | 7 | 0 | 2 | 5 | 83 | 2 | 104,979 | 860 |
| South-East | 5 | 8 | 1 | 6 | 5 | 75 | 0 | 186,280 | 1,615 |
| South-West | 3 | 18 | 2 | 4 | 3 | 68 | 1 | 248,706 | 2,035 |
| Western | 3 | 15 | 1 | 3 | 6 | 71 | 1 | 163,212 | 1,326 |
| Urban/Rural | |||||||||
| Rural areas | 3 | 16 | 2 | 7 | 7 | 65 | 1 | 586,711 | 4,647 |
| Urban areas | 4 | 10 | 1 | 2 | 2 | 81 | 1 | 1,101,504 | 8,385 |
| Dwelling type | |||||||||
| Apartment | 3 | 5 | 1 | 1 | 1 | 89 | 1 | 156,844 | 1,161 |
| Bungalow | 4 | 17 | 2 | 6 | 5 | 65 | 1 | 192,336 | 1,521 |
| Detached house | 2 | 16 | 2 | 6 | 6 | 67 | 1 | 546,005 | 4,313 |
| Semi-detached house | 3 | 10 | 1 | 3 | 2 | 80 | 1 | 485,625 | 3,693 |
| Terraced house and other | 4 | 8 | 1 | 2 | 1 | 83 | 1 | 307,405 | 2,344 |
| Household Composition | |||||||||
| 1 adult aged 65+, living alone | 2 | 5 | 1 | 2 | 2 | 87 | 0 | 164,745 | 1,235 |
| 1 adult aged under 65, living alone | 3 | 8 | 1 | 4 | 3 | 81 | 0 | 192,868 | 1,506 |
| 1 adult with children | 5 | 5 | 1 | 1 | 2 | 85 | 0 | 88,062 | 667 |
| 2 adults at least one 65+, no children | 3 | 15 | 1 | 4 | 4 | 72 | 1 | 202,069 | 1,550 |
| 2 adults both under 65, no children | 3 | 13 | 1 | 4 | 3 | 76 | 1 | 277,289 | 2,145 |
| 2 adults with 1-3 children | 4 | 14 | 1 | 4 | 4 | 72 | 1 | 407,141 | 3,131 |
| 3 or more adults, no children | 3 | 15 | 1 | 5 | 4 | 70 | 1 | 203,280 | 1,604 |
| Other households with children | 4 | 14 | 2 | 5 | 5 | 69 | 1 | 152,760 | 1,194 |
| Construction date | |||||||||
| Before 1960 | 3 | 11 | 1 | 5 | 4 | 75 | 1 | 390,825 | 3,033 |
| 1961-1980 | 3 | 13 | 1 | 4 | 3 | 75 | 1 | 321,930 | 2,468 |
| 1981-2000 | 3 | 14 | 1 | 5 | 4 | 72 | 1 | 421,532 | 3,277 |
| 2001 or later | 4 | 12 | 1 | 3 | 4 | 76 | 1 | 431,296 | 3,313 |
| Unknown construction period | 4 | 5 | 1 | 3 | 3 | 83 | 1 | 122,632 | 941 |
| Nature of occupancy | |||||||||
| Owner-occupied | 3 | 14 | 1 | 4 | 4 | 73 | 1 | 1,252,554 | 9,739 |
| Rented and other | 5 | 6 | 1 | 2 | 2 | 83 | 1 | 435,660 | 3,293 |
| Nationality | |||||||||
| Ireland | 3 | 12 | 1 | 4 | 4 | 75 | 1 | 1,529,619 | 11,835 |
| Other EU | 3 | 12 | 1 | 2 | 3 | 79 | 1 | 126,125 | 952 |
| Other areas | 3 | 7 | 2 | 1 | 3 | 83 | 2 | 32,472 | 245 |
| Household working status | |||||||||
| All adults working full time | 3 | 13 | 1 | 3 | 4 | 76 | 1 | 426,928 | 3,268 |
| One adult working and one adult not working | 4 | 15 | 1 | 5 | 5 | 70 | 1 | 437,591 | 3,403 |
| One adult or more working part time, all other adults (if any) working | 4 | 14 | 1 | 4 | 4 | 72 | 1 | 245,792 | 1,925 |
| All adults not working: Adults aged 65+ and inactive | 2 | 8 | 1 | 2 | 3 | 82 | 1 | 260,487 | 1,953 |
| All adults not working : Other | 5 | 9 | 1 | 4 | 3 | 78 | 1 | 277,029 | 2,172 |
| Not specified | 3 | 7 | 1 | 5 | 2 | 80 | 2 | 40,387 | 311 |
| Table 8d: What is your household's main method for disposing of household and garden chemical wastes (e.g. bleaches pesticides/herbicides and wood stains/varnishes)? | |||||||||
| % of row | |||||||||
| 01. Put them in with household waste | 02. Bring to a recycling centre that accepts them | 03. Dispose of in a skip | 04. Stored at home pending disposal | 05. Other method | 06. Not relevant | 07. Not answered | Weighted Households | Sampled Households | |
| Total | 7 | 20 | 2 | 9 | 2 | 59 | 1 | 1,688,215 | 13,032 |
| Region | |||||||||
| Border | 12 | 20 | 4 | 11 | 3 | 49 | 0 | 187,428 | 1,409 |
| Dublin | 4 | 15 | 1 | 8 | 1 | 70 | 1 | 472,011 | 3,490 |
| Mid-East | 6 | 24 | 3 | 10 | 1 | 55 | 0 | 186,846 | 1,312 |
| Mid-West | 9 | 24 | 1 | 11 | 2 | 53 | 1 | 138,754 | 985 |
| Midland | 8 | 19 | 2 | 6 | 2 | 62 | 1 | 104,979 | 860 |
| South-East | 11 | 18 | 2 | 16 | 2 | 51 | 1 | 186,280 | 1,615 |
| South-West | 7 | 26 | 3 | 9 | 2 | 53 | 1 | 248,706 | 2,035 |
| Western | 7 | 25 | 1 | 6 | 2 | 59 | 0 | 163,212 | 1,326 |
| Urban/Rural | |||||||||
| Rural areas | 9 | 27 | 2 | 11 | 3 | 47 | 0 | 586,711 | 4,647 |
| Urban areas | 6 | 17 | 2 | 8 | 1 | 65 | 1 | 1,101,504 | 8,385 |
| Dwelling type | |||||||||
| Apartment | 3 | 3 | 1 | 3 | 1 | 88 | 1 | 156,844 | 1,161 |
| Bungalow | 10 | 27 | 2 | 13 | 2 | 44 | 1 | 192,336 | 1,521 |
| Detached house | 7 | 28 | 3 | 11 | 3 | 49 | 0 | 546,005 | 4,313 |
| Semi-detached house | 8 | 18 | 2 | 9 | 1 | 61 | 0 | 485,625 | 3,693 |
| Terraced house and other | 7 | 15 | 1 | 8 | 2 | 67 | 1 | 307,405 | 2,344 |
| Household Composition | |||||||||
| 1 adult aged 65+, living alone | 4 | 13 | 2 | 7 | 3 | 70 | 1 | 164,745 | 1,235 |
| 1 adult aged under 65, living alone | 6 | 14 | 1 | 8 | 2 | 68 | 0 | 192,868 | 1,506 |
| 1 adult with children | 9 | 10 | 2 | 6 | 2 | 72 | 0 | 88,062 | 667 |
| 2 adults at least one 65+, no children | 6 | 27 | 2 | 10 | 2 | 52 | 1 | 202,069 | 1,550 |
| 2 adults both under 65, no children | 8 | 21 | 2 | 8 | 2 | 59 | 1 | 277,289 | 2,145 |
| 2 adults with 1-3 children | 9 | 22 | 2 | 11 | 2 | 53 | 0 | 407,141 | 3,131 |
| 3 or more adults, no children | 6 | 23 | 2 | 11 | 2 | 55 | 1 | 203,280 | 1,604 |
| Other households with children | 8 | 24 | 3 | 10 | 2 | 53 | 1 | 152,760 | 1,194 |
| Construction date | |||||||||
| Before 1960 | 6 | 20 | 2 | 9 | 3 | 60 | 1 | 390,825 | 3,033 |
| 1961-1980 | 6 | 24 | 2 | 11 | 1 | 56 | 1 | 321,930 | 2,468 |
| 1981-2000 | 8 | 23 | 2 | 10 | 2 | 54 | 0 | 421,532 | 3,277 |
| 2001 or later | 9 | 19 | 2 | 9 | 1 | 59 | 0 | 431,296 | 3,313 |
| Unknown construction period | 6 | 10 | 1 | 5 | 1 | 76 | 1 | 122,632 | 941 |
| Nature of occupancy | |||||||||
| Owner-occupied | 7 | 25 | 2 | 11 | 2 | 52 | 1 | 1,252,554 | 9,739 |
| Rented and other | 7 | 8 | 1 | 5 | 1 | 76 | 1 | 435,660 | 3,293 |
| Nationality | |||||||||
| Ireland | 8 | 21 | 2 | 10 | 2 | 57 | 1 | 1,529,619 | 11,835 |
| Other EU | 5 | 15 | 1 | 5 | 2 | 71 | 1 | 126,125 | 952 |
| Other areas | 2 | 11 | 1 | 5 | 0 | 78 | 2 | 32,472 | 245 |
| Household working status | |||||||||
| All adults working full time | 7 | 20 | 2 | 10 | 2 | 58 | 1 | 426,928 | 3,268 |
| One adult working and one adult not working | 8 | 24 | 3 | 11 | 2 | 53 | 1 | 437,591 | 3,403 |
| One adult or more working part time, all other adults (if any) working | 7 | 24 | 2 | 9 | 2 | 55 | 0 | 245,792 | 1,925 |
| All adults not working: Adults aged 65+ and inactive | 5 | 18 | 2 | 8 | 2 | 64 | 1 | 260,487 | 1,953 |
| All adults not working : Other | 8 | 16 | 1 | 8 | 2 | 64 | 1 | 277,029 | 2,172 |
| Not specified | 10 | 10 | 2 | 6 | 1 | 69 | 2 | 40,387 | 311 |
| Table 9a: Does your household recycle small batteries? | |||||
| % of row | |||||
| 01. Recycles small batteries | 02. Does not recycle small batteries | 03. Not answered | Weighted Households | Sampled Households | |
| Total | 72 | 27 | 1 | 1,688,215 | 13,032 |
| Region | |||||
| Border | 65 | 34 | 0 | 187,428 | 1,409 |
| Dublin | 71 | 28 | 1 | 472,011 | 3,490 |
| Mid-East | 75 | 25 | 1 | 186,846 | 1,312 |
| Mid-West | 71 | 29 | 0 | 138,754 | 985 |
| Midland | 73 | 26 | 1 | 104,979 | 860 |
| South-East | 77 | 23 | 0 | 186,280 | 1,615 |
| South-West | 73 | 27 | 0 | 248,706 | 2,035 |
| Western | 75 | 25 | 0 | 163,212 | 1,326 |
| Urban/Rural | |||||
| Rural areas | 75 | 25 | 0 | 586,711 | 4,647 |
| Urban areas | 71 | 29 | 1 | 1,101,504 | 8,385 |
| Dwelling type | |||||
| Apartment | 61 | 38 | 1 | 156,844 | 1,161 |
| Bungalow | 73 | 26 | 0 | 192,336 | 1,521 |
| Detached house | 77 | 23 | 0 | 546,005 | 4,313 |
| Semi-detached house | 72 | 27 | 0 | 485,625 | 3,693 |
| Terraced house and other | 68 | 32 | 1 | 307,405 | 2,344 |
| Household Composition | |||||
| 1 adult aged 65+, living alone | 59 | 41 | 0 | 164,745 | 1,235 |
| 1 adult aged under 65, living alone | 64 | 35 | 0 | 192,868 | 1,506 |
| 1 adult with children | 65 | 34 | 0 | 88,062 | 667 |
| 2 adults at least one 65+, no children | 72 | 28 | 0 | 202,069 | 1,550 |
| 2 adults both under 65, no children | 73 | 27 | 1 | 277,289 | 2,145 |
| 2 adults with 1-3 children | 78 | 21 | 0 | 407,141 | 3,131 |
| 3 or more adults, no children | 74 | 25 | 1 | 203,280 | 1,604 |
| Other households with children | 80 | 20 | 0 | 152,760 | 1,194 |
| Construction date | |||||
| Before 1960 | 69 | 30 | 1 | 390,825 | 3,033 |
| 1961-1980 | 73 | 26 | 1 | 321,930 | 2,468 |
| 1981-2000 | 76 | 23 | 0 | 421,532 | 3,277 |
| 2001 or later | 73 | 27 | 0 | 431,296 | 3,313 |
| Unknown construction period | 62 | 37 | 1 | 122,632 | 941 |
| Nature of occupancy | |||||
| Owner-occupied | 75 | 24 | 0 | 1,252,554 | 9,739 |
| Rented and other | 63 | 36 | 1 | 435,660 | 3,293 |
| Nationality | |||||
| Ireland | 72 | 27 | 0 | 1,529,619 | 11,835 |
| Other EU | 75 | 24 | 1 | 126,125 | 952 |
| Other areas | 62 | 36 | 2 | 32,472 | 245 |
| Household working status | |||||
| All adults working full time | 75 | 25 | 1 | 426,928 | 3,268 |
| One adult working and one adult not working | 77 | 23 | 0 | 437,591 | 3,403 |
| One adult or more working part time, all other adults (if any) working | 79 | 21 | 0 | 245,792 | 1,925 |
| All adults not working: Adults aged 65+ and inactive | 64 | 36 | 1 | 260,487 | 1,953 |
| All adults not working : Other | 64 | 35 | 1 | 277,029 | 2,172 |
| Not specified | 59 | 39 | 2 | 40,387 | 311 |
| Table 9b: How does your household recycle small batteries? 1 See footnote | |||||||
| % of row | |||||||
| 01. Bring to a shop or recycling centre | 02. Bring in to work for recycling | 03. Children bring into school for recycling | 04. Other collection point | 05. Not relevant (Does not recycle small batteries) | Weighted Households | Sampled Households | |
| Total | 52 | 10 | 8 | 4 | 28 | 1,688,215 | 13,032 |
| Region | |||||||
| Border | 46 | 8 | 10 | 3 | 35 | 187,428 | 1,409 |
| Dublin | 49 | 14 | 7 | 4 | 29 | 472,011 | 3,490 |
| Mid-East | 48 | 12 | 13 | 3 | 25 | 186,846 | 1,312 |
| Mid-West | 44 | 12 | 13 | 4 | 29 | 138,754 | 985 |
| Midland | 56 | 6 | 7 | 4 | 27 | 104,979 | 860 |
| South-East | 56 | 8 | 13 | 5 | 23 | 186,280 | 1,615 |
| South-West | 58 | 8 | 4 | 3 | 27 | 248,706 | 2,035 |
| Western | 62 | 7 | 3 | 4 | 25 | 163,212 | 1,326 |
| Urban/Rural | |||||||
| Rural areas | 54 | 8 | 10 | 4 | 25 | 586,711 | 4,647 |
| Urban areas | 51 | 11 | 7 | 4 | 29 | 1,101,504 | 8,385 |
| Dwelling type | |||||||
| Apartment | 40 | 14 | 4 | 5 | 39 | 156,844 | 1,161 |
| Bungalow | 53 | 10 | 8 | 4 | 27 | 192,336 | 1,521 |
| Detached house | 57 | 7 | 10 | 4 | 23 | 546,005 | 4,313 |
| Semi-detached house | 50 | 11 | 10 | 3 | 28 | 485,625 | 3,693 |
| Terraced house and other | 50 | 10 | 5 | 4 | 32 | 307,405 | 2,344 |
| Household Composition | |||||||
| 1 adult aged 65+, living alone | 50 | 3 | 2 | 6 | 41 | 164,745 | 1,235 |
| 1 adult aged under 65, living alone | 48 | 13 | 1 | 4 | 36 | 192,868 | 1,506 |
| 1 adult with children | 39 | 4 | 19 | 4 | 35 | 88,062 | 667 |
| 2 adults at least one 65+, no children | 62 | 4 | 2 | 4 | 28 | 202,069 | 1,550 |
| 2 adults both under 65, no children | 52 | 15 | 2 | 4 | 27 | 277,289 | 2,145 |
| 2 adults with 1-3 children | 49 | 12 | 18 | 3 | 22 | 407,141 | 3,131 |
| 3 or more adults, no children | 59 | 10 | 3 | 4 | 26 | 203,280 | 1,604 |
| Other households with children | 52 | 9 | 19 | 3 | 20 | 152,760 | 1,194 |
| Construction date | |||||||
| Before 1960 | 53 | 8 | 5 | 5 | 31 | 390,825 | 3,033 |
| 1961-1980 | 57 | 9 | 5 | 4 | 27 | 321,930 | 2,468 |
| 1981-2000 | 54 | 11 | 10 | 4 | 24 | 421,532 | 3,277 |
| 2001 or later | 47 | 12 | 12 | 3 | 27 | 431,296 | 3,313 |
| Unknown construction period | 44 | 9 | 7 | 3 | 38 | 122,632 | 941 |
| Nature of occupancy | |||||||
| Owner-occupied | 55 | 10 | 9 | 4 | 25 | 1,252,554 | 9,739 |
| Rented and other | 43 | 10 | 7 | 4 | 37 | 435,660 | 3,293 |
| Nationality | |||||||
| Ireland | 52 | 10 | 8 | 4 | 28 | 1,529,619 | 11,835 |
| Other EU | 55 | 10 | 7 | 4 | 25 | 126,125 | 952 |
| Other areas | 42 | 8 | 9 | 6 | 38 | 32,472 | 245 |
| Household working status | |||||||
| All adults working full time | 46 | 19 | 9 | 3 | 25 | 426,928 | 3,268 |
| One adult working and one adult not working | 57 | 8 | 10 | 4 | 23 | 437,591 | 3,403 |
| One adult or more working part time, all other adults (if any) working | 53 | 12 | 11 | 4 | 21 | 245,792 | 1,925 |
| All adults not working: Adults aged 65+ and inactive | 55 | 3 | 2 | 5 | 36 | 260,487 | 1,953 |
| All adults not working : Other | 51 | 2 | 8 | 4 | 36 | 277,029 | 2,172 |
| Not specified | 40 | 12 | 4 | 4 | 41 | 40,387 | 311 |
| 1 More than one option allowed | |||||||
| Table 9c: What is the main reason your household doesn't recycle small batteries? | |||||||||
| % of row | |||||||||
| 01. Didn't know they could be recycled | 02. Don't know where/how to recycle them | 03. Recycling small batteries is not a priority for me | 04. Always use rechargeable batteries | 05. Forget to bring them for recycling | 06. Other reason | 07. Not relevant (Household recycles batteries) | Weighted Households | Sampled Households | |
| Total | 6 | 3 | 5 | 2 | 5 | 6 | 73 | 1,688,215 | 13,032 |
| Region | |||||||||
| Border | 7 | 4 | 6 | 2 | 9 | 7 | 66 | 187,428 | 1,409 |
| Dublin | 5 | 3 | 5 | 2 | 6 | 7 | 72 | 472,011 | 3,490 |
| Mid-East | 7 | 2 | 6 | 2 | 5 | 3 | 75 | 186,846 | 1,312 |
| Mid-West | 4 | 4 | 8 | 1 | 5 | 6 | 71 | 138,754 | 985 |
| Midland | 6 | 4 | 3 | 1 | 7 | 5 | 74 | 104,979 | 860 |
| South-East | 6 | 3 | 3 | 3 | 3 | 4 | 77 | 186,280 | 1,615 |
| South-West | 7 | 4 | 6 | 1 | 3 | 5 | 73 | 248,706 | 2,035 |
| Western | 5 | 4 | 4 | 2 | 4 | 6 | 75 | 163,212 | 1,326 |
| Urban/Rural | |||||||||
| Rural areas | 5 | 4 | 4 | 2 | 5 | 5 | 75 | 586,711 | 4,647 |
| Urban areas | 6 | 3 | 6 | 2 | 6 | 6 | 71 | 1,101,504 | 8,385 |
| Dwelling type | |||||||||
| Apartment | 8 | 5 | 6 | 2 | 6 | 11 | 62 | 156,844 | 1,161 |
| Bungalow | 6 | 5 | 4 | 2 | 6 | 4 | 74 | 192,336 | 1,521 |
| Detached house | 5 | 3 | 4 | 2 | 5 | 4 | 77 | 546,005 | 4,313 |
| Semi-detached house | 6 | 3 | 5 | 2 | 6 | 5 | 73 | 485,625 | 3,693 |
| Terraced house and other | 6 | 4 | 8 | 2 | 6 | 7 | 68 | 307,405 | 2,344 |
| Household Composition | |||||||||
| 1 adult aged 65+, living alone | 9 | 7 | 6 | 1 | 5 | 13 | 59 | 164,745 | 1,235 |
| 1 adult aged under 65, living alone | 7 | 4 | 7 | 2 | 6 | 8 | 65 | 192,868 | 1,506 |
| 1 adult with children | 9 | 3 | 7 | 2 | 6 | 6 | 66 | 88,062 | 667 |
| 2 adults at least one 65+, no children | 6 | 4 | 5 | 1 | 5 | 6 | 72 | 202,069 | 1,550 |
| 2 adults both under 65, no children | 6 | 3 | 5 | 2 | 5 | 5 | 73 | 277,289 | 2,145 |
| 2 adults with 1-3 children | 4 | 3 | 4 | 2 | 5 | 3 | 79 | 407,141 | 3,131 |
| 3 or more adults, no children | 6 | 3 | 5 | 2 | 5 | 5 | 75 | 203,280 | 1,604 |
| Other households with children | 3 | 1 | 4 | 2 | 5 | 4 | 80 | 152,760 | 1,194 |
| Construction date | |||||||||
| Before 1960 | 6 | 4 | 6 | 1 | 6 | 7 | 70 | 390,825 | 3,033 |
| 1961-1980 | 6 | 3 | 5 | 1 | 5 | 5 | 74 | 321,930 | 2,468 |
| 1981-2000 | 5 | 3 | 3 | 2 | 5 | 5 | 77 | 421,532 | 3,277 |
| 2001 or later | 6 | 3 | 5 | 3 | 6 | 5 | 73 | 431,296 | 3,313 |
| Unknown construction period | 8 | 5 | 7 | 3 | 5 | 9 | 63 | 122,632 | 941 |
| Nature of occupancy | |||||||||
| Owner-occupied | 5 | 3 | 4 | 2 | 5 | 5 | 76 | 1,252,554 | 9,739 |
| Rented and other | 8 | 4 | 7 | 2 | 6 | 8 | 64 | 435,660 | 3,293 |
| Nationality | |||||||||
| Ireland | 6 | 3 | 5 | 2 | 5 | 6 | 73 | 1,529,619 | 11,835 |
| Other EU | 6 | 3 | 4 | 2 | 5 | 5 | 76 | 126,125 | 952 |
| Other areas | 10 | 4 | 3 | 4 | 4 | 11 | 64 | 32,472 | 245 |
| Household working status | |||||||||
| All adults working full time | 5 | 3 | 4 | 2 | 6 | 5 | 75 | 426,928 | 3,268 |
| One adult working and one adult not working | 5 | 3 | 4 | 2 | 5 | 4 | 77 | 437,591 | 3,403 |
| One adult or more working part time, all other adults (if any) working | 5 | 2 | 4 | 1 | 5 | 4 | 79 | 245,792 | 1,925 |
| All adults not working: Adults aged 65+ and inactive | 8 | 6 | 6 | 1 | 5 | 10 | 64 | 260,487 | 1,953 |
| All adults not working : Other | 8 | 4 | 8 | 2 | 6 | 7 | 65 | 277,029 | 2,172 |
| Not specified | 10 | 5 | 7 | 4 | 6 | 8 | 61 | 40,387 | 311 |
| Table 10: Does your household do any of the following to reduce waste? 1 See footnote | |||||||||
| % of row | |||||||||
| 01. Purchase products with less packaging | 02. Avoid disposable products in favour of reusable | 03. Purchase only what can be consumed by sell-by-date | 04. Control serving/portion sizes for meals | 05. Have a No junk mail sign up | 06. Other method | 07. Don’t do anything specific to reduce waste | Weighted Households | Sampled Households | |
| Total | 35 | 25 | 51 | 25 | 11 | 1 | 29 | 1,688,215 | 13,032 |
| Region | |||||||||
| Border | 42 | 26 | 47 | 19 | 3 | 1 | 34 | 187,428 | 1,409 |
| Dublin | 33 | 26 | 50 | 28 | 25 | 1 | 28 | 472,011 | 3,490 |
| Mid-East | 30 | 26 | 49 | 26 | 9 | 1 | 33 | 186,846 | 1,312 |
| Mid-West | 39 | 30 | 46 | 28 | 7 | 2 | 33 | 138,754 | 985 |
| Midland | 35 | 18 | 48 | 19 | 6 | 1 | 29 | 104,979 | 860 |
| South-East | 22 | 18 | 54 | 24 | 6 | 3 | 33 | 186,280 | 1,615 |
| South-West | 38 | 26 | 51 | 23 | 6 | 1 | 26 | 248,706 | 2,035 |
| Western | 41 | 30 | 62 | 25 | 4 | 1 | 22 | 163,212 | 1,326 |
| Urban/Rural | |||||||||
| Rural areas | 37 | 27 | 55 | 23 | 3 | 2 | 29 | 586,711 | 4,647 |
| Urban areas | 33 | 24 | 49 | 26 | 15 | 1 | 29 | 1,101,504 | 8,385 |
| Dwelling type | |||||||||
| Apartment | 31 | 20 | 43 | 26 | 9 | 1 | 37 | 156,844 | 1,161 |
| Bungalow | 37 | 23 | 51 | 26 | 4 | 2 | 32 | 192,336 | 1,521 |
| Detached house | 39 | 30 | 57 | 25 | 4 | 1 | 26 | 546,005 | 4,313 |
| Semi-detached house | 33 | 25 | 49 | 25 | 16 | 1 | 30 | 485,625 | 3,693 |
| Terraced house and other | 30 | 22 | 47 | 24 | 21 | 1 | 30 | 307,405 | 2,344 |
| Household Composition | |||||||||
| 1 adult aged 65+, living alone | 25 | 17 | 46 | 21 | 13 | 1 | 35 | 164,745 | 1,235 |
| 1 adult aged under 65, living alone | 33 | 24 | 50 | 24 | 11 | 1 | 33 | 192,868 | 1,506 |
| 1 adult with children | 35 | 21 | 44 | 23 | 12 | 0 | 34 | 88,062 | 667 |
| 2 adults at least one 65+, no children | 31 | 22 | 55 | 25 | 11 | 1 | 29 | 202,069 | 1,550 |
| 2 adults both under 65, no children | 37 | 27 | 51 | 25 | 12 | 1 | 29 | 277,289 | 2,145 |
| 2 adults with 1-3 children | 39 | 30 | 52 | 29 | 10 | 1 | 25 | 407,141 | 3,131 |
| 3 or more adults, no children | 34 | 25 | 50 | 21 | 12 | 1 | 30 | 203,280 | 1,604 |
| Other households with children | 37 | 26 | 50 | 25 | 9 | 2 | 29 | 152,760 | 1,194 |
| Construction date | |||||||||
| Before 1960 | 33 | 25 | 51 | 25 | 14 | 1 | 30 | 390,825 | 3,033 |
| 1961-1980 | 33 | 24 | 52 | 24 | 16 | 1 | 28 | 321,930 | 2,468 |
| 1981-2000 | 37 | 28 | 53 | 25 | 10 | 1 | 28 | 421,532 | 3,277 |
| 2001 or later | 37 | 25 | 49 | 25 | 7 | 1 | 30 | 431,296 | 3,313 |
| Unknown construction period | 29 | 20 | 43 | 23 | 6 | 1 | 39 | 122,632 | 941 |
| Nature of occupancy | |||||||||
| Owner-occupied | 36 | 27 | 54 | 25 | 12 | 1 | 27 | 1,252,554 | 9,739 |
| Rented and other | 30 | 20 | 42 | 23 | 10 | 1 | 37 | 435,660 | 3,293 |
| Nationality | |||||||||
| Ireland | 35 | 26 | 52 | 25 | 11 | 1 | 29 | 1,529,619 | 11,835 |
| Other EU | 35 | 25 | 42 | 24 | 7 | 1 | 35 | 126,125 | 952 |
| Other areas | 32 | 20 | 38 | 27 | 9 | 1 | 36 | 32,472 | 245 |
| Household working status | |||||||||
| All adults working full time | 37 | 28 | 52 | 27 | 11 | 1 | 28 | 426,928 | 3,268 |
| One adult working and one adult not working | 36 | 27 | 52 | 24 | 11 | 1 | 28 | 437,591 | 3,403 |
| One adult or more working part time, all other adults (if any) working | 40 | 31 | 54 | 28 | 11 | 1 | 25 | 245,792 | 1,925 |
| All adults not working: Adults aged 65+ and inactive | 27 | 18 | 50 | 23 | 12 | 1 | 32 | 260,487 | 1,953 |
| All adults not working : Other | 31 | 20 | 46 | 22 | 12 | 1 | 35 | 277,029 | 2,172 |
| Not specified | 36 | 24 | 41 | 23 | 8 | 2 | 35 | 40,387 | 311 |
| 1 More than one option allowed | |||||||||
| Table 11: Has a Building Energy Rating (BER) audit ever been conducted for your dwelling? | |||||
| % of row | |||||
| 01. BER has been conducted | 02. BER has not been conducted | 03. Other | Weighted Households | Sampled Households | |
| Total | 15 | 81 | 4 | 1,688,215 | 13,032 |
| Region | |||||
| Border | 13 | 82 | 5 | 187,428 | 1,409 |
| Dublin | 13 | 84 | 3 | 472,011 | 3,490 |
| Mid-East | 14 | 84 | 1 | 186,846 | 1,312 |
| Mid-West | 18 | 79 | 3 | 138,754 | 985 |
| Midland | 12 | 86 | 2 | 104,979 | 860 |
| South-East | 17 | 75 | 8 | 186,280 | 1,615 |
| South-West | 14 | 81 | 5 | 248,706 | 2,035 |
| Western | 19 | 77 | 4 | 163,212 | 1,326 |
| Urban/Rural | |||||
| Rural areas | 15 | 82 | 3 | 586,711 | 4,647 |
| Urban areas | 15 | 81 | 5 | 1,101,504 | 8,385 |
| Dwelling type | |||||
| Apartment | 12 | 78 | 10 | 156,844 | 1,161 |
| Bungalow | 15 | 82 | 2 | 192,336 | 1,521 |
| Detached house | 17 | 80 | 2 | 546,005 | 4,313 |
| Semi-detached house | 15 | 81 | 4 | 485,625 | 3,693 |
| Terraced house and other | 12 | 84 | 4 | 307,405 | 2,344 |
| Household Composition | |||||
| 1 adult aged 65+, living alone | 9 | 88 | 3 | 164,745 | 1,235 |
| 1 adult aged under 65, living alone | 15 | 79 | 6 | 192,868 | 1,506 |
| 1 adult with children | 14 | 78 | 8 | 88,062 | 667 |
| 2 adults at least one 65+, no children | 14 | 85 | 1 | 202,069 | 1,550 |
| 2 adults both under 65, no children | 16 | 79 | 5 | 277,289 | 2,145 |
| 2 adults with 1-3 children | 18 | 78 | 4 | 407,141 | 3,131 |
| 3 or more adults, no children | 12 | 83 | 5 | 203,280 | 1,604 |
| Other households with children | 14 | 83 | 3 | 152,760 | 1,194 |
| Construction date | |||||
| Before 1960 | 10 | 87 | 2 | 390,825 | 3,033 |
| 1961-1980 | 15 | 83 | 2 | 321,930 | 2,468 |
| 1981-2000 | 16 | 80 | 4 | 421,532 | 3,277 |
| 2001 or later | 19 | 76 | 5 | 431,296 | 3,313 |
| Unknown construction period | 7 | 78 | 15 | 122,632 | 941 |
| Nature of occupancy | |||||
| Owner-occupied | 16 | 82 | 2 | 1,252,554 | 9,739 |
| Rented and other | 10 | 78 | 11 | 435,660 | 3,293 |
| Nationality | |||||
| Ireland | 15 | 81 | 3 | 1,529,619 | 11,835 |
| Other EU | 11 | 80 | 10 | 126,125 | 952 |
| Other areas | 10 | 76 | 15 | 32,472 | 245 |
| Household working status | |||||
| All adults working full time | 19 | 76 | 5 | 426,928 | 3,268 |
| One adult working and one adult not working | 14 | 82 | 3 | 437,591 | 3,403 |
| One adult or more working part time, all other adults (if any) working | 15 | 82 | 3 | 245,792 | 1,925 |
| All adults not working: Adults aged 65+ and inactive | 12 | 86 | 2 | 260,487 | 1,953 |
| All adults not working : Other | 11 | 83 | 6 | 277,029 | 2,172 |
| Not specified | 12 | 75 | 13 | 40,387 | 311 |
| Table 12: What is the main fuel or energy source used to heat your home? | ||||||||||||||||
| % of row | ||||||||||||||||
| 01. Natural gas | 02. Diesel / gas oil | 03. Kerosene | 04. LPG | 05. Electricity | 06. Coal / smokeless coal | 07. Peat ( sod (turf) / briquettes) | 08. Wood pellets or wood chips | 09. Wood logs | 10. Heat pump | 11. District heating | 12. Other heating method | 13. None | 14. Not answered | Weighted Households | Sampled Households | |
| Total | 35 | 15 | 25 | 1 | 6 | 7 | 7 | 0 | 2 | 0 | 0 | 0 | 0 | 0 | 1,688,215 | 13,032 |
| Region | ||||||||||||||||
| Border | 11 | 18 | 42 | 1 | 2 | 15 | 7 | 0 | 2 | 0 | . | 0 | . | 0 | 187,428 | 1,409 |
| Dublin | 72 | 6 | 5 | 1 | 13 | 1 | 0 | 0 | 0 | 0 | 1 | 0 | 0 | 1 | 472,011 | 3,490 |
| Mid-East | 44 | 13 | 27 | 1 | 2 | 6 | 3 | 1 | 2 | 0 | . | 0 | 0 | . | 186,846 | 1,312 |
| Mid-West | 21 | 28 | 27 | 1 | 4 | 7 | 7 | 0 | 4 | 0 | . | 1 | 0 | 0 | 138,754 | 985 |
| Midland | 12 | 4 | 38 | 1 | 3 | 4 | 34 | 0 | 2 | 1 | . | 0 | . | 0 | 104,979 | 860 |
| South-East | 14 | 31 | 30 | 1 | 4 | 11 | 0 | 1 | 6 | 1 | . | 0 | 0 | 0 | 186,280 | 1,615 |
| South-West | 29 | 19 | 27 | 1 | 6 | 9 | 2 | 1 | 4 | 0 | . | 1 | 0 | 0 | 248,706 | 2,035 |
| Western | 5 | 11 | 45 | 1 | 3 | 7 | 24 | 1 | 2 | 0 | . | 0 | 0 | . | 163,212 | 1,326 |
| Urban/Rural | ||||||||||||||||
| Rural areas | 1 | 20 | 43 | 1 | 2 | 10 | 15 | 1 | 6 | 1 | . | 0 | 0 | 0 | 586,711 | 4,647 |
| Urban areas | 53 | 12 | 16 | 1 | 9 | 5 | 2 | 0 | 1 | 0 | 0 | 0 | 0 | 1 | 1,101,504 | 8,385 |
| Dwelling type | ||||||||||||||||
| Apartment | 44 | 2 | 2 | 1 | 45 | 1 | 0 | . | 0 | . | 1 | 0 | 0 | 1 | 156,844 | 1,161 |
| Bungalow | 4 | 21 | 40 | 1 | 2 | 10 | 16 | 1 | 4 | 0 | . | 0 | . | 0 | 192,336 | 1,521 |
| Detached house | 13 | 20 | 40 | 1 | 1 | 6 | 11 | 1 | 5 | 1 | . | 1 | 0 | 0 | 546,005 | 4,313 |
| Semi-detached house | 54 | 15 | 18 | 1 | 2 | 6 | 3 | 0 | 1 | . | 0 | 0 | 0 | 0 | 485,625 | 3,693 |
| Terraced house and other | 59 | 9 | 13 | 1 | 5 | 9 | 3 | 0 | 1 | 0 | . | 0 | 0 | 1 | 307,405 | 2,344 |
| Household Composition | ||||||||||||||||
| 1 adult aged 65+, living alone | 25 | 18 | 26 | 1 | 8 | 8 | 9 | 0 | 2 | . | 0 | 0 | 0 | 0 | 164,745 | 1,235 |
| 1 adult aged under 65, living alone | 34 | 13 | 20 | 2 | 13 | 8 | 6 | 0 | 3 | 0 | 0 | 0 | 0 | 1 | 192,868 | 1,506 |
| 1 adult with children | 47 | 12 | 17 | 1 | 7 | 10 | 4 | 0 | 1 | 0 | . | . | 0 | 0 | 88,062 | 667 |
| 2 adults at least one 65+, no children | 24 | 18 | 34 | 1 | 3 | 7 | 9 | 0 | 3 | 0 | 0 | 0 | . | 0 | 202,069 | 1,550 |
| 2 adults both under 65, no children | 37 | 14 | 23 | 1 | 10 | 6 | 5 | 0 | 3 | 0 | 0 | 1 | 0 | 0 | 277,289 | 2,145 |
| 2 adults with 1-3 children | 41 | 14 | 26 | 1 | 4 | 5 | 5 | 1 | 2 | 0 | 0 | 0 | 0 | 0 | 407,141 | 3,131 |
| 3 or more adults, no children | 33 | 17 | 25 | 1 | 6 | 6 | 7 | 0 | 3 | 0 | 0 | 0 | . | 1 | 203,280 | 1,604 |
| Other households with children | 37 | 14 | 26 | 1 | 3 | 7 | 7 | 1 | 2 | 1 | 0 | 0 | . | 0 | 152,760 | 1,194 |
| Construction date | ||||||||||||||||
| Before 1960 | 35 | 13 | 23 | 1 | 6 | 7 | 9 | 0 | 4 | 0 | 0 | 0 | 0 | 0 | 390,825 | 3,033 |
| 1961-1980 | 34 | 18 | 30 | 1 | 3 | 7 | 6 | 0 | 2 | . | . | 0 | 0 | 0 | 321,930 | 2,468 |
| 1981-2000 | 33 | 17 | 27 | 1 | 5 | 8 | 7 | 0 | 2 | 0 | 0 | 0 | . | 0 | 421,532 | 3,277 |
| 2001 or later | 40 | 13 | 24 | 1 | 9 | 5 | 4 | 1 | 2 | 1 | 1 | 1 | 0 | 0 | 431,296 | 3,313 |
| Unknown construction period | 30 | 17 | 19 | 1 | 16 | 8 | 5 | 0 | 2 | 0 | . | . | 0 | 1 | 122,632 | 941 |
| Nature of occupancy | ||||||||||||||||
| Owner-occupied | 33 | 17 | 29 | 1 | 3 | 6 | 8 | 1 | 3 | 0 | 0 | 0 | 0 | 0 | 1,252,554 | 9,739 |
| Rented and other | 42 | 10 | 14 | 1 | 17 | 9 | 3 | 0 | 1 | 0 | 1 | 0 | 0 | 1 | 435,660 | 3,293 |
| Nationality | ||||||||||||||||
| Ireland | 35 | 15 | 26 | 1 | 5 | 7 | 7 | 0 | 2 | 0 | 0 | 0 | 0 | 0 | 1,529,619 | 11,835 |
| Other EU | 39 | 13 | 19 | 1 | 17 | 5 | 2 | 0 | 3 | 0 | 0 | 0 | 0 | 1 | 126,125 | 952 |
| Other areas | 46 | 8 | 9 | 2 | 29 | 2 | 0 | . | 2 | . | 1 | . | . | 2 | 32,472 | 245 |
| Household working status | ||||||||||||||||
| All adults working full time | 41 | 14 | 24 | 1 | 8 | 3 | 4 | 0 | 2 | 1 | 0 | 0 | . | 0 | 426,928 | 3,268 |
| One adult working and one adult not working | 34 | 16 | 27 | 1 | 4 | 7 | 7 | 1 | 3 | 0 | 0 | 0 | 0 | 0 | 437,591 | 3,403 |
| One adult or more working part time, all other adults (if any) working | 38 | 14 | 27 | 1 | 5 | 5 | 7 | 1 | 2 | 0 | 0 | 0 | 0 | 0 | 245,792 | 1,925 |
| All adults not working: Adults aged 65+ and inactive | 25 | 18 | 30 | 1 | 6 | 8 | 9 | 0 | 2 | 0 | 0 | 0 | 0 | 0 | 260,487 | 1,953 |
| All adults not working : Other | 33 | 13 | 20 | 1 | 8 | 13 | 7 | 0 | 2 | 0 | 0 | 0 | 0 | 1 | 277,029 | 2,172 |
| Not specified | 36 | 14 | 15 | 2 | 23 | 4 | 4 | . | 0 | . | 0 | . | . | 2 | 40,387 | 311 |
| Table 13a: Is any additional heating used to heat your home? 1 See footnote | ||||||||||||||
| % of row | ||||||||||||||
| 01. Open fire | 02. Open fire with back boiler | 03. Stove or range | 04. Stove or range with back boiler | 05. Portable room heaters (e.g. Superser) | 06. Decorative effect fires | 07. Electric storage heaters | 08. Plug in electric room heaters | 09. Electric underfloor heating (e.g. in a bathroom or conservatory) | 10. Other type of additional heating | 11. None | 12. Not answered | Weighted Households | Sampled Households | |
| Total | 32 | 6 | 15 | 9 | 2 | 3 | 2 | 8 | 1 | 4 | 27 | 0 | 1,688,215 | 13,032 |
| Region | ||||||||||||||
| Border | 34 | 11 | 14 | 13 | 1 | 2 | 2 | 6 | 0 | 8 | 17 | 0 | 187,428 | 1,409 |
| Dublin | 22 | 2 | 5 | 2 | 2 | 5 | 4 | 10 | 1 | 1 | 52 | 1 | 472,011 | 3,490 |
| Mid-East | 38 | 6 | 16 | 8 | 1 | 1 | 1 | 3 | 0 | 3 | 29 | 0 | 186,846 | 1,312 |
| Mid-West | 32 | 8 | 21 | 14 | 3 | 5 | 2 | 10 | 0 | 3 | 19 | 0 | 138,754 | 985 |
| Midland | 32 | 3 | 20 | 12 | 1 | 1 | 1 | 6 | 0 | 12 | 18 | 0 | 104,979 | 860 |
| South-East | 41 | 9 | 24 | 9 | 2 | 3 | 3 | 5 | 1 | 3 | 14 | 0 | 186,280 | 1,615 |
| South-West | 40 | 9 | 20 | 8 | 1 | 5 | 2 | 9 | 1 | 3 | 16 | 0 | 248,706 | 2,035 |
| Western | 29 | 6 | 23 | 21 | 1 | 2 | 2 | 7 | 0 | 8 | 14 | 0 | 163,212 | 1,326 |
| Urban/Rural | ||||||||||||||
| Rural areas | 33 | 8 | 28 | 19 | 1 | 2 | 2 | 6 | 1 | 7 | 8 | 0 | 586,711 | 4,647 |
| Urban areas | 32 | 5 | 9 | 3 | 2 | 4 | 3 | 8 | 0 | 2 | 38 | 1 | 1,101,504 | 8,385 |
| Dwelling type | ||||||||||||||
| Apartment | 4 | 1 | 1 | 0 | 2 | 2 | 9 | 7 | 1 | 1 | 73 | 1 | 156,844 | 1,161 |
| Bungalow | 32 | 10 | 23 | 17 | 2 | 3 | 2 | 7 | 0 | 9 | 10 | 0 | 192,336 | 1,521 |
| Detached house | 35 | 7 | 27 | 16 | 1 | 3 | 2 | 7 | 1 | 6 | 11 | 0 | 546,005 | 4,313 |
| Semi-detached house | 38 | 5 | 9 | 4 | 2 | 5 | 1 | 8 | 0 | 2 | 33 | 0 | 485,625 | 3,693 |
| Terraced house and other | 32 | 6 | 7 | 4 | 2 | 5 | 2 | 8 | 0 | 3 | 37 | 1 | 307,405 | 2,344 |
| Household Composition | ||||||||||||||
| 1 adult aged 65+, living alone | 27 | 6 | 13 | 9 | 3 | 6 | 5 | 18 | 0 | 4 | 22 | 0 | 164,745 | 1,235 |
| 1 adult aged under 65, living alone | 27 | 6 | 12 | 6 | 1 | 3 | 4 | 8 | 0 | 3 | 37 | 1 | 192,868 | 1,506 |
| 1 adult with children | 37 | 7 | 7 | 4 | 2 | 3 | 2 | 7 | 0 | 3 | 35 | 0 | 88,062 | 667 |
| 2 adults at least one 65+, no children | 31 | 8 | 19 | 14 | 3 | 5 | 3 | 11 | 0 | 4 | 18 | 0 | 202,069 | 1,550 |
| 2 adults both under 65, no children | 30 | 5 | 15 | 9 | 1 | 3 | 3 | 5 | 1 | 4 | 32 | 1 | 277,289 | 2,145 |
| 2 adults with 1-3 children | 37 | 5 | 18 | 8 | 1 | 3 | 1 | 5 | 1 | 4 | 27 | 0 | 407,141 | 3,131 |
| 3 or more adults, no children | 31 | 6 | 16 | 9 | 2 | 4 | 2 | 7 | 0 | 5 | 28 | 1 | 203,280 | 1,604 |
| Other households with children | 36 | 7 | 16 | 11 | 1 | 3 | 2 | 4 | 1 | 5 | 23 | 0 | 152,760 | 1,194 |
| Construction date | ||||||||||||||
| Before 1960 | 31 | 6 | 17 | 11 | 2 | 3 | 3 | 11 | 0 | 4 | 24 | 1 | 390,825 | 3,033 |
| 1961-1980 | 31 | 8 | 15 | 9 | 2 | 5 | 2 | 10 | 0 | 4 | 25 | 1 | 321,930 | 2,468 |
| 1981-2000 | 33 | 7 | 16 | 10 | 1 | 4 | 2 | 6 | 0 | 6 | 24 | 0 | 421,532 | 3,277 |
| 2001 or later | 35 | 3 | 16 | 6 | 1 | 3 | 2 | 4 | 1 | 4 | 32 | 0 | 431,296 | 3,313 |
| Unknown construction period | 25 | 6 | 7 | 6 | 2 | 3 | 4 | 8 | . | 5 | 41 | 1 | 122,632 | 941 |
| Nature of occupancy | ||||||||||||||
| Owner-occupied | 33 | 6 | 19 | 11 | 2 | 4 | 2 | 8 | 1 | 5 | 22 | 0 | 1,252,554 | 9,739 |
| Rented and other | 29 | 6 | 5 | 3 | 1 | 2 | 4 | 8 | 1 | 2 | 43 | 1 | 435,660 | 3,293 |
| Nationality | ||||||||||||||
| Ireland | 33 | 6 | 16 | 9 | 2 | 4 | 2 | 8 | 1 | 4 | 26 | 0 | 1,529,619 | 11,835 |
| Other EU | 27 | 5 | 10 | 5 | 1 | 2 | 4 | 7 | 0 | 2 | 42 | 1 | 126,125 | 952 |
| Other areas | 15 | 1 | 5 | 2 | 1 | 2 | 4 | 6 | 1 | 1 | 62 | 2 | 32,472 | 245 |
| Household working status | ||||||||||||||
| All adults working full time | 33 | 4 | 16 | 7 | 1 | 3 | 2 | 6 | 1 | 4 | 32 | 0 | 426,928 | 3,268 |
| One adult working and one adult not working | 33 | 6 | 17 | 11 | 1 | 4 | 2 | 6 | 1 | 4 | 25 | 0 | 437,591 | 3,403 |
| One adult or more working part time, all other adults (if any) working | 35 | 5 | 19 | 8 | 1 | 3 | 2 | 5 | 0 | 5 | 25 | 0 | 245,792 | 1,925 |
| All adults not working: Adults aged 65+ and inactive | 28 | 6 | 15 | 10 | 3 | 6 | 4 | 15 | 0 | 5 | 21 | 1 | 260,487 | 1,953 |
| All adults not working : Other | 32 | 9 | 10 | 8 | 2 | 2 | 3 | 8 | 0 | 4 | 30 | 1 | 277,029 | 2,172 |
| Not specified | 22 | 4 | 8 | 3 | 1 | 3 | 4 | 6 | 0 | 1 | 50 | 2 | 40,387 | 311 |
| 1 More than one option allowed | ||||||||||||||
| Table 13b: What fuels do you use in the open fire? 1See footnote | |||||||
| % of row | |||||||
| 01. Wood logs | 02. Coal/ smokeless coal | 03. Peat (sod(turf)/ briquettes) | 04. Other fuels | 05. Not Applicable | Weighted Households | Sampled Households | |
| Total | 23 | 28 | 16 | 1 | 62 | 1,688,215 | 13,032 |
| Region | |||||||
| Border | 27 | 37 | 17 | 1 | 55 | 187,428 | 1,409 |
| Dublin | 15 | 16 | 12 | 0 | 76 | 472,011 | 3,490 |
| Mid-East | 28 | 29 | 21 | 1 | 57 | 186,846 | 1,312 |
| Mid-West | 28 | 29 | 17 | 1 | 61 | 138,754 | 985 |
| Midland | 10 | 13 | 23 | 1 | 65 | 104,979 | 860 |
| South-East | 37 | 43 | 12 | 1 | 51 | 186,280 | 1,615 |
| South-West | 32 | 43 | 10 | 1 | 51 | 248,706 | 2,035 |
| Western | 13 | 17 | 25 | 0 | 65 | 163,212 | 1,326 |
| Urban/Rural | |||||||
| Rural areas | 27 | 27 | 18 | 1 | 59 | 586,711 | 4,647 |
| Urban areas | 21 | 28 | 15 | 1 | 64 | 1,101,504 | 8,385 |
| Dwelling type | |||||||
| Apartment | 3 | 3 | 2 | 0 | 95 | 156,844 | 1,161 |
| Bungalow | 26 | 28 | 17 | 1 | 58 | 192,336 | 1,521 |
| Detached house | 28 | 29 | 18 | 1 | 59 | 546,005 | 4,313 |
| Semi-detached house | 24 | 32 | 18 | 1 | 57 | 485,625 | 3,693 |
| Terraced house and other | 21 | 30 | 14 | 1 | 62 | 307,405 | 2,344 |
| Household Composition | |||||||
| 1 adult aged 65+, living alone | 18 | 24 | 15 | 1 | 68 | 164,745 | 1,235 |
| 1 adult aged under 65, living alone | 20 | 24 | 14 | 1 | 67 | 192,868 | 1,506 |
| 1 adult with children | 25 | 36 | 14 | 1 | 57 | 88,062 | 667 |
| 2 adults at least one 65+, no children | 24 | 27 | 16 | 1 | 62 | 202,069 | 1,550 |
| 2 adults both under 65, no children | 22 | 24 | 15 | 0 | 65 | 277,289 | 2,145 |
| 2 adults with 1-3 children | 26 | 30 | 17 | 1 | 59 | 407,141 | 3,131 |
| 3 or more adults, no children | 23 | 28 | 15 | 1 | 63 | 203,280 | 1,604 |
| Other households with children | 26 | 32 | 18 | 1 | 57 | 152,760 | 1,194 |
| Construction date | |||||||
| Before 1960 | 23 | 26 | 16 | 1 | 64 | 390,825 | 3,033 |
| 1961-1980 | 23 | 28 | 16 | 1 | 62 | 321,930 | 2,468 |
| 1981-2000 | 25 | 30 | 17 | 1 | 60 | 421,532 | 3,277 |
| 2001 or later | 22 | 28 | 16 | 1 | 62 | 431,296 | 3,313 |
| Unknown construction period | 18 | 24 | 10 | 0 | 68 | 122,632 | 941 |
| Nature of occupancy | |||||||
| Owner-occupied | 24 | 28 | 17 | 1 | 61 | 1,252,554 | 9,739 |
| Rented and other | 20 | 28 | 13 | 1 | 65 | 435,660 | 3,293 |
| Nationality | |||||||
| Ireland | 24 | 29 | 17 | 1 | 61 | 1,529,619 | 11,835 |
| Other EU | 20 | 21 | 10 | 1 | 69 | 126,125 | 952 |
| Other areas | 10 | 12 | 5 | 2 | 84 | 32,472 | 245 |
| Household working status | |||||||
| All adults working full time | 24 | 26 | 17 | 1 | 63 | 426,928 | 3,268 |
| One adult working and one adult not working | 24 | 29 | 16 | 1 | 61 | 437,591 | 3,403 |
| One adult or more working part time, all other adults (if any) working | 24 | 29 | 17 | 1 | 60 | 245,792 | 1,925 |
| All adults not working: Adults aged 65+ and inactive | 19 | 25 | 15 | 1 | 66 | 260,487 | 1,953 |
| All adults not working : Other | 25 | 32 | 15 | 1 | 60 | 277,029 | 2,172 |
| Not specified | 16 | 17 | 12 | . | 74 | 40,387 | 311 |
| 1 More than one option allowed | |||||||
| Table 13c: What fuels do you use in the stove or range? 1 See footnote | |||||||||||
| % of row | |||||||||||
| 01. Oil | 02. Wood pellets or wood chips | 03. Wood logs | 04. Coal / smokeless coal | 05. Peat ( sod (turf) / briquettes ) | 06. Natural gas | 07. LPG | 08. Other fuels | 09. Not Applicable | Weighted Households | Sampled Households | |
| Total | 2 | 1 | 15 | 12 | 9 | 0 | 0 | 0 | 76 | 1,688,215 | 13,032 |
| Region | |||||||||||
| Border | 2 | 2 | 18 | 16 | 9 | . | . | 0 | 74 | 187,428 | 1,409 |
| Dublin | 0 | 0 | 4 | 2 | 2 | 1 | . | 0 | 94 | 472,011 | 3,490 |
| Mid-East | 2 | 2 | 16 | 10 | 9 | . | . | 0 | 76 | 186,846 | 1,312 |
| Mid-West | 3 | 2 | 23 | 16 | 17 | 0 | 0 | 0 | 67 | 138,754 | 985 |
| Midland | 1 | 1 | 13 | 8 | 22 | . | 0 | 0 | 69 | 104,979 | 860 |
| South-East | 1 | 3 | 25 | 23 | 5 | 0 | . | 0 | 68 | 186,280 | 1,615 |
| South-West | 2 | 2 | 20 | 17 | 7 | 0 | 0 | 0 | 72 | 248,706 | 2,035 |
| Western | 4 | 1 | 19 | 12 | 28 | 0 | 0 | 0 | 57 | 163,212 | 1,326 |
| Urban/Rural | |||||||||||
| Rural areas | 4 | 2 | 29 | 21 | 19 | 0 | 0 | 0 | 55 | 586,711 | 4,647 |
| Urban areas | 1 | 1 | 8 | 6 | 4 | 1 | 0 | 0 | 88 | 1,101,504 | 8,385 |
| Dwelling type | |||||||||||
| Apartment | . | 0 | 0 | 0 | 0 | 0 | . | 0 | 99 | 156,844 | 1,161 |
| Bungalow | 3 | 2 | 23 | 17 | 19 | 0 | 0 | 0 | 61 | 192,336 | 1,521 |
| Detached house | 3 | 3 | 28 | 20 | 16 | 0 | 0 | 0 | 58 | 546,005 | 4,313 |
| Semi-detached house | 0 | 1 | 8 | 7 | 5 | 1 | . | 0 | 87 | 485,625 | 3,693 |
| Terraced house and other | 0 | 1 | 6 | 6 | 4 | 1 | . | 0 | 89 | 307,405 | 2,344 |
| Household Composition | |||||||||||
| 1 adult aged 65+, living alone | 2 | 1 | 13 | 10 | 11 | 0 | 0 | 0 | 78 | 164,745 | 1,235 |
| 1 adult aged under 65, living alone | 1 | 1 | 11 | 7 | 8 | 0 | . | 0 | 83 | 192,868 | 1,506 |
| 1 adult with children | 0 | 1 | 6 | 6 | 5 | 0 | . | 0 | 89 | 88,062 | 667 |
| 2 adults at least one 65+, no children | 3 | 2 | 19 | 14 | 13 | 0 | . | . | 69 | 202,069 | 1,550 |
| 2 adults both under 65, no children | 1 | 1 | 15 | 11 | 9 | 0 | 0 | 0 | 77 | 277,289 | 2,145 |
| 2 adults with 1-3 children | 1 | 2 | 17 | 13 | 9 | 0 | 0 | 0 | 75 | 407,141 | 3,131 |
| 3 or more adults, no children | 1 | 2 | 16 | 13 | 10 | 0 | 0 | 0 | 75 | 203,280 | 1,604 |
| Other households with children | 2 | 1 | 16 | 14 | 9 | 1 | 0 | 0 | 74 | 152,760 | 1,194 |
| Construction date | |||||||||||
| Before 1960 | 2 | 2 | 17 | 12 | 12 | 1 | . | 0 | 73 | 390,825 | 3,033 |
| 1961-1980 | 2 | 1 | 15 | 11 | 10 | 0 | 0 | 0 | 77 | 321,930 | 2,468 |
| 1981-2000 | 2 | 2 | 16 | 13 | 10 | 0 | 0 | 0 | 75 | 421,532 | 3,277 |
| 2001 or later | 1 | 1 | 15 | 12 | 8 | 0 | 0 | 0 | 78 | 431,296 | 3,313 |
| Unknown construction period | 1 | 1 | 7 | 6 | 5 | 0 | . | 0 | 88 | 122,632 | 941 |
| Nature of occupancy | |||||||||||
| Owner-occupied | 2 | 2 | 19 | 14 | 12 | 1 | 0 | 0 | 71 | 1,252,554 | 9,739 |
| Rented and other | 0 | 1 | 5 | 5 | 3 | 0 | . | 0 | 92 | 435,660 | 3,293 |
| Nationality | |||||||||||
| Ireland | 2 | 1 | 16 | 12 | 10 | 0 | 0 | 0 | 75 | 1,529,619 | 11,835 |
| Other EU | 0 | 2 | 10 | 8 | 4 | 0 | 0 | 0 | 85 | 126,125 | 952 |
| Other areas | . | 1 | 6 | 3 | 2 | 0 | . | . | 93 | 32,472 | 245 |
| Household working status | |||||||||||
| All adults working full time | 2 | 2 | 15 | 11 | 9 | 0 | 0 | 0 | 78 | 426,928 | 3,268 |
| One adult working and one adult not working | 2 | 1 | 18 | 14 | 10 | 1 | 0 | 0 | 73 | 437,591 | 3,403 |
| One adult or more working part time, all other adults (if any) working | 2 | 2 | 18 | 13 | 10 | 0 | 0 | 0 | 73 | 245,792 | 1,925 |
| All adults not working: Adults aged 65+ and inactive | 2 | 1 | 14 | 11 | 11 | 0 | 0 | 0 | 75 | 260,487 | 1,953 |
| All adults not working : Other | 1 | 1 | 11 | 9 | 8 | 0 | . | 0 | 82 | 277,029 | 2,172 |
| Not specified | . | 2 | 5 | 6 | 5 | 0 | 0 | . | 89 | 40,387 | 311 |
| 1 More than one option allowed | |||||||||||
| Table 13d: What fuel sources are used in the portable room heater or decorative effect fire? 1 See footnote | ||||||||
| % of row | ||||||||
| 01. Electricity | 02. Oil | 03. Natural gas | 04. LPG | 05. Other fuels | 06. Not applicable | Weighted Households | Sampled Households | |
| Total | 2 | 0 | 2 | 1 | 0 | 95 | 1,688,215 | 13,032 |
| Region | ||||||||
| Border | 0 | 0 | 0 | 0 | 0 | 10 | 187,428 | 1,409 |
| Dublin | 1 | 0 | 1 | 0 | 0 | 25 | 472,011 | 3,490 |
| Mid-East | 0 | 0 | 0 | 0 | 0 | 10 | 186,846 | 1,312 |
| Mid-West | 0 | 0 | 0 | 0 | 0 | 7 | 138,754 | 985 |
| Midland | 0 | 0 | 0 | 0 | 0 | 6 | 104,979 | 860 |
| South-East | 0 | 0 | 0 | 0 | 0 | 12 | 186,280 | 1,615 |
| South-West | 1 | 0 | 0 | 0 | 0 | 15 | 248,706 | 2,035 |
| Western | 0 | 0 | 0 | 0 | 0 | 10 | 163,212 | 1,326 |
| Urban/Rural | ||||||||
| Rural areas | 1 | 0 | 0 | 0 | 0 | 35 | 586,711 | 4,647 |
| Urban areas | 2 | 0 | 2 | 1 | 0 | 60 | 1,101,504 | 8,385 |
| Dwelling type | ||||||||
| Apartment | 0 | 0 | 0 | 0 | 0 | 9 | 156,844 | 1,161 |
| Bungalow | 0 | 0 | 0 | 0 | 0 | 11 | 192,336 | 1,521 |
| Detached house | 1 | 0 | 0 | 0 | 0 | 32 | 546,005 | 4,313 |
| Semi-detached house | 1 | 0 | 1 | 0 | 0 | 27 | 485,625 | 3,693 |
| Terraced house and other | 1 | 0 | 0 | 0 | 0 | 17 | 307,405 | 2,344 |
| Household Composition | ||||||||
| 1 adult aged 65+, living alone | 1 | 0 | 0 | 0 | 0 | 9 | 164,745 | 1,235 |
| 1 adult aged under 65, living alone | 0 | 0 | 0 | 0 | 0 | 11 | 192,868 | 1,506 |
| 1 adult with children | 0 | 0 | 0 | 0 | 0 | 5 | 88,062 | 667 |
| 2 adults at least one 65+, no children | 0 | 0 | 0 | 0 | 0 | 11 | 202,069 | 1,550 |
| 2 adults both under 65, no children | 0 | 0 | 0 | 0 | 0 | 16 | 277,289 | 2,145 |
| 2 adults with 1-3 children | 0 | 0 | 0 | 0 | 0 | 23 | 407,141 | 3,131 |
| 3 or more adults, no children | 0 | 0 | 0 | 0 | 0 | 12 | 203,280 | 1,604 |
| Other households with children | 0 | 0 | 0 | 0 | 0 | 9 | 152,760 | 1,194 |
| Construction date | ||||||||
| Before 1960 | 1 | 0 | 0 | 0 | 0 | 22 | 390,825 | 3,033 |
| 1961-1980 | 1 | 0 | 0 | 0 | 0 | 18 | 321,930 | 2,468 |
| 1981-2000 | 0 | 0 | 1 | 0 | 0 | 24 | 421,532 | 3,277 |
| 2001 or later | 0 | 0 | 0 | 0 | 0 | 25 | 431,296 | 3,313 |
| Unknown construction period | 0 | 0 | 0 | 0 | 0 | 7 | 122,632 | 941 |
| Nature of occupancy | ||||||||
| Owner-occupied | 2 | 0 | 1 | 1 | 0 | 71 | 1,252,554 | 9,739 |
| Rented and other | 0 | 0 | 0 | 0 | 0 | 24 | 435,660 | 3,293 |
| Nationality | ||||||||
| Ireland | 2 | 0 | 1 | 1 | 0 | 86 | 1,529,619 | 11,835 |
| Other EU | 0 | 0 | 0 | 0 | 0 | 7 | 126,125 | 952 |
| Other areas | 0 | 0 | 0 | 0 | 0 | 2 | 32,472 | 245 |
| Household working status | ||||||||
| All adults working full time | 1 | 0 | 1 | 1 | 0 | 97 | 426,928 | 3,268 |
| One adult working and one adult not working | 2 | 0 | 2 | 1 | 0 | 95 | 437,591 | 3,403 |
| One adult or more working part time, all other adults (if any) working | 2 | 0 | 2 | 1 | . | 95 | 245,792 | 1,925 |
| All adults not working: Adults aged 65+ and inactive | 5 | 0 | 2 | 1 | . | 92 | 260,487 | 1,953 |
| All adults not working : Other | 2 | 0 | 1 | 1 | 0 | 96 | 277,029 | 2,172 |
| Not specified | 2 | . | 1 | 1 | . | 96 | 40,387 | 311 |
| 1 More than one option allowed | ||||||||
| Table 14a: What is the main way used to heat the tap water in your home during the summer? | ||||||||||
| % of row | ||||||||||
| 01. Water heated by the central heating system (including combi boilers) | 02. Boiler for tap water only | 03. Immersion heater | 04. Separate instantaneous heater (e.g. electric or gas undersink heater) | 05. Combination of solar panels and central heating | 06. Combination of solar panels and immersion heater | 07. Other method | 08 Not answered | Weighted Households | Sampled Households | |
| Total | 34 | 4 | 52 | 1 | 2 | 1 | 6 | 1 | 1,688,215 | 13,032 |
| Region | ||||||||||
| Border | 32 | 6 | 51 | 1 | 2 | 1 | 7 | 1 | 187,428 | 1,409 |
| Dublin | 44 | 5 | 44 | 1 | 1 | 0 | 4 | 1 | 472,011 | 3,490 |
| Mid-East | 33 | 3 | 55 | 1 | 2 | 1 | 5 | 0 | 186,846 | 1,312 |
| Mid-West | 21 | 5 | 60 | 1 | 2 | 1 | 9 | 1 | 138,754 | 985 |
| Midland | 33 | 4 | 52 | 1 | 1 | 0 | 7 | 1 | 104,979 | 860 |
| South-East | 21 | 3 | 64 | 1 | 2 | 1 | 8 | 0 | 186,280 | 1,615 |
| South-West | 28 | 4 | 53 | 4 | 2 | 1 | 8 | 1 | 248,706 | 2,035 |
| Western | 38 | 3 | 50 | 0 | 3 | 1 | 4 | . | 163,212 | 1,326 |
| Urban/Rural | ||||||||||
| Rural areas | 34 | 3 | 50 | 1 | 3 | 1 | 7 | 0 | 586,711 | 4,647 |
| Urban areas | 34 | 5 | 53 | 2 | 1 | 0 | 5 | 1 | 1,101,504 | 8,385 |
| Dwelling type | ||||||||||
| Apartment | 37 | 5 | 52 | 1 | 0 | 0 | 3 | 2 | 156,844 | 1,161 |
| Bungalow | 33 | 5 | 51 | 1 | 2 | 1 | 7 | 0 | 192,336 | 1,521 |
| Detached house | 31 | 4 | 53 | 1 | 3 | 1 | 6 | 0 | 546,005 | 4,313 |
| Semi-detached house | 33 | 4 | 54 | 1 | 1 | 0 | 6 | 1 | 485,625 | 3,693 |
| Terraced house and other | 38 | 5 | 47 | 2 | 0 | 0 | 7 | 1 | 307,405 | 2,344 |
| Household Composition | ||||||||||
| 1 adult aged 65+, living alone | 33 | 4 | 52 | 1 | 0 | 0 | 8 | 0 | 164,745 | 1,235 |
| 1 adult aged under 65, living alone | 31 | 4 | 52 | 2 | 1 | 0 | 9 | 1 | 192,868 | 1,506 |
| 1 adult with children | 35 | 5 | 51 | 1 | 1 | 0 | 6 | 0 | 88,062 | 667 |
| 2 adults at least one 65+, no children | 32 | 5 | 53 | 2 | 1 | 1 | 5 | 0 | 202,069 | 1,550 |
| 2 adults both under 65, no children | 34 | 5 | 53 | 1 | 2 | 0 | 5 | 1 | 277,289 | 2,145 |
| 2 adults with 1-3 children | 34 | 4 | 52 | 1 | 3 | 1 | 4 | 0 | 407,141 | 3,131 |
| 3 or more adults, no children | 34 | 4 | 52 | 2 | 1 | 1 | 6 | 1 | 203,280 | 1,604 |
| Other households with children | 36 | 3 | 50 | 1 | 2 | 1 | 6 | 0 | 152,760 | 1,194 |
| Construction date | ||||||||||
| Before 1960 | 38 | 5 | 46 | 2 | 1 | 0 | 8 | 1 | 390,825 | 3,033 |
| 1961-1980 | 32 | 4 | 53 | 1 | 1 | 1 | 7 | 1 | 321,930 | 2,468 |
| 1981-2000 | 31 | 4 | 56 | 1 | 2 | 1 | 5 | 0 | 421,532 | 3,277 |
| 2001 or later | 35 | 4 | 51 | 1 | 3 | 1 | 4 | 0 | 431,296 | 3,313 |
| Unknown construction period | 29 | 4 | 56 | 2 | 1 | 0 | 7 | 2 | 122,632 | 941 |
| Nature of occupancy | ||||||||||
| Owner-occupied | 34 | 4 | 52 | 1 | 2 | 1 | 6 | 0 | 1,252,554 | 9,739 |
| Rented and other | 33 | 5 | 53 | 2 | 1 | 0 | 6 | 1 | 435,660 | 3,293 |
| Nationality | ||||||||||
| Ireland | 34 | 4 | 52 | 1 | 2 | 1 | 6 | 0 | 1,529,619 | 11,835 |
| Other EU | 34 | 5 | 52 | 2 | 1 | 1 | 5 | 1 | 126,125 | 952 |
| Other areas | 37 | 7 | 47 | 2 | 0 | . | 4 | 2 | 32,472 | 245 |
| Household working status | ||||||||||
| All adults working full time | 35 | 4 | 52 | 2 | 2 | 1 | 5 | 1 | 426,928 | 3,268 |
| One adult working and one adult not working | 34 | 4 | 52 | 1 | 2 | 1 | 6 | 0 | 437,591 | 3,403 |
| One adult or more working part time, all other adults (if any) working | 33 | 5 | 52 | 1 | 2 | 1 | 5 | 0 | 245,792 | 1,925 |
| All adults not working: Adults aged 65+ and inactive | 33 | 5 | 53 | 1 | 1 | 1 | 7 | 0 | 260,487 | 1,953 |
| All adults not working : Other | 33 | 5 | 51 | 1 | 1 | 0 | 9 | 1 | 277,029 | 2,172 |
| Not specified | 35 | 5 | 53 | 1 | 0 | . | 3 | 2 | 40,387 | 311 |
| Table 14b: What is the main way used to heat the tap water in your home during the winter? | ||||||||||
| % of row | ||||||||||
| 01. Water heated by the central heating system (including combi boilers) | 02. Boiler for tap water only | 03. Immersion heater | 04. Separate instantaneous heater (e.g. electric or gas undersink heater) | 05. Combination of solar panels and central heating | 06. Combination of solar panels and immersion heater | 07. Other method | 08 Not answered | Weighted Households | Sampled Households | |
| Total | 82 | 2 | 10 | 1 | 1 | 0 | 2 | 3 | 1,688,215 | 13,032 |
| Region | ||||||||||
| Border | 88 | 2 | 5 | . | 1 | 0 | 2 | 2 | 187,428 | 1,409 |
| Dublin | 79 | 2 | 13 | 1 | 0 | 0 | 1 | 4 | 472,011 | 3,490 |
| Mid-East | 90 | 1 | 5 | 0 | 1 | . | 1 | 2 | 186,846 | 1,312 |
| Mid-West | 80 | 2 | 11 | 0 | 2 | 0 | 2 | 2 | 138,754 | 985 |
| Midland | 86 | 3 | 5 | 0 | 0 | . | 4 | 2 | 104,979 | 860 |
| South-East | 83 | 2 | 10 | 1 | 0 | 0 | 2 | 1 | 186,280 | 1,615 |
| South-West | 74 | 2 | 14 | 3 | 1 | 0 | 3 | 3 | 248,706 | 2,035 |
| Western | 84 | 2 | 9 | 0 | 2 | 0 | 1 | 2 | 163,212 | 1,326 |
| Urban/Rural | ||||||||||
| Rural areas | 85 | 2 | 7 | 0 | 2 | 0 | 3 | 1 | 586,711 | 4,647 |
| Urban areas | 81 | 2 | 11 | 1 | 0 | 0 | 1 | 4 | 1,101,504 | 8,385 |
| Dwelling type | ||||||||||
| Apartment | 50 | 4 | 33 | 1 | . | . | 2 | 10 | 156,844 | 1,161 |
| Bungalow | 84 | 3 | 7 | 1 | 2 | 0 | 2 | 1 | 192,336 | 1,521 |
| Detached house | 86 | 2 | 6 | 0 | 2 | 0 | 3 | 1 | 546,005 | 4,313 |
| Semi-detached house | 88 | 1 | 7 | 1 | 0 | 0 | 1 | 3 | 485,625 | 3,693 |
| Terraced house and other | 82 | 2 | 11 | 1 | 0 | . | 1 | 3 | 307,405 | 2,344 |
| Household Composition | ||||||||||
| 1 adult aged 65+, living alone | 79 | 2 | 13 | 1 | 0 | . | 3 | 2 | 164,745 | 1,235 |
| 1 adult aged under 65, living alone | 73 | 2 | 15 | 1 | 0 | 0 | 3 | 5 | 192,868 | 1,506 |
| 1 adult with children | 79 | 2 | 13 | 1 | 0 | . | 1 | 4 | 88,062 | 667 |
| 2 adults at least one 65+, no children | 86 | 2 | 8 | 1 | 1 | 0 | 2 | 1 | 202,069 | 1,550 |
| 2 adults both under 65, no children | 79 | 2 | 12 | 1 | 1 | . | 1 | 4 | 277,289 | 2,145 |
| 2 adults with 1-3 children | 86 | 1 | 7 | 1 | 2 | 0 | 1 | 2 | 407,141 | 3,131 |
| 3 or more adults, no children | 82 | 2 | 8 | 1 | 1 | . | 2 | 5 | 203,280 | 1,604 |
| Other households with children | 88 | 1 | 6 | 0 | 1 | 0 | 1 | 2 | 152,760 | 1,194 |
| Construction date | ||||||||||
| Before 1960 | 78 | 2 | 12 | 1 | 0 | 0 | 3 | 3 | 390,825 | 3,033 |
| 1961-1980 | 86 | 2 | 8 | 1 | 1 | 0 | 1 | 2 | 321,930 | 2,468 |
| 1981-2000 | 86 | 2 | 8 | 1 | 1 | 0 | 1 | 2 | 421,532 | 3,277 |
| 2001 or later | 82 | 2 | 10 | 0 | 2 | 0 | 1 | 3 | 431,296 | 3,313 |
| Unknown construction period | 70 | 2 | 16 | 1 | 0 | 0 | 2 | 9 | 122,632 | 941 |
| Nature of occupancy | ||||||||||
| Owner-occupied | 86 | 2 | 7 | 1 | 1 | 0 | 2 | 1 | 1,252,554 | 9,739 |
| Rented and other | 70 | 2 | 18 | 1 | 0 | 0 | 2 | 8 | 435,660 | 3,293 |
| Nationality | ||||||||||
| Ireland | 83 | 2 | 9 | 1 | 1 | 0 | 2 | 2 | 1,529,619 | 11,835 |
| Other EU | 71 | 3 | 15 | 1 | 1 | . | 1 | 7 | 126,125 | 952 |
| Other areas | 61 | 4 | 20 | 1 | 0 | . | 1 | 12 | 32,472 | 245 |
| Household working status | ||||||||||
| All adults working full time | 84 | 2 | 10 | 1 | 1 | 0 | 1 | 1 | 426,928 | 3,268 |
| One adult working and one adult not working | 87 | 1 | 8 | 1 | 1 | 0 | 1 | 0 | 437,591 | 3,403 |
| One adult or more working part time, all other adults (if any) working | 86 | 2 | 8 | 1 | 1 | 0 | 1 | 0 | 245,792 | 1,925 |
| All adults not working: Adults aged 65+ and inactive | 83 | 2 | 11 | 1 | 1 | 0 | 2 | 0 | 260,487 | 1,953 |
| All adults not working : Other | 79 | 3 | 14 | 1 | 1 | 0 | 3 | 1 | 277,029 | 2,172 |
| Not specified | . | . | . | . | . | . | . | 100 | 40,387 | 311 |
| Table 14c: How often is an electric shower used in your home? | ||||||||||
| % of row | ||||||||||
| 01. Do not use/have an electric shower | 02. Used daily | 03. Used four or more times a week | 04. Used at least once a week | 05. Used only in summer | 06. Used only in winter | 07. Used less frequently | 08. Not answered | Weighted Households | Sampled Households | |
| Total | 29 | 49 | 12 | 4 | 2 | 0 | 3 | 1 | 1,688,215 | 13,032 |
| Region | ||||||||||
| Border | 25 | 41 | 20 | 7 | 3 | 0 | 3 | 1 | 187,428 | 1,409 |
| Dublin | 44 | 44 | 7 | 2 | 0 | 0 | 2 | 1 | 472,011 | 3,490 |
| Mid-East | 42 | 44 | 6 | 3 | 3 | . | 2 | 0 | 186,846 | 1,312 |
| Mid-West | 19 | 52 | 18 | 6 | 1 | 0 | 3 | 0 | 138,754 | 985 |
| Midland | 27 | 53 | 6 | 4 | 2 | 0 | 8 | 0 | 104,979 | 860 |
| South-East | 12 | 63 | 15 | 3 | 2 | . | 3 | 0 | 186,280 | 1,615 |
| South-West | 16 | 59 | 15 | 4 | 1 | 0 | 3 | 1 | 248,706 | 2,035 |
| Western | 30 | 40 | 15 | 7 | 3 | 0 | 4 | . | 163,212 | 1,326 |
| Urban/Rural | ||||||||||
| Rural areas | 25 | 45 | 15 | 6 | 3 | 0 | 5 | 0 | 586,711 | 4,647 |
| Urban areas | 32 | 51 | 10 | 3 | 1 | 0 | 2 | 1 | 1,101,504 | 8,385 |
| Dwelling type | ||||||||||
| Apartment | 54 | 35 | 7 | 2 | 0 | . | 1 | 1 | 156,844 | 1,161 |
| Bungalow | 23 | 48 | 15 | 7 | 2 | 0 | 4 | 0 | 192,336 | 1,521 |
| Detached house | 25 | 48 | 13 | 5 | 3 | 0 | 5 | 0 | 546,005 | 4,313 |
| Semi-detached house | 27 | 56 | 10 | 3 | 1 | 0 | 2 | 0 | 485,625 | 3,693 |
| Terraced house and other | 33 | 47 | 13 | 4 | 0 | 0 | 1 | 1 | 307,405 | 2,344 |
| Household Composition | ||||||||||
| 1 adult aged 65+, living alone | 41 | 21 | 22 | 12 | 0 | 0 | 3 | 0 | 164,745 | 1,235 |
| 1 adult aged under 65, living alone | 34 | 41 | 16 | 4 | 1 | 0 | 2 | 1 | 192,868 | 1,506 |
| 1 adult with children | 32 | 50 | 11 | 2 | 1 | . | 2 | 0 | 88,062 | 667 |
| 2 adults at least one 65+, no children | 27 | 37 | 22 | 9 | 2 | 0 | 3 | 0 | 202,069 | 1,550 |
| 2 adults both under 65, no children | 29 | 53 | 10 | 2 | 2 | . | 3 | 0 | 277,289 | 2,145 |
| 2 adults with 1-3 children | 28 | 56 | 7 | 2 | 2 | 0 | 4 | 0 | 407,141 | 3,131 |
| 3 or more adults, no children | 25 | 60 | 9 | 2 | 1 | 0 | 2 | 1 | 203,280 | 1,604 |
| Other households with children | 25 | 63 | 5 | 2 | 1 | . | 4 | 1 | 152,760 | 1,194 |
| Construction date | ||||||||||
| Before 1960 | 33 | 40 | 16 | 6 | 1 | 0 | 3 | 1 | 390,825 | 3,033 |
| 1961-1980 | 26 | 52 | 14 | 5 | 1 | 0 | 2 | 0 | 321,930 | 2,468 |
| 1981-2000 | 25 | 55 | 11 | 3 | 2 | 0 | 4 | 0 | 421,532 | 3,277 |
| 2001 or later | 31 | 50 | 9 | 3 | 2 | 0 | 4 | 0 | 431,296 | 3,313 |
| Unknown construction period | 34 | 48 | 11 | 3 | 1 | . | 2 | 1 | 122,632 | 941 |
| Nature of occupancy | ||||||||||
| Owner-occupied | 27 | 49 | 12 | 5 | 2 | 0 | 4 | 0 | 1,252,554 | 9,739 |
| Rented and other | 35 | 48 | 11 | 3 | 1 | 0 | 2 | 1 | 435,660 | 3,293 |
| Nationality | ||||||||||
| Ireland | 29 | 49 | 12 | 4 | 2 | 0 | 3 | 0 | 1,529,619 | 11,835 |
| Other EU | 34 | 50 | 8 | 2 | 1 | . | 3 | 1 | 126,125 | 952 |
| Other areas | 39 | 48 | 6 | 0 | 0 | . | 4 | 2 | 32,472 | 245 |
| Household working status | ||||||||||
| All adults working full time | 30 | 54 | 7 | 2 | 2 | 0 | 3 | 1 | 426,928 | 3,268 |
| One adult working and one adult not working | 25 | 57 | 10 | 3 | 2 | 0 | 3 | 0 | 437,591 | 3,403 |
| One adult or more working part time, all other adults (if any) working | 27 | 57 | 8 | 2 | 2 | 0 | 4 | 0 | 245,792 | 1,925 |
| All adults not working: Adults aged 65+ and inactive | 34 | 26 | 24 | 11 | 1 | 0 | 3 | 1 | 260,487 | 1,953 |
| All adults not working : Other | 33 | 43 | 16 | 5 | 1 | 0 | 2 | 1 | 277,029 | 2,172 |
| Not specified | 37 | 49 | 8 | 3 | . | . | 1 | 2 | 40,387 | 311 |
| Table 15: What is the main fuel used for cooking? | |||||||||
| % of row | |||||||||
| 01. Electricity | 02. Natural gas | 03. LPG | 04. Combination of electricity and gas (e.g. gas hob and electric oven) | 05. Oil | 06. Other fuel | 07. Not answered | Weighted Households | Sampled Households | |
| Total | 65 | 13 | 7 | 12 | 1 | 1 | 0 | 1,688,215 | 13,032 |
| Region | |||||||||
| Border | 56 | 5 | 15 | 20 | 2 | 2 | 0 | 187,428 | 1,409 |
| Dublin | 65 | 24 | 1 | 10 | 0 | 0 | 1 | 472,011 | 3,490 |
| Mid-East | 60 | 17 | 7 | 14 | 2 | 1 | 0 | 186,846 | 1,312 |
| Mid-West | 70 | 10 | 7 | 10 | 1 | 1 | 0 | 138,754 | 985 |
| Midland | 62 | 3 | 10 | 14 | 2 | 9 | 0 | 104,979 | 860 |
| South-East | 73 | 5 | 9 | 11 | 2 | 1 | 0 | 186,280 | 1,615 |
| South-West | 70 | 12 | 8 | 7 | 2 | 1 | 0 | 248,706 | 2,035 |
| Western | 63 | 5 | 15 | 11 | 2 | 3 | . | 163,212 | 1,326 |
| Urban/Rural | |||||||||
| Rural areas | 59 | 4 | 16 | 15 | 3 | 3 | 0 | 586,711 | 4,647 |
| Urban areas | 68 | 18 | 3 | 10 | 0 | 1 | 1 | 1,101,504 | 8,385 |
| Dwelling type | |||||||||
| Apartment | 82 | 11 | 0 | 5 | . | 0 | 1 | 156,844 | 1,161 |
| Bungalow | 62 | 4 | 14 | 14 | 2 | 4 | 0 | 192,336 | 1,521 |
| Detached house | 60 | 7 | 12 | 16 | 3 | 2 | 0 | 546,005 | 4,313 |
| Semi-detached house | 66 | 18 | 3 | 11 | 0 | 1 | 0 | 485,625 | 3,693 |
| Terraced house and other | 65 | 21 | 5 | 7 | 0 | 1 | 1 | 307,405 | 2,344 |
| Household Composition | |||||||||
| 1 adult aged 65+, living alone | 66 | 12 | 11 | 5 | 2 | 3 | 0 | 164,745 | 1,235 |
| 1 adult aged under 65, living alone | 69 | 11 | 8 | 8 | 0 | 2 | 1 | 192,868 | 1,506 |
| 1 adult with children | 73 | 12 | 5 | 9 | 0 | 0 | 0 | 88,062 | 667 |
| 2 adults at least one 65+, no children | 63 | 12 | 9 | 9 | 3 | 3 | 0 | 202,069 | 1,550 |
| 2 adults both under 65, no children | 69 | 11 | 6 | 11 | 1 | 1 | 0 | 277,289 | 2,145 |
| 2 adults with 1-3 children | 61 | 15 | 5 | 17 | 1 | 0 | 0 | 407,141 | 3,131 |
| 3 or more adults, no children | 66 | 12 | 8 | 10 | 1 | 2 | 1 | 203,280 | 1,604 |
| Other households with children | 60 | 15 | 7 | 15 | 2 | 1 | 0 | 152,760 | 1,194 |
| Construction date | |||||||||
| Before 1960 | 57 | 18 | 11 | 9 | 2 | 3 | 1 | 390,825 | 3,033 |
| 1961-1980 | 69 | 11 | 8 | 8 | 1 | 2 | 0 | 321,930 | 2,468 |
| 1981-2000 | 66 | 11 | 7 | 13 | 2 | 1 | 0 | 421,532 | 3,277 |
| 2001 or later | 65 | 12 | 5 | 16 | 0 | 0 | 0 | 431,296 | 3,313 |
| Unknown construction period | 77 | 9 | 6 | 5 | 1 | 2 | 1 | 122,632 | 941 |
| Nature of occupancy | |||||||||
| Owner-occupied | 61 | 13 | 8 | 14 | 2 | 2 | 0 | 1,252,554 | 9,739 |
| Rented and other | 77 | 12 | 5 | 5 | 0 | 1 | 1 | 435,660 | 3,293 |
| Nationality | |||||||||
| Ireland | 64 | 13 | 8 | 12 | 1 | 2 | 0 | 1,529,619 | 11,835 |
| Other EU | 71 | 13 | 6 | 9 | 0 | 0 | 1 | 126,125 | 952 |
| Other areas | 78 | 13 | 1 | 5 | 0 | 1 | 2 | 32,472 | 245 |
| Household working status | |||||||||
| All adults working full time | 65 | 13 | 6 | 14 | 1 | 1 | 0 | 426,928 | 3,268 |
| One adult working and one adult not working | 64 | 13 | 8 | 12 | 1 | 2 | 0 | 437,591 | 3,403 |
| One adult or more working part time, all other adults (if any) working | 62 | 14 | 7 | 15 | 1 | 1 | 0 | 245,792 | 1,925 |
| All adults not working: Adults aged 65+ and inactive | 67 | 12 | 10 | 7 | 2 | 2 | 0 | 260,487 | 1,953 |
| All adults not working : Other | 67 | 13 | 8 | 9 | 1 | 2 | 0 | 277,029 | 2,172 |
| Not specified | 75 | 14 | 2 | 5 | 0 | 1 | 2 | 40,387 | 311 |
Purpose of survey
The data were collected as a module attached to the CSO Quarterly National Household Survey (QNHS). The principal purpose of the QNHS survey is the production of quarterly labour force estimates and occasional reports on special topics.
Reference Period
The module data was collected during the QNHS in the three months from April to June 2014 (Quarter 2).
Questionnaire
The questionnaire focused on the behaviour of households mainly in relation to waste management and energy use. Questions were also asked regarding the household’s purchasing behaviours and their awareness of environmental initiatives. The CSO formed a module group to develop a questionnaire that would meet a broad range of policy needs. The following organisations were members of the module group:
The data collected will help fill important gaps in our knowledge of energy use and waste disposal. It will be an important input into meeting Ireland’s reporting obligations in the area of household energy use. A copy of the questionnaire is available on the CSO website here (PDF 854KB)
Dataset
The module results are based on responses from 13,032 households. These households were weighted to represent all occupied households in the State.
Sample Design
A two-stage sample design is used. A new sample was introduced in Q4 2012 following the 2011 Census of Population. The sample frame of households is clustered into blocks (small areas) with each block containing a minimum of 60 occupied households on the night of the 2011 Census of Population. The sample frame is stratified using administrative county and population density. In the first stage 1,300 blocks are selected using Probability Proportional to Size (PPS) sampling and in the second stage 20 households are selected using Simple Random Sampling (SRS). This ensures that each household in the sample frame has an equal probability of selection and results in a total quarterly sample of 26,000 households. The actual achieved sample varies over time depending on the level of response.
Households are asked to take part in the survey for five consecutive quarters and are then replaced by other households in the same block. Thus, one fifth of the households in the survey are replaced each quarter and the QNHS sample involves an overlap of 80% between consecutive quarters and 20% between the same quarter in consecutive years. As the new sample based on the 2011 Census of Population was introduced incrementally across each quarter from Q4 2012 to Q4 2013, the new sample is fully effective from Q4 2013.
Householders are not asked to participate in the module in their first quarter participating in the survey. This is primarily to minimise response burden on the householders.
The survey results are weighted to agree with population estimates broken down by age, sex and region and are also calibrated to nationality control totals. The population estimates for April of each year are published in a separate release.
Estimated number of households
The average grossing factor of all members of a household is used to calculate the number of households. As a result, the number of households should be treated as indicative of the total number of households in the country. The QNHS grossing procedure aligns the distribution of persons covered in the survey with independently determined population estimates at the level of sex, five-year age group and region.
Statistical Significance
All estimates based on sample surveys are subject to error, some of which is measurable. Where an estimate is statistically significantly different from another estimate, it means that we can be 95% confident that differences between those two estimates are not due to sampling error.
Reliability of Estimates Presented
Each table in this release contains figures showing the number of respondent households and the number of households in the population.
Individual Reference Person
This module was asked of one reference person aged 18 years and over from each participating household. From respondent households who were requested to participate in the module, one reference person volunteers to respond on behalf of the entire household. Due to the voluntary nature of the household respondent, individual characteristics may not be representative of the population as a whole when compared to a sample survey with a random selection of a respondent.
Rounding in the Detailed Tables
The row or column percentages in the tables in this report may not add to 100% because of rounding.
Classification Variables
Because the Environment module was conducted as part of the QNHS, it is possible to use the data collected in the QNHS as classification variables for analysing the responses in the module. In choosing the classifications presented in the detailed tables, preference was given to household level criteria rather than variables relating to the interviewee.
NUTS3 regions
The regional classification used in this release is based on the NUTS (Nomenclature of Territorial Units) classification used by Eurostat. The NUTS3 regions correspond to the eight Regional Authorities established under the Local Government Act, 1991 (Regional Authorities) (Establishment) Order, 1993, which came into operation on 1 January 1994. The composition of the regions is set out below.
Urban/rural location
From 2014 onwards due to the new sampling methodology, areas are now classified as Urban or Rural based on the following population densities derived from Census of Population 2011:
Urban
Rural
Dwelling Type
The type of dwelling the respondents lived in are categorised in the QNHS as follows:
Apartment
Bungalow
Detached house
Semi-detached house
Terraced house and other
Household Composition
For the purposes of deriving household composition, a child was defined as any member of the household aged 17 or under. Households were analysed as a whole, regardless of the number of family units within the household.
Construction Date
The interviewee was asked for the period that the dwelling was constructed in. The responses were classified to the following categories:
Nature of Occupancy
The interviewee was asked for the nature of occupancy of the dwelling. The responses were classified to the following categories:
Owner occupied
Rented and other
Nationality
The respondent was asked: What is your Nationality?
Other EU consists of the Member States of the EU 28 excluding Ireland.
Other Areas includes the nationals of all countries excluding the EU 28.
Household Working Status
Children and adults were differentiated as follows:
QNHS Social Modules
While the main purpose of the QNHS is the production of quarterly labour force estimates, there is also a provision for the collection of data on social topics through the inclusion of special survey modules. The selection of the major national modules undertaken to-date has been largely based on the results of a canvass of users (over 100 organisations) that was conducted by the CSO in 1996, 2002, 2006, 2008 and 2011. The results of the canvass are presented to the National Statistics Board and they indicate their priorities. The schedule for social modules in any given year is based on the following structure:
Quarter 1 Annual modules update (Disability, Pensions, Childcare, Accidents and Illness), Information, Communication and Technology (ICT) Survey.
Quarter 2 EU module (always covered under EU legislation)
Quarter 3 National module.
Quarter 4 National module.
The table below lists the modules undertaken to-date in the QNHS.
Quarter/Module
Q4 2015 Pensions
Q3 2015 Crime & Victimisation
Q2 2015 Flexible Working Hours
Q1 2015 ICT Accidents & Illnesses
Q4 2014 Annual Travel module
Q3 2014 Equality Module
Q2 2014 Environment module
Q1 2014 Annual modules update
Q4 2013 Annual Travel module
Q3 2013 Volunteering
Q2 2013 Sport and Physical Exercise
Q1 2013 Annual modules update
Q4 2012 Annual Travel module
Q3 2012 Effect of Households of the Economic Downturn
Q2 2012 Retirement Planning
Q2 2012 Parental Involvement in Children’s Education
Q2 2012 Union Membership
Q1 2012 Unemployment Thematic Report
Q2 2011 Response of Households to the Economic Downturn
Q2 2011 Educational Attainment Thematic Report
Q2 2011 Voter Participation
Q4 2010 Equality
Q3 2010 Health
Q2 2010 Cross Border Shopping
Q2 2010 Educational Attainment
Q1 2010 Crime and Victimisation
Q4 2009 Pensions
Q3 2009 Carers
Q2 2009 Union Membership
Q2 2009 Cross-Border Shopping
Q3 2008 Lifelong Learning
Q1 2008 Pension Provision
Q4 2007 Childcare
Q3 2007 Health
Q2 2007 Union Membership
Q1 2007 Work–related Accidents and Illness (Q1 2003-Q1 2007)
Q4 2006 Crime and Victimisation
Q3 2006 Sport and Physical Exercise
Q4 2005 Pension Provision
Q4 2005 Special Saving Incentive Accounts (SSIAs)
Q3 2005 Recycling and Energy Conservation
Q2 2005 Reconciliation Between Work and Family Life
Q2 2005 Educational Attainment
Q1 2005 Childcare
Q4 2004 Equality
Q2 2004 Union Membership
Q2 2004 Work Organisation and working time
Q4 2003 Crime and Victimisation
Q3 2003 Housing
Q2 2003 Life long learning
Further queries
Please contact enviroment@cso.ie with any queries or requests for further analysis.
Participating Households
The Central Statistics Office wishes to thank the participating households for their co-operation in agreeing to take part in the survey.
 Hide Background Notes
Scan the QR code below to view this release online or go to
http://www.cso.ie/en/releasesandpublications/er/q-env/qnhsenvironmentmoduleq22014/
 Show Table 1a: Do you recognise either of these labels?
 Hide Table 1a: Do you recognise either of these labels?