
| Victims of crime 1998 - 2015 | ||
| % | ||
| Household Crime | Personal Crime | |
| 2015 | 8 | 5 |
| 2010 | 9 | 4 |
| 2006 | 11 | 5 |
| 2003 | 12 | 5 |
| 1998 | 12 | 2 |
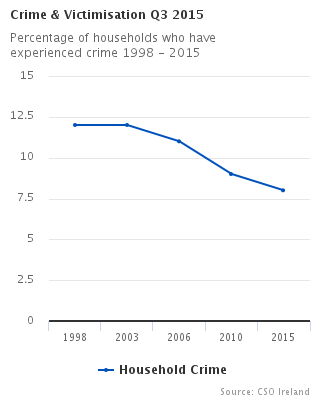
Fall in household crime rates between 2010 and 2015
In the year ending Q3 2015, 8% of households experienced crime. This was a modest reduction on the 2010 figure of 9%. Household crime in the year ending Q3 2015 was at its lowest level since the Crime and Victimisation survey began in 1998 when it was 12%. The percentage of households experiencing vandalism in the year ending Q3 2015 was 2% compared with 3% in 2010 and 5% in 2006. The number of households experiencing a burglary was unchanged at 3%. In 48% of cases there was somebody present in the house when the burglary took place. See tables 1.1 and 1.5.
The level of household crime in Dublin was higher than any other region at 13%, while it was only 3% in the West. Households located in an urban area were two and a half times more likely to become victims of crime compared to households in rural areas (10% versus 4%). Households in the most affluent areas of the country had the highest rate of victimisation at 13% compared to around 7% for other areas. See table 1.2.
Males aged 18-24 more likely to become a victim of crime
There was a slight increase in the level of personal crime experienced by those aged 18 and over. In the year ending Q3 2015, 5% of individuals were affected by crime versus 4% of in the 2010 survey. The percentage of individuals who experienced assault, theft with violence and theft without violence was unchanged from 2010 at 1%, 1% and 2% respectively. Nearly a quarter (22%) of all victims of theft had a smartphone stolen. The incidence of internet fraud was surveyed for the first time in the year ending Q3 2015 when 2% of individuals were victims of this crime. See tables 2.1 and 2.5.
Males in the 18-24 age group were the most likely individuals to experience a crime. In the year ending Q3 2015, 7% of men in this group were victims of crime while the corresponding figure for females in the same age group was 6%. Men and women aged over 65 were least likely to become a victim of crime with only 3% doing so. The rate of victimisation for non-Irish nationals was slightly higher than Irish nationals with rates of 6% and 5% respectively. See table 2.2.
62% of household crime is reported to the Gardaí
More than six in ten (62%) households who suffered crime reported it to the Gardaí. Burglary was the crime which was most likely to be reported at 73% while vandalism was least likely to be reported with only 50% of victims choosing to do so. A total of 41% of respondents cited the fact that a crime was not serious enough or no loss was suffered as the reason they chose not to report a crime. A further 26% of households believed the Gardaí could do nothing about the crime. See tables 1.3 and 1.4.
Over half (54%) of all crimes against individuals were reported to the Gardaí. However there was a wide variety in reporting rates with 70% of victims of non-violent theft reported the crime while only 32% of fraud victims chose to do so. Almost three in ten (28%) of victims of theft did not report the crime as they believed the Gardaí could do nothing. See tables 2.3 and 2.4.
| For long labels below use to display on multiple lines | Reasons for not reporting household crime - all crimes |
|---|---|
| Did not wish to involve Gardai | 4 |
| Not serious enough /no loss | 40.8 |
| Fear of reprisal | 1.2 |
| Solved it myself | 2.7 |
| Believed Gardai would do nothing | 14.6 |
| Believed Gardai could do nothing | 25.8 |
| Did not have time | 0.7 |
| Other reasons | 8.3 |
| No insurance claim | 1.9 |
| For long labels below use to display on multiple lines | Reasons for not reporting personal crime - all crimes |
|---|---|
| Did not wish to involve Gardai | 4 |
| Not serious enough /no loss | 23.2 |
| Fear of reprisal | 2.4 |
| Solved it myself | 13.1 |
| Believed Gardai would do nothing | 6.6 |
| Believed Gardai could do nothing | 19.3 |
| Did not have time | 1.4 |
| Other reasons | 28.3 |
| No insurance claim | 1.6 |
41% of people express confidence in the criminal justice system
Over six in ten people (61%) do not worry about becoming a victim of crime. People in the 18 – 24 age group were least likely to worry about victimisation 24% compared to 48% of those aged over 65. Non-Irish nationals were less likely to worry about becoming a victim with 69% declaring that they did not worry. The comparable figure for Irish nationals is 60%. Only 26% of people said that fear of crime has affected their quality of life. This figure falls to 16% for 18-24 year olds.
An average of 24% of people surveyed felt that crime in their local area was a serious problem. This figure was highest in the Mid-East at 35%. The lowest level of concern was in the West where it was 13%. A total of 41% of people expressed confidence in the criminal justice system. This figure is unchanged from the 2010 figure. There has been an increase in the percentage of people who rate the Gardaí in their area as poor or very poor from 13% in 2010 to 18% in 2015. See tables 3.3 to 3.6.
| For long labels below use to display on multiple lines | Level of confidence of those 18 and over in the criminal justice system |
|---|---|
| Very confident | 4.2 |
| Fairly confident | 36.6 |
| Not very confident | 34.3 |
| Not at all confident | 20 |
| Not stated | 4.9 |
| Table 1.1 Households classified by whether they experienced crime, 2015, 2010, 2006 and 2003 | ||||||
| % | ||||||
| Vandalism | Burglary | Theft of vehicles1 | Theft from vehicles1 | Theft of bicycles1 | Victims of any crime2 | |
| 2015 | 2 | 3 | 1 | 3 | 3 | 8 |
| 2010 | 3 | 3 | 1 | 2 | 1 | 9 |
| 2006 | 5 | 3 | 1 | 3 | 4 | 11 |
| 2003 | 5 | 3 | 1 | 3 | 4 | 12 |
| 1 Percentage is based on households with a motor vehicle or bicycle respectively. | ||||||
| 2 A household could experience more than one crime hence the figure will not necessarily equal the sum of all crimes. This figure is based on all households. | ||||||
| Table 1.2 Households that experienced crime classified by region, location and level of deprivation, 2015 | ||||||||
| % | ||||||||
| Vandalism | Burglary | Theft of vehicles1 | Theft from vehicles1 | Theft of bicycles1 | Victims of any crime2 | Unweighted sample (number of persons) | ||
| All households | 2 | 3 | 1 | 3 | 3 | 8 | 12,969 | |
| Region | ||||||||
| Border | 2 | 3 | <0.5 | 2 | 1 | 6 | 1,520 | |
| Midland | 3 | 5 | <0.5 | 2 | 2 | 9 | 738 | |
| West | 1 | 2 | <0.5 | 1 | 1 | 3 | 1,214 | |
| Dublin | 3 | 4 | 1 | 6 | 7 | 13 | 3,635 | |
| Mid-East | 2 | 3 | 1 | 2 | 2 | 7 | 1,271 | |
| Mid-West | 2 | 2 | <0.5 | 3 | 1 | 7 | 1,010 | |
| South-East | 2 | 3 | <0.5 | 2 | 2 | 6 | 1,609 | |
| South- West | 2 | 3 | <0.5 | 1 | 2 | 6 | 1,972 | |
| Number of persons in household | ||||||||
| 1 person | 3 | 3 | <0.5 | 2 | 4 | 7 | 2,957 | |
| 2 persons | 2 | 3 | <0.5 | 2 | 3 | 7 | 3,854 | |
| 3 or more persons | 2 | 3 | 1 | 3 | 3 | 9 | 6,158 | |
| Urban/rural location | ||||||||
| Urban areas | 3 | 4 | 1 | 4 | 5 | 10 | 8,236 | |
| Rural areas | 1 | 3 | <0.5 | 1 | 1 | 4 | 4,733 | |
| Depreviation/affluence3 | ||||||||
| Very affluent | 2 | 3 | 1 | 5 | 6 | 11 | 2,293 | |
| Affluent | 2 | 3 | <0.5 | 3 | 2 | 7 | 2,772 | |
| Average | 2 | 3 | 1 | 2 | 2 | 7 | 2,537 | |
| Disadvantaged | 2 | 4 | <0.5 | 2 | 2 | 7 | 2,612 | |
| Very disadvantaged | 3 | 3 | 1 | 3 | 3 | 8 | 2,755 | |
| 1 Percentage is based on households with a motor vehicle or bicycle respectively. | ||||||||
| 2 A household could experience more than one crime hence the figure will not necessarily equal the sum of all crimes. | ||||||||
| 3 Levels of deprivation/affluence analysed according to the Pobal HP index, see background notes for further information. | ||||||||
| Table 1.3 All households, who were victims of crime and reported the incident to the Gardaí, 2015, 2010, 2006 and 2003 | ||||
| % | ||||
| Reported to Gardaí | ||||
| Vandalism | Burglary | Theft from cars | Victims of any crime1 | |
| 2015 | 50 | 73 | 60 | 62 |
| 2010 | 55 | 75 | 67 | n/a |
| 2006 | 43 | 70 | 58 | n/a |
| 2003 | 39 | 69 | 60 | n/a |
| 1 Any crime includes vandalism, burglary, theft from cars, theft of cars, theft of bicycles. A person could be the victim of more than one crime hence the figure will not necessarily equal the sum of all crimes. | ||||
| Table 1.4 Households classified by details of why an incident was not reported to the Gardaí, 2015 | ||||
| % | ||||
| Why incident not reported to the Gardaí | Experienced vandalism | Experienced burglary | Experienced theft from car | Victims of any crime1 |
| Believed Gardai could do nothing | 21 | 26 | 20 | 26 |
| Believed Gardai would do nothing | 15 | 16 | 13 | 15 |
| Did not have time | 1 | 0 | 1 | 1 |
| Did not wish to involve Gardai | 3 | 5 | 3 | 4 |
| Fear of reprisal | 1 | 2 | 0 | 1 |
| No insurance claim | 2 | 1 | 4 | 2 |
| Not serious enough/no loss | 46 | 39 | 46 | 41 |
| Other reasons | 6 | 7 | 12 | 8 |
| Solved it myself | 4 | 4 | 1 | 3 |
| Total | 100 | 100 | 100 | 100 |
| 1 Any crime includes vandalism, burglary, theft from cars, theft of cars, theft of bicycles. A person could be the victim of more than one crime hence the figure will not necessarily equal the sum of all crimes. | ||||
| Table 1.5 Burglaries classified by details of the crime, 2015, 2010, 2006 and 2003 | |||
| Somebody at home | Use or threat of weapon1 | Burgled more than once | |
| 2015 | 48 | 4 | 17 |
| 2010 | 49 | 5 | 12 |
| 2006 | 51 | 5 | 15 |
| 2003 | 54 | 6 | 16 |
| 1 Refers to burglaries where there was somebody at home at the time. | |||
| Table 2.1 All persons aged 18 years and over classified by whether they were victims of crime, 2015, 2010, 2006 and 2003 | |||||
| % | |||||
| Violent theft | Non-violent theft | Physical assault | Fraud1 | Victims of any crime2 | |
| 2015 | 1 | 2 | 1 | 2 | 5 |
| 2010 | 1 | 2 | 1 | n/a | 4 |
| 2006 | 1 | 3 | 1 | n/a | 5 |
| 2003 | 1 | 3 | 1 | n/a | 5 |
| 1 Fraud data not available prior to 2015. | |||||
| 2 Total victims of any crime included a dedicated category entitled "victims of mobile phone theft" in 2010. | |||||
| Table 2.2 All persons aged 18 years and over who experienced crime classified by region, sex, age and nationality, 2015 | |||||||
| % | |||||||
| Violent theft | Non-violent theft | Physical assault | Fraud1 | Victims of any crime2 | Unweighted sample3 (number of persons) | ||
| All persons | 1 | 2 | 1 | 2 | 5 | 21,429 | |
| Region | |||||||
| Border | <0.5 | 2 | <0.5 | 2 | 4 | 2,445 | |
| Midland | <0.5 | 3 | <0.5 | 1 | 5 | 1,106 | |
| West | <0.5 | 2 | 1 | 2 | 4 | 2,134 | |
| Dublin | 1 | 3 | 1 | 3 | 7 | 5,981 | |
| Mid-East | <0.5 | 2 | 1 | 3 | 5 | 2,134 | |
| Mid-West | 1 | 2 | 1 | 3 | 5 | 1,599 | |
| South-East | <0.5 | 2 | <0.5 | 2 | 4 | 2,600 | |
| South-West | 1 | 2 | <0.5 | 2 | 4 | 3,430 | |
| Sex | |||||||
| Male | 1 | 3 | 1 | 2 | 5 | 10,054 | |
| Female | <0.5 | 2 | <0.5 | 2 | 5 | 11,375 | |
| Males by age group | |||||||
| 18-24 | 2 | 2 | 2 | 2 | 7 | 944 | |
| 25-44 | 1 | 3 | 1 | 2 | 6 | 3,488 | |
| 45-64 | <0.5 | 3 | 1 | 2 | 5 | 3,551 | |
| 65 + | <0.5 | 1 | <0.5 | 1 | 3 | 2,071 | |
| Females by age group | |||||||
| 18-24 | 1 | 4 | 1 | 2 | 6 | 873 | |
| 25-44 | 1 | 3 | 1 | 3 | 6 | 4,174 | |
| 45-64 | <0.5 | 2 | <0.5 | 3 | 5 | 3,949 | |
| 65 + | <0.5 | 2 | <0.5 | 1 | 3 | 2,379 | |
| All persons by age group | |||||||
| 18-24 | 1 | 3 | 1 | 2 | 6 | 1,817 | |
| 25-44 | 1 | 3 | 1 | 3 | 6 | 7,662 | |
| 45-64 | <0.5 | 3 | <0.5 | 3 | 5 | 7,500 | |
| 65 + | <0.5 | 1 | <0.5 | 1 | 3 | 4,450 | |
| Nationality | |||||||
| Irish nationals | 1 | 2 | 1 | 2 | 5 | 19,510 | |
| Non-Irish nationals | 1 | 3 | 1 | 3 | 6 | 1,919 | |
| 1 Fraud data not available prior to 2015. | |||||||
| 2 A household could experience more than one crime hence the figure will not necessarily equal the sum of all crimes. | |||||||
| 3 See Background Notes. | |||||||
| Table 2.3 All persons aged 18 years and over who were victims of crime and reported the incident to the Gardaí 2015, 2010, 2006 and 2003 | |||||
| % | |||||
| Violent theft | Non-violent theft | Fraud1 | Assault | Victim of any crime2 | |
| 2015 | 58 | 70 | 32 | 58 | 54 |
| 2010 | 64 | 63 | n/a | 55 | 58 |
| 2006 | 61 | 52 | n/a | 53 | 54 |
| 2003 | 59 | 54 | n/a | 51 | 55 |
| 1 Fraud data not available prior to 2015. | |||||
| 2 An individual could experience more than one crime hence the figure will not necessarily equal the sum of all crimes. | |||||
| Table 2.4 All persons aged 18 and over classified by why incident was not reported to the Gardaí, 2015 | |||
| % | |||
| Why incident not reported to the Gardaí | Theft1 | Fraud | Victim of any crime 2 |
| Believed Gardai could do nothing | 28 | 15 | 19 |
| Believed Gardai would do nothing | 13 | 3 | 7 |
| Did not have time | 1 | 1 | 1 |
| Did not wish to involve Gardai | 3 | 3 | 4 |
| Fear of reprisal | 5 | 1 | 2 |
| No insurance claim | 1 | 3 | 2 |
| Not serious enough/no loss | 26 | 21 | 23 |
| Other reasons | 17 | 37 | 28 |
| Solved it myself | 7 | 16 | 13 |
| Total | 100 | 100 | 100 |
| 1 Theft data is combination of violent and non-violent data. | |||
| 2 Any crime includes vandalism, burglary, theft from cars, theft of cars, theft of bicycles. A person could be the victim of more than one crime hence the figure will not necessarily equal the sum of all crimes. | |||
| Table 2.5 All persons aged 18 years and over who were victims of theft1 classified by details of the incident, 2015, 2010, 2006 and 2003 | ||
| % | ||
| Smartphone stolen2 | Suffered more than one theft | |
| 2015 | 23 | 21 |
| 2010 | n/a | 14 |
| 2006 | n/a | 17 |
| 2003 | n/a | 19 |
| 1 Theft data is combination of violent and non-violent data. | ||
| 2Smartphone data not available prior to 2015. | ||
| Table 3.1 All persons aged 18 years and over classified by their perception of crime in their local area, 2015 | ||||||||
| % | ||||||||
| Very serious problem | Serious problem | Fairly serious problem | Not a serious problem | Not a problem | Not stated | Unweighted sample1 (number of persons) | ||
| All persons | 2 | 6 | 16 | 44 | 31 | 1 | 13,486 | |
| Region | ||||||||
| Border | 1 | 4 | 15 | 41 | 38 | 1 | 1,624 | |
| Midland | 3 | 7 | 17 | 44 | 30 | 1 | 817 | |
| West | 1 | 2 | 10 | 34 | 53 | <0.5 | 1,306 | |
| Dublin | 3 | 8 | 19 | 49 | 20 | 1 | 3,694 | |
| Mid-East | 3 | 6 | 26 | 46 | 19 | 1 | 1,269 | |
| Mid-West | 1 | 4 | 15 | 50 | 30 | <0.5 | 1,032 | |
| South-East | 1 | 4 | 13 | 45 | 37 | 1 | 1,693 | |
| South-West | 2 | 5 | 11 | 41 | 41 | 1 | 2,051 | |
| Sex | ||||||||
| Male | 2 | 5 | 15 | 45 | 32 | 1 | 5,511 | |
| Female | 2 | 6 | 17 | 44 | 30 | 1 | 7,975 | |
| Males by age group | ||||||||
| 18-24 | 2 | 5 | 12 | 47 | 33 | 1 | 279 | |
| 25-44 | 2 | 4 | 16 | 46 | 32 | 1 | 1,816 | |
| 45-64 | 2 | 7 | 15 | 45 | 31 | 1 | 2,005 | |
| 65 + | 2 | 6 | 16 | 41 | 34 | 1 | 1,411 | |
| Females by age group | ||||||||
| 18-24 | 3 | 3 | 16 | 46 | 32 | 1 | 287 | |
| 25-44 | 2 | 6 | 18 | 44 | 29 | 1 | 3,000 | |
| 45-64 | 2 | 6 | 18 | 44 | 30 | <0.5 | 2,871 | |
| 65 + | 2 | 6 | 14 | 44 | 33 | 1 | 1,817 | |
| All persons by age group | ||||||||
| 18-24 | 3 | 4 | 14 | 46 | 32 | 1 | 566 | |
| 25-44 | 2 | 5 | 17 | 45 | 31 | 1 | 4,816 | |
| 45-64 | 2 | 6 | 17 | 45 | 30 | 1 | 4,876 | |
| 65 + | 2 | 6 | 15 | 43 | 34 | 1 | 3,228 | |
| Nationality | ||||||||
| Irish nationals | 2 | 6 | 16 | 45 | 31 | 1 | 12,204 | |
| Non-Irish nationals | 2 | 5 | 15 | 43 | 33 | 2 | 1,282 | |
| 1 See Background Notes. | ||||||||
| Table 3.2 All persons aged 18 and over classified by how they are affected by anti-social behaviour, 2015 | |||||||
| % | |||||||
| Very big problem | Fairly big problem | Not a very big problem | Not a problem at all | Not stated | Unweighted sample1 (number of persons) | ||
| All persons | 3 | 9 | 32 | 55 | 1 | 13,486 | |
| Region | |||||||
| Border | 1 | 6 | 29 | 63 | 1 | 1,624 | |
| Midland | 2 | 8 | 34 | 57 | <0.5 | 817 | |
| West | 1 | 5 | 17 | 77 | <0.5 | 1,306 | |
| Dublin | 4 | 14 | 38 | 43 | 1 | 3,694 | |
| Mid-East | 3 | 11 | 37 | 49 | 1 | 1,269 | |
| Mid-West | 1 | 9 | 33 | 57 | <0.5 | 1,032 | |
| South-East | 2 | 7 | 31 | 60 | 1 | 1,693 | |
| South-West | 3 | 8 | 29 | 59 | <0.5 | 2,051 | |
| Sex | |||||||
| Male | 2 | 9 | 32 | 56 | 1 | 5,511 | |
| Female | 3 | 10 | 33 | 54 | 1 | 7,975 | |
| Males by age group | |||||||
| 18-24 | 1 | 10 | 34 | 54 | 1 | 279 | |
| 25-44 | 2 | 9 | 31 | 56 | 1 | 1,816 | |
| 45-64 | 2 | 9 | 33 | 56 | <0.5 | 2,005 | |
| 65 + | 2 | 9 | 30 | 59 | <0.5 | 1,411 | |
| Females by age group | 4 | 12 | 34 | 50 | <0.5 | 287 | |
| 18-24 | 4 | 11 | 32 | 51 | 1 | 3,000 | |
| 25-44 | 3 | 9 | 32 | 56 | <0.5 | 2,871 | |
| 45-64 | 3 | 7 | 32 | 58 | 1 | 1,817 | |
| 65 + | |||||||
| All persons by age group | |||||||
| 18-24 | 3 | 11 | 34 | 52 | 1 | 566 | |
| 25-44 | 3 | 10 | 33 | 54 | 1 | 4,816 | |
| 45-64 | 2 | 9 | 32 | 56 | <0.5 | 4,876 | |
| 65 + | 2 | 8 | 31 | 59 | <0.5 | 3,228 | |
| Nationality | |||||||
| Irish nationals | 3 | 9 | 32 | 56 | 0 | 12,204 | |
| Non-Irish nationals | 3 | 11 | 32 | 52 | 1 | 1,282 | |
| 1 See Background Notes. | |||||||
| Table 3.3 All persons aged 18 years and over classified by whether they worry about becoming a victim of crime, 2015 | |||||||
| % | |||||||
| Yes, personal injury | Yes, property theft and damage | Yes, both personal and property | No | Not stated | Unweighted sample1 (number of persons) | ||
| All persons | 3 | 6 | 30 | 61 | <0.5 | 13,486 | |
| Region | |||||||
| Border | 4 | 5 | 26 | 65 | 1 | 1,624 | |
| Midland | 7 | 6 | 29 | 58 | <0.5 | 817 | |
| West | 2 | 5 | 24 | 69 | <0.5 | 1,306 | |
| Dublin | 3 | 7 | 34 | 56 | <0.5 | 3,694 | |
| Mid-East | 2 | 7 | 33 | 58 | <0.5 | 1,269 | |
| Mid-West | 2 | 7 | 34 | 57 | <0.5 | 1,032 | |
| South-East | 3 | 5 | 24 | 68 | <0.5 | 1,693 | |
| South-West | 3 | 4 | 30 | 62 | <0.5 | 2,051 | |
| Sex | |||||||
| Male | 3 | 6 | 26 | 65 | <0.5 | 5,511 | |
| Female | 4 | 6 | 34 | 56 | <0.5 | 7,975 | |
| Males by Age Group | |||||||
| 18-24 | 3 | 3 | 13 | 80 | 1 | 279 | |
| 25-44 | 2 | 7 | 22 | 69 | <0.5 | 1,816 | |
| 45-64 | 3 | 6 | 29 | 61 | <0.5 | 2,005 | |
| 65 + | 2 | 6 | 36 | 56 | <0.5 | 1,411 | |
| Females by Age Group | |||||||
| 18-24 | 4 | 4 | 20 | 71 | 1 | 287 | |
| 25-44 | 4 | 7 | 32 | 58 | <0.5 | 3,000 | |
| 45-64 | 4 | 5 | 36 | 55 | <0.5 | 2,871 | |
| 65 + | 4 | 6 | 42 | 49 | <0.5 | 1,817 | |
| All persons by age group | |||||||
| 18-24 | 4 | 4 | 16 | 76 | 1 | 566 | |
| 25-44 | 3 | 7 | 27 | 63 | <0.5 | 4,816 | |
| 45-64 | 4 | 6 | 33 | 58 | <0.5 | 4,876 | |
| 65 + | 3 | 6 | 39 | 52 | <0.5 | 3,228 | |
| Nationality | |||||||
| Irish nationals | 3 | 6 | 31 | 60 | <0.5 | 12,204 | |
| Non-Irish nationals | 4 | 5 | 22 | 69 | 1 | 1,282 | |
| 1 See Background Notes. | |||||||
| Table 3.4 All persons aged 18 years and over classified by how much fear of crime has affected their quality of life, 2015 | ||||||||
| % | ||||||||
| Greatly reduced quality | Significantly reduced quality | Moderately reduced quality | Reduced quality a little | No effect on quality | Not stated | Unweighted sample1 (number of persons) | ||
| All persons | 1 | 2 | 7 | 16 | 73 | <0.5 | 13,486 | |
| Region | ||||||||
| Border | 1 | 2 | 6 | 14 | 77 | <0.5 | 1,624 | |
| Midland | 2 | 5 | 8 | 13 | 72 | 0 | 817 | |
| West | 1 | 1 | 7 | 10 | 81 | <0.5 | 1,306 | |
| Dublin | 1 | 2 | 9 | 18 | 69 | <0.5 | 3,694 | |
| Mid-East | 1 | 2 | 6 | 15 | 76 | <0.5 | 1,269 | |
| Mid-West | 1 | 2 | 7 | 20 | 71 | 0 | 1,032 | |
| South-East | 1 | 1 | 5 | 14 | 79 | <0.5 | 1,693 | |
| South-West | 1 | 2 | 7 | 19 | 69 | 1 | 2,051 | |
| Sex | ||||||||
| Male | 1 | 2 | 6 | 14 | 78 | <0.5 | 5,511 | |
| Female | 2 | 2 | 8 | 18 | 69 | <0.5 | 7,975 | |
| Males by age group | ||||||||
| 18-24 | 1 | 1 | 2 | 9 | 88 | 1 | 279 | |
| 25-44 | 1 | 1 | 5 | 13 | 80 | <0.5 | 1,816 | |
| 45-64 | 1 | 2 | 7 | 14 | 77 | <0.5 | 2,005 | |
| 65 + | 2 | 3 | 9 | 19 | 67 | <0.5 | 1,411 | |
| Females by age group | ||||||||
| 18-24 | 1 | 2 | 6 | 11 | 80 | 1 | 287 | |
| 25-44 | 1 | 1 | 7 | 17 | 73 | <0.5 | 3,000 | |
| 45-64 | 1 | 2 | 9 | 19 | 68 | <0.5 | 2,871 | |
| 65 + | 3 | 4 | 11 | 24 | 58 | 1 | 1,817 | |
| All persons by age group | ||||||||
| 18-24 | 1 | 2 | 4 | 10 | 84 | 1 | 566 | |
| 25-44 | 1 | 1 | 6 | 15 | 76 | <0.5 | 4,816 | |
| 45-64 | 1 | 2 | 8 | 17 | 72 | <0.5 | 4,876 | |
| 65 + | 2 | 4 | 11 | 21 | 62 | <0.5 | 3,228 | |
| Nationality | ||||||||
| Irish nationals | 1 | 2 | 7 | 16 | 73 | <0.5 | 12,204 | |
| Non-Irish nationals | 1 | 1 | 6 | 16 | 75 | 1 | 1,282 | |
| 1 See Background Notes. | ||||||||
| Table 3.5 All persons aged 18 years and over classified by their confidence in the criminal justice system, 2015 | |||||||
| % | |||||||
| Very confident | Fairly confident | Not very confident | Not at all confident | Not stated | Unweighted sample1 (number of persons) | ||
| All persons | 4 | 37 | 34 | 20 | 5 | 13,486 | |
| Region | |||||||
| Border | 5 | 31 | 35 | 20 | 10 | 1,624 | |
| Midland | 3 | 31 | 26 | 35 | 5 | 817 | |
| West | 5 | 47 | 26 | 17 | 5 | 1,306 | |
| Dublin | 5 | 38 | 33 | 19 | 4 | 3,694 | |
| Mid-East | 3 | 27 | 39 | 25 | 6 | 1,269 | |
| Mid-West | 4 | 35 | 41 | 18 | 2 | 1,032 | |
| South-East | 4 | 29 | 43 | 20 | 4 | 1,693 | |
| South-West | 4 | 46 | 30 | 16 | 4 | 2,051 | |
| Sex | |||||||
| Male | 4 | 36 | 34 | 21 | 5 | 5,511 | |
| Female | 4 | 37 | 35 | 19 | 5 | 7,975 | |
| Males by age group | |||||||
| 18-24 | 6 | 45 | 26 | 16 | 8 | 279 | |
| 25-44 | 5 | 36 | 34 | 20 | 6 | 1,816 | |
| 45-64 | 3 | 35 | 36 | 22 | 3 | 2,005 | |
| 65 + | 4 | 31 | 37 | 26 | 3 | 1,411 | |
| Females by age group | |||||||
| 18-24 | 7 | 43 | 30 | 13 | 8 | 287 | |
| 25-44 | 4 | 38 | 34 | 18 | 6 | 3,000 | |
| 45-64 | 3 | 36 | 37 | 21 | 4 | 2,871 | |
| 65 + | 5 | 36 | 34 | 19 | 6 | 1,817 | |
| All persons by age group | |||||||
| 18-24 | 6 | 44 | 28 | 14 | 8 | 566 | |
| 25-44 | 5 | 37 | 34 | 19 | 6 | 4,816 | |
| 45-64 | 3 | 36 | 36 | 22 | 4 | 4,876 | |
| 65 + | 4 | 34 | 35 | 22 | 4 | 3,228 | |
| Nationality | |||||||
| Irish nationals | 4 | 36 | 36 | 21 | 4 | 12,204 | |
| Non-Irish nationals | 9 | 44 | 23 | 10 | 15 | 1,282 | |
| 1 See Background Notes. | |||||||
| Table 3.6 All persons aged 18 years and over classified by how they would rate the Gardaí in their local area, 2015 | |||||||
| % | |||||||
| Very good | Good | Poor | Very poor | Not stated | Unweighted sample1 (number of persons) | ||
| All persons | 15 | 60 | 14 | 4 | 7 | 13,486 | |
| Region | |||||||
| Border | 17 | 57 | 13 | 6 | 8 | 1,624 | |
| Midland | 12 | 58 | 15 | 7 | 9 | 817 | |
| West | 17 | 64 | 9 | 3 | 8 | 1,306 | |
| Dublin | 16 | 60 | 15 | 3 | 6 | 3,694 | |
| Mid-East | 14 | 54 | 18 | 6 | 8 | 1,269 | |
| Mid-West | 19 | 59 | 16 | 3 | 4 | 1,032 | |
| South-East | 12 | 63 | 14 | 2 | 9 | 1,693 | |
| South-West | 16 | 63 | 10 | 4 | 8 | 2,051 | |
| Sex | |||||||
| Male | 15 | 60 | 14 | 4 | 7 | 5,511 | |
| Female | 16 | 59 | 13 | 4 | 8 | 7,975 | |
| Males by age group | |||||||
| 18-24 | 13 | 64 | 11 | 5 | 7 | 279 | |
| 25-44 | 15 | 60 | 15 | 4 | 7 | 1,816 | |
| 45-64 | 15 | 61 | 14 | 4 | 7 | 2,005 | |
| 65 + | 16 | 60 | 13 | 5 | 6 | 1,411 | |
| Females by age group | |||||||
| 18-24 | 13 | 61 | 14 | 4 | 7 | 287 | |
| 25-44 | 14 | 60 | 13 | 4 | 8 | 3,000 | |
| 45-64 | 17 | 58 | 14 | 4 | 7 | 2,871 | |
| 65 + | 20 | 59 | 11 | 3 | 8 | 1,817 | |
| All persons by age group | |||||||
| 18-24 | 13 | 62 | 13 | 5 | 7 | 566 | |
| 25-44 | 14 | 60 | 14 | 4 | 8 | 4,816 | |
| 45-64 | 16 | 60 | 14 | 4 | 7 | 4,876 | |
| 65 + | 18 | 59 | 12 | 4 | 7 | 3,228 | |
| Nationality | |||||||
| Irish nationals | 15 | 60 | 14 | 4 | 7 | 12,204 | |
| Non-Irish nationals | 15 | 61 | 10 | 2 | 12 | 1,282 | |
| 1 See Background Notes. | |||||||
Reference Period
The Crime and Victimisation module was included in the Quarterly National Household Survey (QNHS) in the three months interviewing period from October to December 2015. The module was previously carried out in the periods January to March 2010, and September to November in 2003 and 2006. Respondents were asked about experiences in the previous 12 months.
Questionnaire: The module contained 77 questions on crime-related topics, divided into two main sections - household and individual questions:
| Household | Individual |
| - burglary | - theft with violence |
| - theft of and from vehicles | - theft without violence |
| - vandalism | - physical assault |
| - theft of bicycles | - fraud |
| - perceptions and opinions in relation to crime, safety and the Gardaí |
The module also included questions on the seriousness of crimes, on whether crimes were reported to the Gardaí and reasons why they weren’t reported. In cases where the household or person had been a victim of a particular kind of crime more than once in the past year these questions related to the last incident. The survey did not ask about sexual assaults or domestic violence, as these questions were considered too sensitive and personal for inclusion in a general household survey such as the QNHS.
Where an individual was not available for interview, in most circumstances information was provided by another member of the household via a proxy interview. A proxy interview refers to data which is collected from another member of the household due to the unavailability of the specific respondent at the time of the interview. Responses by proxy were not included in the compilation of results of opinion questions (Tables 3.1 -3.6).
A copy of the questionnaire used in this module is available here: Crime and Victimisation Q3 2015 (PDF 330KB)
Definitions of crimes
Burglary: Breaking and entering by a person into a premises (either a house/apartment or an outbuilding). Thefts from gardens are not included nor thefts by a person who has the permission/right to be in the premises.
Vandalism: Damage done to any type of property or vehicle belonging to any member of the household, for example graffiti on house, shed or garden walls, damage to vehicles.
Theft with violence: Stealing or attempting to steal something from a person by using force or threatening to use violence. This includes incidents such as mugging or attempted mugging and is sometimes referred to as robbery.
Theft without violence: Stealing or attempting to steal something from a person without involving force. Examples of this type of incident are pick-pocketing or a jacket being stolen.
Physical assault: Physical assault of a person, excluding attacks of a sexual nature and domestic violence.
Theft of a mobile: This included bank card fraud, internet fraud, embezzlement, credit card fraud or goods purchased and not delivered.
Double-counting of incidents was avoided as much as possible. For example, if a person was attacked during a burglary then this incident would have been only recorded as burglary and not also as an assault.
Survey weighting
The QNHS grossing procedure aligns the distribution of persons covered in the sample with independently determined population estimates at the level of sex, five-year age group and region. The grossing factors applied in the processing of the Crime and Victimisation module were calculated in the same manner but differ from those that were used in the preparation of the main QNHS estimates as the Crime and Victimisation questions were asked to a sub-sample of the overall QNHS sample. Grossing factors used in the compilation of results of opinion questions (Tables 3.1 – 3.6) were calculated excluding proxy respondents.
Urban/rural location
From 2014 onwards due to the new sampling methodology in the QNHS, areas are now classified as Urban or Rural based on the following populaton densities derived from Census of Population 2011:
Urban
Population density > 100,000
Population density 50,000 - 99,999
Population density 20,000 - 49,999
Population density 10,000 - 19,999
Population density 5,000 - 9,999
Population density 1,000 - 4,999
Rural
Population density < 199 - 999
Rural areas in countries
Analysis by deprivation
The Pobal Haase-Pratschke Deprivation Index is used to analyse levels of crime and victimisation experienced by households. The Index uses Census data to measure levels of disadvantage or affluence in a particular geographical area. More detailed information on the index can be found here: https://www.pobal.ie/Pages/New-Measures.aspx .
The results are presented by quintiles, five equal-sized groups of households, with the first quintile representing the least deprived/most affluent area and the fifth quintile representing the most disadvantaged areas.
Regions
The regional classifications in this release are based on the NUTS (Nomenclature of Territorial Units) classification used by Eurostat. The NUTS3 regions correspond to the eight Regional Authorities established under the Local Government Act, 1991 (Regional Authorities) (Establishment) Order, 1993, which came into operation on 1 January 1994. The NUTS2 regions, which were proposed by Government and agreed by Eurostat in 1999, are groupings of the NUTS3 regions. The composition of the regions is set out below.
| Border, Midland and Western NUTS2 Region | Southern and Eastern NUTS2 Region | ||
| Border | Cavan | Dublin | Dublin City |
| Donegal | Dun Laoghaire-Rathdown | ||
| Leitrim | Fingal | ||
| Louth | South Dublin | ||
| Monaghan | Mid-East | Kildare | |
| Sligo | Meath | ||
| Midland | Laois | Wicklow | |
| Longford | Mid-West | Clare | |
| Offaly | Limerick City | ||
| Westmeath | Limerick County | ||
| West | Galway City | North Tipperary | |
| Galway County | South-East | Carlow | |
| Mayo | Kilkenny | ||
| Roscommon | South Tipperary | ||
| Waterford City | |||
| Waterford County | |||
| Wexford | |||
| South-West | Cork City | ||
| Cork County | |||
| Kerry |
|||
Presentation of results
The results of this module are being presented, in general, in the form of percentages. While the reference period of the survey does not correspond to an exact calendar year, the results are presented as referring to the year in which most of the reference period belongs. Therefore, the results are given as referring to 1998, 2003, 2006, 2010 and 2015. The unweighted sample totals are provided as well as percentages in some tables.
Comparison with other crime statistics
The survey results are not directly comparable with administrative crime statistics such as the “Recorded Crime” release which is based on Garda administrative sources. There are fundamental differences in sources, definitions and classification methodology. The administrative sources provide a much more detailed breakdown of offences reported or known to the Gardaí, offences prosecuted and offences committed by juvenile offenders. The CSO survey results provide a more aggregated view of the level of crime, including unreported incidents, together with details of the demographic characteristics of victims.
| Recorded Crime Offences | ||||||||
|---|---|---|---|---|---|---|---|---|
| ICCS | 2009 | 2010 | 2011 | 2012 | 2013 | 2014 | 2015 | |
| 034 | Assault causing harm, poisoning per 100,000 population | 83.7 | 83.0 | 78.3 | 70.5 | 67.3 | 68.5 | 75.0 |
| 0613 | Robbery from the person per 100,000 population | 29.4 | 43.5 | 37.1 | 35.2 | 36.7 | 35.9 | 31.9 |
| 0712 | Burglary (not aggravated) per 100,000 population | 593.9 | 557.2 | 591.5 | 597.2 | 556.0 | 585.5 | 553.5 |
| 0821 | Theft from person per 100,000 population | 60.3 | 64.2 | 80.5 | 109.8 | 141.9 | 118.6 | 116.6 |
| CSO Population estimate (thousands) | 4,459 | 4,471 | 4,575 | 4,585 | 4,593 | 4,610 | 4,635 | |
Acknowledgements
The questions asked in the 2015 module on crime and victimisation were designed with the assistance of an advisory committee comprising representatives of the following organisations: An Garda Síochána, Department of Justice and Equality, Economic and Social Research Institute, COSC and other researchers.
 Hide Background Notes
Scan the QR code below to view this release online or go to
http://www.cso.ie/en/releasesandpublications/er/q-cv/qnhscrimeandvictimisationq32015/
 Show Table 1.1 Households classified by whether they experienced crime, 2015, 2010, 2006 and 2003
 Hide Table 1.1 Households classified by whether they experienced crime, 2015, 2010, 2006 and 2003