
| GDP and GNP (seasonally adjusted) at constant (2012) prices | ||
| Q3 2014 | Q3 2014 | |
| Amount €m | Quarterly % change | |
| GDP | 45,446 | 0.1 |
| GNP | 38,100 | 0.5 |
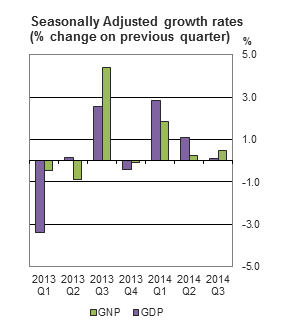
Preliminary estimates for the third quarter of 2014 indicate that GDP remained practically unchanged in volume terms on a seasonally adjusted basis compared with the second quarter of 2014 while GNP increased by 0.5 per cent over the same period.
Value added changes in business sectors
On the output side of the accounts (Table 4), Other Services increased by 1.7 per cent and Building and construction increased by 3 per cent in volume terms between Q2 2014 and Q3 2014. Distribution, transport, software and communication decreased by 0.2 per cent and Industry (excluding Building and Construction) decreased by 0.8 per cent in volume terms on a seasonally adjusted basis over the same period. Public administration and defence also decreased by 5.6 per cent in this period.
Capital Investment and Net Exports increase
On the expenditure side of the accounts (Table 6), Capital Investment decreased by 0.8 per cent in volume terms on a seasonally adjusted basis between Q2 2014 and Q3 2014 and Net exports made a small negative contribution of €55m. Government expenditure decreased by 0.9 per cent quarter on quarter while Personal expenditure was unchanged.
|
Note that the Nace Rev. 2 classification system is now being used in tables 1 and 4. This replaces the national classification used in previous releases. See the notes at the back for further details. The calculation methods for quarterly accounts are similar to those used in the annual National Income and Expenditure. As some of the available sources are of lesser reliability than those used for the annual national accounts, the quarterly estimates are subject to a greater margin of error than the annual figures. These preliminary estimates will therefore be revised when the next detailed annual results are published. |
Comparisons with Q3 2013
On the output side of the accounts gross value added in Agriculture, forestry and fishing decreased by 1.6 percent while Distribution, transport, software and communication increased by 6.4 per cent in Q3 2014 compared with the same quarter of 2013. Industry (including Building and construction) increased by 2 per cent over this period, while Other services increased by 3.7 per cent in Q3 2014.
On the expenditure side, Capital investment rose by 7.8 per cent. Government expenditure decreased by 1.4 per cent while Personal expenditure remained unchanged compared to Q3 2013. Net exports were €1,536m higher in the third quarter of 2014 compared with the corresponding quarter of 2013.
Factor income outflows were €636m higher in Q3 2014 compared with Q3 2013 resulting in the 3.5 per cent increase in GDP becoming a 2.5 per cent increase in GNP over the same period.
| Table 1 Gross Domestic Product by Sector of Origin and Gross National Product at Constant Market Prices (Chain linked annually and referenced to year 2012)* | ||||||||||||
| (Note the sectors here are based on Nace rev 2. For further details see the methodology notes at the back) | €million | |||||||||||
| Period | Agric. Forestry and fishing | Industry | of which Building and construction | Dist. Transport software and comms. | Public admin. and defence | Other services (including rent) | GDP at constant factor cost | Taxes less subsidies | GDP at constant market cost | Net factor income from rest of world | GNP at constant market prices | |
| 2008 | 4,323 | 46,858 | 6,345 | 43,379 | 7,859 | 64,429 | 160,649 | 20,197 | 180,593 | -27,968 | 152,149 | |
| 2009 | 4,067 | 41,845 | 4,613 | 40,773 | 7,435 | 63,030 | 153,286 | 15,852 | 169,088 | -30,394 | 138,784 | |
| 2010 | 3,977 | 42,285 | 3,402 | 40,692 | 6,985 | 63,377 | 153,138 | 15,512 | 168,622 | -27,759 | 140,781 | |
| 2011 | 3,954 | 43,328 | 2,916 | 40,535 | 6,632 | 64,007 | 158,259 | 15,051 | 173,297 | -33,662 | 139,717 | |
| 2012 | 3,798 | 42,306 | 2,740 | 40,958 | 6,462 | 65,709 | 157,506 | 15,249 | 172,755 | -31,526 | 141,229 | |
| 2013 | 4,008 | 41,706 | 3,065 | 38,839 | 6,319 | 67,274 | 156,831 | 16,223 | 173,055 | -27,125 | 145,929 | |
| 2008 | ||||||||||||
| Q1 | 1,174 | 12,515 | 1,690 | 13,931 | 1,871 | 15,904 | 41,881 | 6,098 | 47,847 | -6,869 | 40,774 | |
| Q2 | 1,494 | 12,545 | 1,574 | 9,567 | 1,983 | 15,935 | 40,631 | 4,245 | 44,882 | -7,218 | 37,584 | |
| Q3 | 990 | 11,482 | 1,616 | 9,881 | 2,015 | 16,341 | 39,404 | 5,808 | 45,079 | -7,881 | 37,209 | |
| Q4 | 666 | 10,317 | 1,464 | 9,999 | 1,990 | 16,249 | 38,732 | 4,047 | 42,785 | -6,000 | 36,582 | |
| 2009 | ||||||||||||
| Q1 | 1,113 | 11,551 | 1,265 | 10,078 | 1,817 | 15,633 | 38,825 | 4,258 | 43,054 | -7,551 | 35,502 | |
| Q2 | 1,475 | 11,396 | 1,146 | 10,043 | 1,856 | 15,619 | 39,412 | 3,216 | 42,676 | -8,038 | 34,707 | |
| Q3 | 846 | 9,647 | 1,140 | 10,499 | 1,873 | 15,902 | 37,499 | 4,749 | 42,168 | -8,100 | 34,157 | |
| Q4 | 633 | 9,251 | 1,062 | 10,153 | 1,889 | 15,877 | 37,551 | 3,629 | 41,189 | -6,705 | 34,417 | |
| 2010 | ||||||||||||
| Q1 | 932 | 11,346 | 829 | 9,923 | 1,717 | 15,565 | 38,110 | 4,078 | 42,170 | -8,005 | 34,215 | |
| Q2 | 1,256 | 10,984 | 840 | 9,872 | 1,750 | 15,734 | 38,854 | 3,068 | 41,948 | -7,826 | 34,163 | |
| Q3 | 1,011 | 9,884 | 892 | 10,564 | 1,762 | 15,890 | 38,138 | 4,788 | 42,884 | -6,960 | 35,897 | |
| Q4 | 779 | 10,071 | 842 | 10,333 | 1,756 | 16,188 | 38,036 | 3,578 | 41,620 | -4,967 | 36,505 | |
| 2011 | ||||||||||||
| Q1 | 904 | 11,135 | 755 | 10,025 | 1,607 | 15,367 | 38,036 | 4,164 | 42,187 | -8,211 | 33,996 | |
| Q2 | 1,265 | 11,351 | 726 | 10,067 | 1,654 | 16,056 | 40,786 | 2,899 | 43,700 | -8,786 | 34,944 | |
| Q3 | 1,013 | 10,356 | 734 | 10,110 | 1,669 | 16,188 | 39,499 | 4,410 | 43,894 | -8,551 | 35,364 | |
| Q4 | 772 | 10,486 | 700 | 10,333 | 1,701 | 16,396 | 39,938 | 3,578 | 43,517 | -8,114 | 35,412 | |
| 2012 | ||||||||||||
| Q1 | 948 | 11,373 | 630 | 9,895 | 1,550 | 15,964 | 38,448 | 4,128 | 42,567 | -8,796 | 33,812 | |
| Q2 | 1,293 | 11,906 | 656 | 9,499 | 1,604 | 16,100 | 39,577 | 2,985 | 42,583 | -7,895 | 34,693 | |
| Q3 | 888 | 9,775 | 710 | 10,738 | 1,628 | 16,698 | 38,950 | 4,679 | 43,607 | -7,804 | 35,797 | |
| Q4 | 669 | 9,253 | 744 | 10,826 | 1,680 | 16,947 | 40,531 | 3,456 | 43,998 | -7,031 | 36,927 | |
| 2013 | ||||||||||||
| Q1 | 937 | 11,224 | 668 | 9,054 | 1,526 | 16,423 | 38,341 | 4,338 | 42,679 | -6,946 | 35,733 | |
| Q2 | 1,255 | 11,147 | 723 | 9,290 | 1,574 | 16,400 | 39,253 | 3,231 | 42,484 | -7,864 | 34,620 | |
| Q3 | 1,005 | 10,083 | 834 | 10,181 | 1,592 | 16,998 | 39,509 | 4,891 | 44,400 | -6,816 | 37,585 | |
| Q4 | 810 | 9,251 | 840 | 10,314 | 1,627 | 17,453 | 39,729 | 3,763 | 43,491 | -5,500 | 37,991 | |
| 2014 | ||||||||||||
| Q1 | 972 | 10,666 | 733 | 10,020 | 1,582 | 17,056 | 39,578 | 4,813 | 44,391 | -7,486 | 36,905 | |
| Q2 | 1,411 | 11,868 | 792 | 10,355 | 1,633 | 16,842 | 41,817 | 3,771 | 45,587 | -8,021 | 37,567 | |
| Q3 | 989 | 10,281 | 895 | 10,832 | 1,572 | 17,622 | 40,868 | 5,103 | 45,972 | -7,452 | 38,520 | |
| Percentage change on corresponding period of previous year | ||||||||||||
| 2008 | -2.4 | -6.3 | -5.8 | -2.6 | 6.6 | 1.3 | -1.3 | -12.9 | -2.6 | -2.3 | ||
| 2009 | -5.9 | -10.7 | -27.3 | -6.0 | -5.4 | -2.2 | -4.6 | -21.5 | -6.4 | -8.8 | ||
| 2010 | -2.2 | 1.1 | -26.2 | -0.2 | -6.0 | 0.6 | -0.1 | -2.1 | -0.3 | 1.4 | ||
| 2011 | -0.6 | 2.5 | -14.3 | -0.4 | -5.1 | 1.0 | 3.3 | -3.0 | 2.8 | -0.8 | ||
| 2012 | -3.9 | -2.4 | -6.0 | 1.0 | -2.6 | 2.7 | -0.5 | 1.3 | -0.3 | 1.1 | ||
| 2013 | 5.5 | -1.4 | 11.9 | -5.2 | -2.2 | 2.4 | -0.4 | 6.4 | 0.2 | 3.3 | ||
| 2008 | ||||||||||||
| Q1 | -3.4 | -3.4 | -2.2 | 24.4 | 7.2 | 2.4 | 3.5 | -9.0 | 1.8 | 3.7 | ||
| Q2 | -7.3 | 0.5 | -2.0 | -14.2 | 7.8 | 2.5 | -1.1 | -15.0 | -2.5 | -1.4 | ||
| Q3 | 8.9 | -4.2 | -4.5 | -8.6 | 6.0 | 1.4 | 0.7 | -8.7 | -0.5 | -3.6 | ||
| Q4 | -4.3 | -17.9 | -14.2 | -12.3 | 5.6 | -0.8 | -7.8 | -21.4 | -9.2 | -7.7 | ||
| 2009 | ||||||||||||
| Q1 | -5.2 | -7.7 | -25.2 | -27.7 | -2.9 | -1.7 | -7.3 | -30.2 | -10.0 | -12.9 | ||
| Q2 | -1.3 | -9.2 | -27.2 | 5.0 | -6.4 | -2.0 | -3.0 | -24.2 | -4.9 | -7.7 | ||
| Q3 | -14.6 | -16.0 | -29.5 | 6.2 | -7.0 | -2.7 | -4.8 | -18.2 | -6.5 | -8.2 | ||
| Q4 | -4.9 | -10.3 | -27.5 | 1.5 | -5.1 | -2.3 | -3.1 | -10.3 | -3.7 | -5.9 | ||
| 2010 | ||||||||||||
| Q1 | -16.3 | -1.8 | -34.5 | -1.5 | -5.5 | -0.4 | -1.8 | -4.2 | -2.1 | -3.6 | ||
| Q2 | -14.8 | -3.6 | -26.7 | -1.7 | -5.8 | 0.7 | -1.4 | -4.6 | -1.7 | -1.6 | ||
| Q3 | 19.5 | 2.5 | -21.8 | 0.6 | -5.9 | -0.1 | 1.7 | 0.8 | 1.7 | 5.1 | ||
| Q4 | 23.0 | 8.9 | -20.7 | 1.8 | -7.0 | 2.0 | 1.3 | -1.4 | 1.0 | 6.1 | ||
| 2011 | ||||||||||||
| Q1 | -3.0 | -1.9 | -8.9 | 1.0 | -6.4 | -1.3 | -0.2 | 2.1 | 0.0 | -0.6 | ||
| Q2 | 0.7 | 3.3 | -13.5 | 2.0 | -5.4 | 2.0 | 5.0 | -5.5 | 4.2 | 2.3 | ||
| Q3 | 0.2 | 4.8 | -17.6 | -4.3 | -5.3 | 1.9 | 3.6 | -7.9 | 2.4 | -1.5 | ||
| Q4 | -0.8 | 4.1 | -16.8 | -0.0 | -3.2 | 1.3 | 5.0 | 0.0 | 4.6 | -3.0 | ||
| 2012 | ||||||||||||
| Q1 | 4.9 | 2.1 | -16.6 | -1.3 | -3.6 | 3.9 | 1.1 | -0.9 | 0.9 | -0.5 | ||
| Q2 | 2.2 | 4.9 | -9.6 | -5.6 | -3.1 | 0.3 | -3.0 | 3.0 | -2.6 | -0.7 | ||
| Q3 | -12.3 | -5.6 | -3.3 | 6.2 | -2.5 | 3.1 | -1.4 | 6.1 | -0.7 | 1.2 | ||
| Q4 | -13.3 | -11.8 | 6.2 | 4.8 | -1.2 | 3.4 | 1.5 | -3.4 | 1.1 | 4.3 | ||
| 2013 | ||||||||||||
| Q1 | -1.1 | -1.3 | 6.1 | -8.5 | -1.6 | 2.9 | -0.3 | 5.1 | 0.3 | 5.7 | ||
| Q2 | -3.0 | -6.4 | 10.1 | -2.2 | -1.9 | 1.9 | -0.8 | 8.2 | -0.2 | -0.2 | ||
| Q3 | 13.3 | 3.2 | 17.4 | -5.2 | -2.2 | 1.8 | 1.4 | 4.5 | 1.8 | 5.0 | ||
| Q4 | 21.1 | -0.0 | 13.0 | -4.7 | -3.2 | 3.0 | -2.0 | 8.9 | -1.2 | 2.9 | ||
| 2014 | ||||||||||||
| Q1 | 3.7 | -5.0 | 9.6 | 10.7 | 3.7 | 3.9 | 3.2 | 10.9 | 4.0 | 3.3 | ||
| Q2 | 12.4 | 6.5 | 9.5 | 11.5 | 3.7 | 2.7 | 6.5 | 16.7 | 7.3 | 8.5 | ||
| Q3 | -1.6 | 2.0 | 7.3 | 6.4 | -1.3 | 3.7 | 3.4 | 4.3 | 3.5 | 2.5 | ||
| *Chain linked series not additive | ||||||||||||
| Table 2 Expenditure on Gross National Product at Current Market Prices | |||||||||||
| €million | |||||||||||
| Period | Personal consumption of goods and services | Net exp. by central and local government on current goods and services | Gross domestic fixed capital formation | Value of physical changes in stocks | Exports of goods and services | Imports of goods and services | Statistical discrepancy | GDP at current market prices | Net factor income from the rest of the world | GNP at current market prices | |
| 2008 | 94,712 | 30,775 | 45,221 | -330 | 150,180 | -133,876 | 189 | 186,870 | -25,837 | 161,033 | |
| 2009 | 83,565 | 29,650 | 33,082 | -1,490 | 146,363 | -121,555 | -1,501 | 168,114 | -28,517 | 139,597 | |
| 2010 | 82,447 | 26,437 | 26,106 | -569 | 157,811 | -129,023 | 1,719 | 164,928 | -26,425 | 138,503 | |
| 2011 | 82,969 | 26,111 | 24,841 | 780 | 167,086 | -132,398 | 1,654 | 171,042 | -32,127 | 138,915 | |
| 2012 | 82,467 | 25,922 | 26,923 | 288 | 182,506 | -147,079 | 1,728 | 172,755 | -31,526 | 141,229 | |
| 2013 | 83,334 | 25,956 | 26,541 | 837 | 184,056 | -147,694 | 1,761 | 174,791 | -27,286 | 147,506 | |
| 2008 | |||||||||||
| Q1 | 23,806 | 7,549 | 13,930 | -390 | 36,630 | -33,687 | 48 | 47,886 | -6,283 | 41,603 | |
| Q2 | 23,107 | 7,628 | 10,835 | 529 | 37,773 | -33,332 | 47 | 46,588 | -6,563 | 40,025 | |
| Q3 | 23,254 | 7,635 | 11,093 | -27 | 37,016 | -32,457 | 47 | 46,562 | -7,295 | 39,267 | |
| Q4 | 24,544 | 7,961 | 9,363 | -442 | 38,762 | -34,400 | 46 | 45,835 | -5,696 | 40,139 | |
| 2009 | |||||||||||
| Q1 | 21,044 | 7,780 | 9,295 | -568 | 36,511 | -30,821 | -383 | 42,859 | -7,164 | 35,695 | |
| Q2 | 20,429 | 7,208 | 8,449 | 14 | 37,697 | -30,618 | -382 | 42,797 | -7,589 | 35,208 | |
| Q3 | 20,213 | 7,206 | 7,082 | -430 | 35,783 | -28,083 | -370 | 41,402 | -7,562 | 33,840 | |
| Q4 | 21,879 | 7,455 | 8,256 | -505 | 36,373 | -32,034 | -367 | 41,056 | -6,202 | 34,854 | |
| 2010 | |||||||||||
| Q1 | 20,219 | 6,697 | 6,884 | -527 | 37,011 | -29,638 | 428 | 41,074 | -7,567 | 33,507 | |
| Q2 | 20,136 | 6,486 | 6,829 | -106 | 40,218 | -32,280 | 435 | 41,717 | -7,517 | 34,200 | |
| Q3 | 20,314 | 6,430 | 5,787 | 353 | 40,491 | -31,815 | 438 | 41,997 | -6,649 | 35,348 | |
| Q4 | 21,778 | 6,825 | 6,607 | -288 | 40,090 | -35,290 | 418 | 40,140 | -4,692 | 35,448 | |
| 2011 | |||||||||||
| Q1 | 20,393 | 6,513 | 6,665 | -317 | 40,446 | -33,199 | 395 | 40,895 | -7,858 | 33,037 | |
| Q2 | 20,302 | 6,505 | 6,476 | 403 | 42,433 | -33,034 | 421 | 43,504 | -8,320 | 35,184 | |
| Q3 | 20,075 | 6,560 | 5,404 | 599 | 41,653 | -31,463 | 418 | 43,246 | -8,100 | 35,146 | |
| Q4 | 22,199 | 6,534 | 6,296 | 95 | 42,555 | -34,701 | 420 | 43,398 | -7,849 | 35,549 | |
| 2012 | |||||||||||
| Q1 | 19,895 | 6,602 | 6,776 | -577 | 44,488 | -36,284 | 413 | 41,312 | -8,686 | 32,626 | |
| Q2 | 19,906 | 6,430 | 5,684 | 549 | 46,599 | -37,475 | 421 | 42,113 | -7,882 | 34,231 | |
| Q3 | 20,345 | 6,511 | 5,690 | 290 | 45,712 | -35,567 | 434 | 43,414 | -7,880 | 35,534 | |
| Q4 | 22,322 | 6,380 | 8,773 | 27 | 45,708 | -37,753 | 459 | 45,916 | -7,078 | 38,838 | |
| 2013 | |||||||||||
| Q1 | 20,089 | 6,431 | 6,610 | 409 | 43,687 | -35,367 | 426 | 42,285 | -6,716 | 35,569 | |
| Q2 | 20,037 | 6,459 | 5,830 | 240 | 47,498 | -37,436 | 434 | 43,061 | -8,035 | 35,026 | |
| Q3 | 20,623 | 6,475 | 6,235 | 798 | 45,882 | -35,779 | 450 | 44,684 | -6,939 | 37,745 | |
| Q4 | 22,586 | 6,591 | 7,866 | -610 | 46,988 | -39,111 | 451 | 44,761 | -5,596 | 39,165 | |
| 2014 | |||||||||||
| Q1 | 20,557 | 6,365 | 7,135 | 493 | 46,669 | -37,689 | 443 | 43,974 | -7,194 | 36,780 | |
| Q2 | 20,630 | 6,396 | 7,109 | 85 | 53,122 | -41,949 | 462 | 45,855 | -7,726 | 38,129 | |
| Q3 | 20,949 | 6,480 | 6,834 | 533 | 53,069 | -41,550 | 471 | 46,787 | -7,237 | 39,550 | |
| Percentage change on corresponding period of previous year | |||||||||||
| 2008 | 1.7 | 5.2 | -16.8 | -1.5 | -0.8 | -5.0 | -5.0 | ||||
| 2009 | -11.8 | -3.7 | -26.8 | -2.5 | -9.2 | -10.0 | -13.3 | ||||
| 2010 | -1.3 | -10.8 | -21.1 | 7.8 | 6.1 | -1.9 | -0.8 | ||||
| 2011 | 0.6 | -1.2 | -4.8 | 5.9 | 2.6 | 3.7 | 0.3 | ||||
| 2012 | -0.6 | -0.7 | 8.4 | 9.2 | 11.1 | 1.0 | 1.7 | ||||
| 2013 | 1.1 | 0.1 | -1.4 | 0.8 | 0.4 | 1.2 | 4.4 | ||||
| 2008 | |||||||||||
| Q1 | 6.4 | 6.3 | -11.4 | -0.7 | 2.5 | -3.6 | -1.7 | ||||
| Q2 | 1.9 | 6.4 | -18.6 | -1.9 | 1.0 | -5.8 | -4.8 | ||||
| Q3 | 1.1 | 3.6 | -9.1 | -1.6 | -1.4 | -1.2 | -4.3 | ||||
| Q4 | -2.1 | 4.5 | -28.5 | -1.7 | -5.0 | -9.2 | -8.9 | ||||
| 2009 | |||||||||||
| Q1 | -11.6 | 3.1 | -33.3 | -0.3 | -8.5 | -10.5 | -14.2 | ||||
| Q2 | -11.6 | -5.5 | -22.0 | -0.2 | -8.1 | -8.1 | -12.0 | ||||
| Q3 | -13.1 | -5.6 | -36.2 | -3.3 | -13.5 | -11.1 | -13.8 | ||||
| Q4 | -10.9 | -6.4 | -11.8 | -6.2 | -6.9 | -10.4 | -13.2 | ||||
| 2010 | |||||||||||
| Q1 | -3.9 | -13.9 | -25.9 | 1.4 | -3.8 | -4.2 | -6.1 | ||||
| Q2 | -1.4 | -10.0 | -19.2 | 6.7 | 5.4 | -2.5 | -2.9 | ||||
| Q3 | 0.5 | -10.8 | -18.3 | 13.2 | 13.3 | 1.4 | 4.5 | ||||
| Q4 | -0.5 | -8.5 | -20.0 | 10.2 | 10.2 | -2.2 | 1.7 | ||||
| 2011 | |||||||||||
| Q1 | 0.9 | -2.7 | -3.2 | 9.3 | 12.0 | -0.4 | -1.4 | ||||
| Q2 | 0.8 | 0.3 | -5.2 | 5.5 | 2.3 | 4.3 | 2.9 | ||||
| Q3 | -1.2 | 2.0 | -6.6 | 2.9 | -1.1 | 3.0 | -0.6 | ||||
| Q4 | 1.9 | -4.3 | -4.7 | 6.1 | -1.7 | 8.1 | 0.3 | ||||
| 2012 | |||||||||||
| Q1 | -2.4 | 1.4 | 1.7 | 10.0 | 9.3 | 1.0 | -1.2 | ||||
| Q2 | -1.9 | -1.2 | -12.2 | 9.8 | 13.4 | -3.2 | -2.7 | ||||
| Q3 | 1.3 | -0.7 | 5.3 | 9.7 | 13.0 | 0.4 | 1.1 | ||||
| Q4 | 0.6 | -2.3 | 39.3 | 7.4 | 8.8 | 5.8 | 9.3 | ||||
| 2013 | |||||||||||
| Q1 | 1.0 | -2.6 | -2.5 | -1.8 | -2.5 | 2.4 | 9.0 | ||||
| Q2 | 0.7 | 0.5 | 2.6 | 1.9 | -0.1 | 2.3 | 2.3 | ||||
| Q3 | 1.4 | -0.5 | 9.6 | 0.4 | 0.6 | 2.9 | 6.2 | ||||
| Q4 | 1.2 | 3.3 | -10.3 | 2.8 | 3.6 | -2.5 | 0.8 | ||||
| 2014 | |||||||||||
| Q1 | 2.3 | -1.0 | 7.9 | 6.8 | 6.6 | 4.0 | 3.4 | ||||
| Q2 | 3.0 | -1.0 | 21.9 | 11.8 | 12.1 | 6.5 | 8.9 | ||||
| Q3 | 1.6 | 0.1 | 9.6 | 15.7 | 16.1 | 4.7 | 4.8 | ||||
| Table 3 Expenditure on Gross National Product at Constant Market Prices (Chain linked annually and referenced to year 2012)* | ||||||||||
| €million | ||||||||||
| Period | Personal consumption of goods and services | Net exp. by central and local government on current goods and services | Gross domestic fixed capital formation | Value of physical changes in stocks | Exports of goods and services | Imports of goods and services | GDP at constant market prices | Net factor income from the rest of the world | GNP at constant market prices | |
| 2008 | 88,404 | 30,215 | 40,535 | -328 | 162,128 | -147,917 | 180,593 | -27,968 | 152,149 | |
| 2009 | 83,646 | 29,151 | 32,225 | -1,471 | 155,661 | -134,360 | 169,088 | -30,394 | 138,784 | |
| 2010 | 84,413 | 27,069 | 26,418 | -577 | 165,266 | -138,414 | 168,622 | -27,759 | 140,781 | |
| 2011 | 83,434 | 26,490 | 25,650 | 782 | 174,329 | -137,572 | 173,297 | -33,662 | 139,717 | |
| 2012 | 82,467 | 25,922 | 26,923 | 288 | 182,506 | -147,079 | 172,755 | -31,526 | 141,229 | |
| 2013 | 81,797 | 26,273 | 26,275 | 861 | 184,565 | -148,031 | 173,055 | -27,125 | 145,929 | |
| 2008 | ||||||||||
| Q1 | 22,359 | 7,477 | 12,248 | -596 | 39,961 | -37,574 | 47,847 | -6,869 | 40,774 | |
| Q2 | 21,548 | 7,485 | 9,699 | 818 | 41,443 | -36,998 | 44,882 | -7,218 | 37,584 | |
| Q3 | 21,711 | 7,449 | 10,037 | 80 | 39,939 | -35,814 | 45,079 | -7,881 | 37,209 | |
| Q4 | 22,786 | 7,803 | 8,551 | -630 | 40,785 | -37,531 | 42,785 | -6,000 | 36,582 | |
| 2009 | ||||||||||
| Q1 | 20,771 | 7,467 | 8,833 | -571 | 38,284 | -33,438 | 43,054 | -7,551 | 35,502 | |
| Q2 | 20,452 | 7,339 | 8,113 | 80 | 39,795 | -33,712 | 42,676 | -8,038 | 34,707 | |
| Q3 | 20,430 | 7,026 | 7,084 | -486 | 38,276 | -31,306 | 42,168 | -8,100 | 34,157 | |
| Q4 | 21,993 | 7,319 | 8,195 | -494 | 39,305 | -35,904 | 41,189 | -6,705 | 34,417 | |
| 2010 | ||||||||||
| Q1 | 20,789 | 6,801 | 6,887 | -553 | 38,957 | -32,170 | 42,170 | -8,005 | 34,215 | |
| Q2 | 20,670 | 6,848 | 6,909 | -67 | 41,708 | -34,663 | 41,948 | -7,826 | 34,163 | |
| Q3 | 20,847 | 6,580 | 5,995 | 348 | 42,202 | -33,961 | 42,884 | -6,960 | 35,897 | |
| Q4 | 22,107 | 6,839 | 6,626 | -305 | 42,399 | -37,619 | 41,620 | -4,967 | 36,505 | |
| 2011 | ||||||||||
| Q1 | 20,699 | 6,762 | 6,875 | -366 | 41,963 | -34,620 | 42,187 | -8,211 | 33,996 | |
| Q2 | 20,491 | 6,680 | 6,657 | 358 | 44,635 | -34,575 | 43,700 | -8,786 | 34,944 | |
| Q3 | 20,228 | 6,511 | 5,557 | 632 | 43,768 | -32,724 | 43,894 | -8,551 | 35,364 | |
| Q4 | 22,016 | 6,537 | 6,561 | 158 | 43,963 | -35,654 | 43,517 | -8,114 | 35,412 | |
| 2012 | ||||||||||
| Q1 | 20,034 | 6,602 | 6,955 | -612 | 44,923 | -36,605 | 42,567 | -8,796 | 33,813 | |
| Q2 | 19,986 | 6,430 | 5,656 | 537 | 46,693 | -37,557 | 42,583 | -7,895 | 34,693 | |
| Q3 | 20,412 | 6,511 | 5,601 | 289 | 45,290 | -35,270 | 43,607 | -7,804 | 35,797 | |
| Q4 | 22,035 | 6,380 | 8,712 | 73 | 45,600 | -37,648 | 43,998 | -7,031 | 36,927 | |
| 2013 | ||||||||||
| Q1 | 19,873 | 6,447 | 6,673 | 499 | 43,912 | -35,549 | 42,679 | -6,946 | 35,733 | |
| Q2 | 19,745 | 6,297 | 5,764 | 287 | 47,384 | -37,405 | 42,484 | -7,864 | 34,620 | |
| Q3 | 20,269 | 6,699 | 6,115 | 787 | 45,952 | -35,774 | 44,400 | -6,816 | 37,585 | |
| Q4 | 21,910 | 6,830 | 7,723 | -713 | 47,318 | -39,303 | 43,491 | -5,500 | 37,991 | |
| 2014 | ||||||||||
| Q1 | 20,003 | 6,636 | 7,050 | 514 | 47,103 | -37,634 | 44,391 | -7,486 | 36,905 | |
| Q2 | 19,982 | 6,667 | 6,871 | 74 | 53,569 | -41,866 | 45,587 | -8,021 | 37,567 | |
| Q3 | 20,278 | 6,608 | 6,592 | 351 | 53,084 | -41,370 | 45,972 | -7,452 | 38,520 | |
| Percentage change on corresponding period of previous year | ||||||||||
| 2008 | 0.0 | 0.6 | -9.6 | -0.9 | -2.6 | -2.6 | -2.3 | |||
| 2009 | -5.4 | -3.5 | -20.5 | -4.0 | -9.2 | -6.4 | -8.8 | |||
| 2010 | 0.9 | -7.1 | -18.0 | 6.2 | 3.0 | -0.3 | 1.4 | |||
| 2011 | -1.2 | -2.1 | -2.9 | 5.5 | -0.6 | 2.8 | -0.8 | |||
| 2012 | -1.2 | -2.1 | 5.0 | 4.7 | 6.9 | -0.3 | 1.1 | |||
| 2013 | -0.8 | 1.4 | -2.4 | 1.1 | 0.6 | 0.2 | 3.3 | |||
| 2008 | ||||||||||
| Q1 | 3.6 | 1.5 | -4.7 | 1.2 | 0.8 | 1.8 | 3.7 | |||
| Q2 | -0.2 | 2.2 | -10.6 | 0.8 | -0.3 | -2.5 | -1.4 | |||
| Q3 | -0.3 | -1.2 | -1.2 | -0.7 | -2.8 | -0.5 | -3.6 | |||
| Q4 | -2.7 | -0.2 | -22.2 | -4.6 | -7.5 | -9.2 | -7.7 | |||
| 2009 | ||||||||||
| Q1 | -7.1 | -0.1 | -27.9 | -4.2 | -11.0 | -10.0 | -12.9 | |||
| Q2 | -5.1 | -1.9 | -16.4 | -4.0 | -8.9 | -4.9 | -7.7 | |||
| Q3 | -5.9 | -5.7 | -29.4 | -4.2 | -12.6 | -6.5 | -8.2 | |||
| Q4 | -3.5 | -6.2 | -4.2 | -3.6 | -4.3 | -3.7 | -5.9 | |||
| 2010 | ||||||||||
| Q1 | 0.1 | -8.9 | -22.0 | 1.8 | -3.8 | -2.1 | -3.6 | |||
| Q2 | 1.1 | -6.7 | -14.8 | 4.8 | 2.8 | -1.7 | -1.6 | |||
| Q3 | 2.0 | -6.3 | -15.4 | 10.3 | 8.5 | 1.7 | 5.1 | |||
| Q4 | 0.5 | -6.6 | -19.1 | 7.9 | 4.8 | 1.0 | 6.1 | |||
| 2011 | ||||||||||
| Q1 | -0.4 | -0.6 | -0.2 | 7.7 | 7.6 | 0.0 | -0.6 | |||
| Q2 | -0.9 | -2.5 | -3.6 | 7.0 | -0.3 | 4.2 | 2.3 | |||
| Q3 | -3.0 | -1.1 | -7.3 | 3.7 | -3.6 | 2.4 | -1.5 | |||
| Q4 | -0.4 | -4.4 | -1.0 | 3.7 | -5.2 | 4.6 | -3.0 | |||
| 2012 | ||||||||||
| Q1 | -3.2 | -2.4 | 1.2 | 7.1 | 5.7 | 0.9 | -0.5 | |||
| Q2 | -2.5 | -3.8 | -15.0 | 4.6 | 8.6 | -2.6 | -0.7 | |||
| Q3 | 0.9 | -0.0 | 0.8 | 3.5 | 7.8 | -0.7 | 1.2 | |||
| Q4 | 0.1 | -2.4 | 32.8 | 3.7 | 5.6 | 1.1 | 4.3 | |||
| 2013 | ||||||||||
| Q1 | -0.8 | -2.3 | -4.1 | -2.3 | -2.9 | 0.3 | 5.7 | |||
| Q2 | -1.2 | -2.1 | 1.9 | 1.5 | -0.4 | -0.2 | -0.2 | |||
| Q3 | -0.7 | 2.9 | 9.2 | 1.5 | 1.4 | 1.8 | 5.0 | |||
| Q4 | -0.6 | 7.0 | -11.4 | 3.8 | 4.4 | -1.2 | 2.9 | |||
| 2014 | ||||||||||
| Q1 | 0.7 | 2.9 | 5.6 | 7.3 | 5.9 | 4.0 | 3.3 | |||
| Q2 | 1.2 | 5.9 | 19.2 | 13.1 | 11.9 | 7.3 | 8.5 | |||
| Q3 | 0.0 | -1.4 | 7.8 | 15.5 | 15.6 | 3.5 | 2.5 | |||
| *Chain linked series not additive | ||||||||||
| Table 4 Gross Value Added at Constant Factor Cost by Sector of Origin and Gross National Product at Constant Market Prices | ||||||||||||
| (Chain linked annually and referenced to year 2012) - Seasonally Adjusted | ||||||||||||
| €million | ||||||||||||
| Period | Agric. Forestry and fishing | Industry | of which Building and construction | Dist. Transport software and comms | Public admin and defence | Other services (including rent) | GDP at constant factor cost | Taxes less subsidies | GDP at constant market prices | Net factor income from the rest of the world | GNP at constant market prices | |
| 2008 | ||||||||||||
| Q1 | 1,084 | 12,072 | 1,717 | 13,992 | 1,957 | 16,136 | 41,526 | 5,557 | 47,226 | -6,654 | 40,499 | |
| Q2 | 1,073 | 12,057 | 1,646 | 9,756 | 1,985 | 16,140 | 40,342 | 5,198 | 45,281 | -6,771 | 38,393 | |
| Q3 | 1,113 | 12,044 | 1,565 | 9,747 | 1,972 | 16,182 | 39,987 | 5,027 | 45,016 | -7,633 | 37,305 | |
| Q4 | 1,018 | 10,749 | 1,423 | 9,890 | 1,940 | 15,981 | 38,844 | 4,319 | 43,073 | -6,966 | 35,929 | |
| 2009 | ||||||||||||
| Q1 | 1,063 | 11,147 | 1,293 | 10,167 | 1,899 | 15,842 | 38,827 | 3,880 | 42,773 | -7,214 | 35,751 | |
| Q2 | 1,086 | 10,790 | 1,197 | 10,234 | 1,863 | 15,825 | 38,734 | 4,046 | 42,813 | -7,642 | 35,093 | |
| Q3 | 938 | 10,117 | 1,098 | 10,312 | 1,839 | 15,751 | 37,954 | 4,026 | 41,901 | -7,854 | 34,109 | |
| Q4 | 938 | 9,795 | 1,028 | 10,034 | 1,833 | 15,614 | 37,695 | 3,879 | 41,529 | -7,716 | 33,774 | |
| 2010 | ||||||||||||
| Q1 | 913 | 10,802 | 857 | 10,031 | 1,798 | 15,788 | 38,109 | 3,766 | 41,884 | -7,683 | 34,305 | |
| Q2 | 916 | 10,387 | 876 | 10,094 | 1,757 | 15,930 | 38,314 | 3,872 | 42,218 | -7,338 | 34,875 | |
| Q3 | 1,065 | 10,380 | 856 | 10,341 | 1,734 | 15,741 | 38,462 | 4,004 | 42,496 | -6,795 | 35,709 | |
| Q4 | 1,050 | 10,796 | 810 | 10,183 | 1,698 | 15,912 | 38,135 | 3,856 | 41,919 | -5,951 | 35,776 | |
| 2011 | ||||||||||||
| Q1 | 933 | 10,735 | 792 | 10,223 | 1,679 | 15,552 | 38,775 | 3,806 | 42,589 | -7,758 | 34,922 | |
| Q2 | 935 | 10,472 | 755 | 10,270 | 1,667 | 16,307 | 39,692 | 3,720 | 43,449 | -8,390 | 34,992 | |
| Q3 | 1,043 | 10,886 | 702 | 9,869 | 1,647 | 16,042 | 39,766 | 3,653 | 43,392 | -8,439 | 35,078 | |
| Q4 | 1,024 | 11,371 | 670 | 10,153 | 1,639 | 16,092 | 39,895 | 3,894 | 43,793 | -9,086 | 34,651 | |
| 2012 | ||||||||||||
| Q1 | 984 | 10,818 | 669 | 10,095 | 1,623 | 16,182 | 38,914 | 3,803 | 42,710 | -8,429 | 34,236 | |
| Q2 | 984 | 11,043 | 682 | 9,731 | 1,614 | 16,349 | 38,975 | 3,758 | 42,687 | -7,365 | 35,384 | |
| Q3 | 911 | 10,257 | 675 | 10,474 | 1,608 | 16,550 | 39,124 | 3,886 | 43,089 | -7,761 | 35,436 | |
| Q4 | 913 | 10,109 | 708 | 10,603 | 1,616 | 16,606 | 40,452 | 3,803 | 44,216 | -7,963 | 36,109 | |
| 2013 | ||||||||||||
| Q1 | 977 | 10,659 | 717 | 9,251 | 1,600 | 16,659 | 38,635 | 4,015 | 42,713 | -6,630 | 35,939 | |
| Q2 | 946 | 10,314 | 751 | 9,533 | 1,584 | 16,669 | 38,917 | 3,960 | 42,771 | -7,283 | 35,611 | |
| Q3 | 1,034 | 10,555 | 790 | 9,932 | 1,574 | 16,846 | 39,617 | 4,108 | 43,868 | -6,786 | 37,179 | |
| Q4 | 1,047 | 10,181 | 797 | 10,079 | 1,562 | 17,079 | 39,674 | 4,142 | 43,682 | -6,414 | 37,145 | |
| 2014 | ||||||||||||
| Q1 | 1,037 | 10,293 | 793 | 10,298 | 1,656 | 17,271 | 40,344 | 4,423 | 44,912 | -7,096 | 37,835 | |
| Q2 | 1,073 | 10,782 | 821 | 10,587 | 1,647 | 17,168 | 40,998 | 4,569 | 45,410 | -7,524 | 37,921 | |
| Q3 | 1,028 | 10,731 | 845 | 10,563 | 1,554 | 17,462 | 40,964 | 4,348 | 45,446 | -7,420 | 38,100 | |
| Percentage change on previous quarter | ||||||||||||
| 2008 | ||||||||||||
| Q1 | -0.3 | -6.3 | 3.6 | 24.3 | 6.0 | 0.3 | -0.8 | 0.8 | -0.1 | 4.1 | ||
| Q2 | -1.0 | -0.1 | -4.2 | -30.3 | 1.4 | 0.0 | -2.9 | -6.5 | -4.1 | -5.2 | ||
| Q3 | 3.7 | -0.1 | -4.9 | -0.1 | -0.6 | 0.3 | -0.9 | -3.3 | -0.6 | -2.8 | ||
| Q4 | -8.5 | -10.7 | -9.0 | 1.5 | -1.6 | -1.2 | -2.9 | -14.1 | -4.3 | -3.7 | ||
| 2009 | ||||||||||||
| Q1 | 4.4 | 3.7 | -9.1 | 2.8 | -2.1 | -0.9 | -0.0 | -10.2 | -0.7 | -0.5 | ||
| Q2 | 2.1 | -3.2 | -7.4 | 0.7 | -1.9 | -0.1 | -0.2 | 4.3 | 0.1 | -1.8 | ||
| Q3 | -13.6 | -6.2 | -8.3 | 0.8 | -1.3 | -0.5 | -2.0 | -0.5 | -2.1 | -2.8 | ||
| Q4 | -0.0 | -3.2 | -6.4 | -2.7 | -0.3 | -0.9 | -0.7 | -3.7 | -0.9 | -1.0 | ||
| 2010 | ||||||||||||
| Q1 | -2.7 | 10.3 | -16.7 | -0.0 | -1.9 | 1.1 | 1.1 | -2.9 | 0.9 | 1.6 | ||
| Q2 | 0.3 | -3.8 | 2.3 | 0.6 | -2.3 | 0.9 | 0.5 | 2.8 | 0.8 | 1.7 | ||
| Q3 | 16.3 | -0.1 | -2.3 | 2.4 | -1.3 | -1.2 | 0.4 | 3.4 | 0.7 | 2.4 | ||
| Q4 | -1.4 | 4.0 | -5.4 | -1.5 | -2.1 | 1.1 | -0.9 | -3.7 | -1.4 | 0.2 | ||
| 2011 | ||||||||||||
| Q1 | -11.2 | -0.6 | -2.2 | 0.4 | -1.1 | -2.3 | 1.7 | -1.3 | 1.6 | -2.4 | ||
| Q2 | 0.2 | -2.4 | -4.7 | 0.5 | -0.7 | 4.9 | 2.4 | -2.3 | 2.0 | 0.2 | ||
| Q3 | 11.6 | 3.9 | -7.1 | -3.9 | -1.2 | -1.6 | 0.2 | -1.8 | -0.1 | 0.2 | ||
| Q4 | -1.8 | 4.5 | -4.5 | 2.9 | -0.5 | 0.3 | 0.3 | 6.6 | 0.9 | -1.2 | ||
| 2012 | ||||||||||||
| Q1 | -3.9 | -4.9 | -0.2 | -0.6 | -1.0 | 0.6 | -2.5 | -2.3 | -2.5 | -1.2 | ||
| Q2 | -0.1 | 2.1 | 2.0 | -3.6 | -0.5 | 1.0 | 0.2 | -1.2 | -0.1 | 3.4 | ||
| Q3 | -7.4 | -7.1 | -1.0 | 7.6 | -0.3 | 1.2 | 0.4 | 3.4 | 0.9 | 0.1 | ||
| Q4 | 0.2 | -1.4 | 4.8 | 1.2 | 0.5 | 0.3 | 3.4 | -2.1 | 2.6 | 1.9 | ||
| 2013 | ||||||||||||
| Q1 | 7.0 | 5.4 | 1.2 | -12.7 | -1.0 | 0.3 | -4.5 | 5.6 | -3.4 | -0.5 | ||
| Q2 | -3.2 | -3.2 | 4.8 | 3.0 | -1.0 | 0.1 | 0.7 | -1.4 | 0.1 | -0.9 | ||
| Q3 | 9.3 | 2.3 | 5.2 | 4.2 | -0.6 | 1.1 | 1.8 | 3.7 | 2.6 | 4.4 | ||
| Q4 | 1.3 | -3.5 | 0.9 | 1.5 | -0.7 | 1.4 | 0.1 | 0.8 | -0.4 | -0.1 | ||
| 2014 | ||||||||||||
| Q1 | -1.0 | 1.1 | -0.4 | 2.2 | 6.0 | 1.1 | 1.7 | 6.8 | 2.8 | 1.9 | ||
| Q2 | 3.4 | 4.7 | 3.5 | 2.8 | -0.5 | -0.6 | 1.6 | 3.3 | 1.1 | 0.2 | ||
| Q3 | -4.2 | -0.5 | 3.0 | -0.2 | -5.6 | 1.7 | -0.1 | -4.8 | 0.1 | 0.5 | ||
| Table 5 Expenditure on Gross National Product at Current Market Prices - Seasonally Adjusted | |||||||||
| €million | |||||||||
| Period | Personal consumption of goods and services | Net exp. by central and local government on current goods and services | Gross domestic fixed capital formation | Value of physical changes in stocks | Exports of goods and services | Imports of goods and services | GDP at current market prices | Net factor income from the rest of the wrorld | GNP at current market prices |
| 2008 | |||||||||
| Q1 | 23,931 | 7,580 | 13,142 | -304 | 37,625 | -34,185 | 47,946 | -6,135 | 41,855 |
| Q2 | 23,693 | 7,722 | 10,948 | 199 | 37,003 | -33,325 | 46,729 | -6,135 | 40,664 |
| Q3 | 23,798 | 7,690 | 11,964 | 150 | 37,417 | -33,677 | 46,922 | -7,317 | 39,776 |
| Q4 | 23,254 | 7,796 | 9,121 | -414 | 38,253 | -32,638 | 45,238 | -6,278 | 38,685 |
| 2009 | |||||||||
| Q1 | 21,278 | 7,796 | 8,796 | -392 | 37,316 | -31,364 | 43,335 | -6,886 | 36,527 |
| Q2 | 20,920 | 7,288 | 8,515 | -279 | 36,958 | -30,596 | 42,670 | -7,263 | 35,411 |
| Q3 | 20,664 | 7,264 | 7,719 | -443 | 36,110 | -29,313 | 41,490 | -7,552 | 34,051 |
| Q4 | 20,652 | 7,312 | 7,953 | -396 | 36,099 | -30,269 | 40,570 | -6,833 | 33,558 |
| 2010 | |||||||||
| Q1 | 20,469 | 6,700 | 6,533 | -312 | 37,816 | -30,304 | 41,516 | -7,385 | 34,222 |
| Q2 | 20,702 | 6,559 | 6,889 | -343 | 39,309 | -32,103 | 41,765 | -7,050 | 34,740 |
| Q3 | 20,747 | 6,472 | 6,373 | 192 | 40,780 | -33,046 | 41,917 | -6,647 | 35,345 |
| Q4 | 20,467 | 6,710 | 6,249 | -103 | 40,016 | -33,561 | 39,685 | -5,363 | 34,103 |
| 2011 | |||||||||
| Q1 | 20,851 | 6,521 | 6,375 | -107 | 40,941 | -33,919 | 41,940 | -7,478 | 34,597 |
| Q2 | 20,786 | 6,571 | 6,580 | 223 | 41,712 | -32,761 | 43,102 | -8,003 | 35,114 |
| Q3 | 20,475 | 6,587 | 5,953 | 335 | 41,907 | -32,659 | 42,978 | -8,111 | 34,953 |
| Q4 | 20,784 | 6,434 | 5,875 | 358 | 42,576 | -33,076 | 42,954 | -8,548 | 34,163 |
| 2012 | |||||||||
| Q1 | 20,326 | 6,615 | 6,515 | -435 | 45,069 | -37,163 | 42,009 | -8,495 | 33,665 |
| Q2 | 20,503 | 6,495 | 5,838 | 440 | 45,744 | -36,989 | 42,185 | -7,330 | 34,880 |
| Q3 | 20,729 | 6,517 | 6,252 | -28 | 45,972 | -36,713 | 43,050 | -7,912 | 35,218 |
| Q4 | 20,830 | 6,296 | 8,090 | 346 | 45,733 | -36,220 | 45,428 | -7,798 | 37,260 |
| 2013 | |||||||||
| Q1 | 20,545 | 6,453 | 6,378 | 475 | 44,274 | -36,369 | 42,836 | -6,612 | 36,456 |
| Q2 | 20,710 | 6,522 | 6,068 | 186 | 46,655 | -36,813 | 43,411 | -7,380 | 36,082 |
| Q3 | 20,985 | 6,466 | 6,795 | 459 | 46,155 | -36,848 | 44,229 | -6,953 | 37,365 |
| Q4 | 21,032 | 6,512 | 7,216 | -246 | 46,938 | -37,665 | 44,266 | -6,346 | 37,485 |
| 2014 | |||||||||
| Q1 | 21,179 | 6,403 | 6,899 | 493 | 47,066 | -38,693 | 45,043 | -6,920 | 38,453 |
| Q2 | 21,232 | 6,446 | 7,464 | 65 | 52,525 | -41,313 | 45,797 | -7,239 | 38,624 |
| Q3 | 21,299 | 6,463 | 7,410 | 191 | 53,354 | -42,584 | 46,255 | -7,213 | 39,125 |
| Percentage change on previous quarter | |||||||||
| 2008 | |||||||||
| Q1 | 0.4 | 1.8 | 1.9 | -2.8 | -1.1 | -3.6 | -1.5 | ||
| Q2 | -1.0 | 1.9 | -16.7 | -1.7 | -2.5 | -2.5 | -2.8 | ||
| Q3 | 0.4 | -0.4 | 9.3 | 1.1 | 1.1 | 0.4 | -2.2 | ||
| Q4 | -2.3 | 1.4 | -23.8 | 2.2 | -3.1 | -3.6 | -2.7 | ||
| 2009 | |||||||||
| Q1 | -8.5 | -0.0 | -3.6 | -2.4 | -3.9 | -4.2 | -5.6 | ||
| Q2 | -1.7 | -6.5 | -3.2 | -1.0 | -2.4 | -1.5 | -3.1 | ||
| Q3 | -1.2 | -0.3 | -9.4 | -2.3 | -4.2 | -2.8 | -3.8 | ||
| Q4 | -0.1 | 0.7 | 3.0 | -0.0 | 3.3 | -2.2 | -1.4 | ||
| 2010 | |||||||||
| Q1 | -0.9 | -8.4 | -17.9 | 4.8 | 0.1 | 2.3 | 2.0 | ||
| Q2 | 1.1 | -2.1 | 5.4 | 3.9 | 5.9 | 0.6 | 1.5 | ||
| Q3 | 0.2 | -1.3 | -7.5 | 3.7 | 2.9 | 0.4 | 1.7 | ||
| Q4 | -1.4 | 3.7 | -2.0 | -1.9 | 1.6 | -5.3 | -3.5 | ||
| 2011 | |||||||||
| Q1 | 1.9 | -2.8 | 2.0 | 2.3 | 1.1 | 5.7 | 1.4 | ||
| Q2 | -0.3 | 0.8 | 3.2 | 1.9 | -3.4 | 2.8 | 1.5 | ||
| Q3 | -1.5 | 0.2 | -9.5 | 0.5 | -0.3 | -0.3 | -0.5 | ||
| Q4 | 1.5 | -2.3 | -1.3 | 1.6 | 1.3 | -0.1 | -2.3 | ||
| 2012 | |||||||||
| Q1 | -2.2 | 2.8 | 10.9 | 5.9 | 12.4 | -2.2 | -1.5 | ||
| Q2 | 0.9 | -1.8 | -10.4 | 1.5 | -0.5 | 0.4 | 3.6 | ||
| Q3 | 1.1 | 0.3 | 7.1 | 0.5 | -0.7 | 2.1 | 1.0 | ||
| Q4 | 0.5 | -3.4 | 29.4 | -0.5 | -1.3 | 5.5 | 5.8 | ||
| 2013 | |||||||||
| Q1 | -1.4 | 2.5 | -21.2 | -3.2 | 0.4 | -5.7 | -2.2 | ||
| Q2 | 0.8 | 1.1 | -4.9 | 5.4 | 1.2 | 1.3 | -1.0 | ||
| Q3 | 1.3 | -0.9 | 12.0 | -1.1 | 0.1 | 1.9 | 3.6 | ||
| Q4 | 0.2 | 0.7 | 6.2 | 1.7 | 2.2 | 0.1 | 0.3 | ||
| 2014 | |||||||||
| Q1 | 0.7 | -1.7 | -4.4 | 0.3 | 2.7 | 1.8 | 2.6 | ||
| Q2 | 0.2 | 0.7 | 8.2 | 11.6 | 6.8 | 1.7 | 0.4 | ||
| Q3 | 0.3 | 0.3 | -0.7 | 1.6 | 3.1 | 1.0 | 1.3 | ||
| Table 6 Expenditure on Gross National Product at Constant Market Prices (Chain linked annually and referenced to year 2012) - Seasonally Adjusted | |||||||||
| €million | |||||||||
| Period | Personal consumption of goods and services | Net exp. By central and local government on current goods and services | Gross domestic fixed capital formation | Value of physical changes in stocks | Exports of goods and services | Imports of goods and services | GDP at constant market prices | Net factor income from the rest of the world | GNP at constant market prices |
| 2008 | |||||||||
| Q1 | 22,485 | 7,562 | 11,381 | -516 | 40,994 | -38,176 | 47,226 | -6,654 | 40,499 |
| Q2 | 22,036 | 7,544 | 9,919 | 342 | 40,777 | -37,010 | 45,281 | -6,771 | 38,393 |
| Q3 | 22,129 | 7,532 | 10,810 | 391 | 40,314 | -37,095 | 45,016 | -7,633 | 37,305 |
| Q4 | 21,697 | 7,596 | 8,391 | -596 | 40,127 | -35,601 | 43,073 | -6,966 | 35,929 |
| 2009 | |||||||||
| Q1 | 21,017 | 7,528 | 8,228 | -384 | 39,391 | -34,117 | 42,773 | -7,214 | 35,751 |
| Q2 | 20,913 | 7,368 | 8,262 | -325 | 38,958 | -33,639 | 42,813 | -7,642 | 35,093 |
| Q3 | 20,832 | 7,139 | 7,715 | -424 | 38,525 | -32,596 | 41,901 | -7,854 | 34,109 |
| Q4 | 20,817 | 7,141 | 7,956 | -362 | 38,862 | -34,022 | 41,529 | -7,716 | 33,774 |
| 2010 | |||||||||
| Q1 | 21,067 | 6,853 | 6,410 | -346 | 40,017 | -32,947 | 41,884 | -7,683 | 34,305 |
| Q2 | 21,207 | 6,845 | 7,060 | -362 | 40,796 | -34,407 | 42,218 | -7,338 | 34,875 |
| Q3 | 21,223 | 6,687 | 6,612 | 228 | 42,370 | -35,258 | 42,496 | -6,795 | 35,709 |
| Q4 | 20,853 | 6,718 | 6,311 | -100 | 42,138 | -35,832 | 41,919 | -5,951 | 35,776 |
| 2011 | |||||||||
| Q1 | 21,159 | 6,743 | 6,476 | -155 | 43,276 | -35,456 | 42,589 | -7,758 | 34,922 |
| Q2 | 20,951 | 6,720 | 6,815 | 128 | 43,363 | -34,141 | 43,449 | -8,390 | 34,992 |
| Q3 | 20,570 | 6,585 | 6,144 | 408 | 43,861 | -34,017 | 43,392 | -8,439 | 35,078 |
| Q4 | 20,702 | 6,462 | 6,149 | 427 | 43,865 | -34,013 | 43,793 | -9,086 | 34,651 |
| 2012 | |||||||||
| Q1 | 20,464 | 6,576 | 6,563 | -494 | 46,202 | -37,523 | 42,710 | -8,429 | 34,236 |
| Q2 | 20,563 | 6,471 | 5,873 | 408 | 45,352 | -36,931 | 42,687 | -7,365 | 35,384 |
| Q3 | 20,726 | 6,554 | 6,194 | 26 | 45,368 | -36,530 | 43,089 | -7,761 | 35,436 |
| Q4 | 20,673 | 6,317 | 8,049 | 379 | 45,584 | -36,135 | 44,216 | -7,963 | 36,109 |
| 2013 | |||||||||
| Q1 | 20,307 | 6,439 | 6,311 | 529 | 45,261 | -36,531 | 42,713 | -6,630 | 35,939 |
| Q2 | 20,391 | 6,331 | 6,079 | 223 | 45,921 | -36,653 | 42,771 | -7,283 | 35,611 |
| Q3 | 20,551 | 6,736 | 6,717 | 519 | 46,029 | -36,970 | 43,868 | -6,786 | 37,179 |
| Q4 | 20,517 | 6,748 | 7,080 | -369 | 47,337 | -37,904 | 43,682 | -6,414 | 37,145 |
| 2014 | |||||||||
| Q1 | 20,577 | 6,636 | 6,730 | 483 | 48,739 | -38,610 | 44,912 | -7,096 | 37,835 |
| Q2 | 20,541 | 6,710 | 7,267 | 28 | 51,801 | -41,090 | 45,410 | -7,524 | 37,921 |
| Q3 | 20,536 | 6,651 | 7,210 | 92 | 53,176 | -42,520 | 45,446 | -7,420 | 38,100 |
| Percentage change on previous quarter | |||||||||
| 2008 | |||||||||
| Q1 | 0.3 | -0.5 | 4.5 | -2.1 | -1.3 | -0.1 | 4.1 | ||
| Q2 | -2.0 | -0.2 | -12.8 | -0.5 | -3.1 | -4.1 | -5.2 | ||
| Q3 | 0.4 | -0.2 | 9.0 | -1.1 | 0.2 | -0.6 | -2.8 | ||
| Q4 | -2.0 | 0.9 | -22.4 | -0.5 | -4.0 | -4.3 | -3.7 | ||
| 2009 | |||||||||
| Q1 | -3.1 | -0.9 | -1.9 | -1.8 | -4.2 | -0.7 | -0.5 | ||
| Q2 | -0.5 | -2.1 | 0.4 | -1.1 | -1.4 | 0.1 | -1.8 | ||
| Q3 | -0.4 | -3.1 | -6.6 | -1.1 | -3.1 | -2.1 | -2.8 | ||
| Q4 | -0.1 | 0.0 | 3.1 | 0.9 | 4.4 | -0.9 | -1.0 | ||
| 2010 | |||||||||
| Q1 | 1.2 | -4.0 | -19.4 | 3.0 | -3.2 | 0.9 | 1.6 | ||
| Q2 | 0.7 | -0.1 | 10.1 | 1.9 | 4.4 | 0.8 | 1.7 | ||
| Q3 | 0.1 | -2.3 | -6.3 | 3.9 | 2.5 | 0.7 | 2.4 | ||
| Q4 | -1.7 | 0.5 | -4.6 | -0.5 | 1.6 | -1.4 | 0.2 | ||
| 2011 | |||||||||
| Q1 | 1.5 | 0.4 | 2.6 | 2.7 | -1.0 | 1.6 | -2.4 | ||
| Q2 | -1.0 | -0.3 | 5.2 | 0.2 | -3.7 | 2.0 | 0.2 | ||
| Q3 | -1.8 | -2.0 | -9.8 | 1.1 | -0.4 | -0.1 | 0.2 | ||
| Q4 | 0.6 | -1.9 | 0.1 | 0.0 | -0.0 | 0.9 | -1.2 | ||
| 2012 | |||||||||
| Q1 | -1.1 | 1.8 | 6.7 | 5.3 | 10.3 | -2.5 | -1.2 | ||
| Q2 | 0.5 | -1.6 | -10.5 | -1.8 | -1.6 | -0.1 | 3.4 | ||
| Q3 | 0.8 | 1.3 | 5.5 | 0.0 | -1.1 | 0.9 | 0.1 | ||
| Q4 | -0.3 | -3.6 | 30.0 | 0.5 | -1.1 | 2.6 | 1.9 | ||
| 2013 | |||||||||
| Q1 | -1.8 | 1.9 | -21.6 | -0.7 | 1.1 | -3.4 | -0.5 | ||
| Q2 | 0.4 | -1.7 | -3.7 | 1.5 | 0.3 | 0.1 | -0.9 | ||
| Q3 | 0.8 | 6.4 | 10.5 | 0.2 | 0.9 | 2.6 | 4.4 | ||
| Q4 | -0.2 | 0.2 | 5.4 | 2.8 | 2.5 | -0.4 | -0.1 | ||
| 2014 | |||||||||
| Q1 | 0.3 | -1.7 | -4.9 | 3.0 | 1.9 | 2.8 | 1.9 | ||
| Q2 | -0.2 | 1.1 | 8.0 | 6.3 | 6.4 | 1.1 | 0.2 | ||
| Q3 | -0.0 | -0.9 | -0.8 | 2.7 | 3.5 | 0.1 | 0.5 | ||
| Annex 1a - Trade Summary: Quarterly Breakdown of trade into goods/services at current and constant prices | ||||||||||||||||||
| Trade at Current Prices | Trade at Constant Prices | € million | ||||||||||||||||
| Exports | Imports | Exports | Imports | |||||||||||||||
| Total | Goods | Services | Total | Goods | Services | Total | Goods | Services | Total | Goods | Services | |||||||
| 2008 | ||||||||||||||||||
| Q1 | 36,630 | 21,749 | 14,881 | 33,687 | 15,446 | 18,241 | 39,961 | 23,305 | 16,657 | 37,574 | 17,306 | 20,268 | ||||||
| Q2 | 37,773 | 22,178 | 15,595 | 33,332 | 14,479 | 18,853 | 41,443 | 24,265 | 17,178 | 36,998 | 16,264 | 20,735 | ||||||
| Q3 | 37,016 | 21,553 | 15,463 | 32,457 | 13,857 | 18,600 | 39,939 | 22,976 | 16,962 | 35,814 | 15,470 | 20,344 | ||||||
| Q4 | 38,762 | 22,925 | 15,837 | 34,400 | 13,445 | 20,955 | 40,785 | 23,359 | 17,426 | 37,531 | 14,682 | 22,849 | ||||||
| 150,180 | 88,405 | 61,775 | 133,876 | 57,227 | 76,649 | 162,128 | 93,905 | 68,223 | 147,917 | 63,722 | 84,195 | |||||||
| 2009 | ||||||||||||||||||
| Q1 | 36,511 | 21,932 | 14,579 | 30,821 | 12,245 | 18,576 | 38,284 | 22,557 | 15,727 | 33,438 | 13,757 | 19,681 | ||||||
| Q2 | 37,697 | 22,104 | 15,593 | 30,618 | 11,389 | 19,229 | 39,795 | 22,997 | 16,798 | 33,712 | 13,310 | 20,402 | ||||||
| Q3 | 35,783 | 20,486 | 15,297 | 28,083 | 10,468 | 17,615 | 38,276 | 21,670 | 16,606 | 31,306 | 12,440 | 18,866 | ||||||
| Q4 | 36,373 | 20,518 | 15,855 | 32,034 | 11,076 | 20,958 | 39,305 | 21,994 | 17,311 | 35,904 | 13,283 | 22,621 | ||||||
| 146,363 | 85,040 | 61,323 | 121,555 | 45,178 | 76,377 | 155,661 | 89,218 | 66,442 | 134,360 | 52,790 | 81,570 | |||||||
| 2010 | ||||||||||||||||||
| Q1 | 37,011 | 21,462 | 15,549 | 29,638 | 11,166 | 18,472 | 38,957 | 22,420 | 16,537 | 32,170 | 12,767 | 19,404 | ||||||
| Q2 | 40,218 | 23,197 | 17,021 | 32,280 | 11,825 | 20,455 | 41,708 | 23,679 | 18,028 | 34,663 | 13,303 | 21,361 | ||||||
| Q3 | 40,491 | 23,389 | 17,102 | 31,815 | 11,509 | 20,306 | 42,202 | 24,098 | 18,104 | 33,961 | 12,703 | 21,257 | ||||||
| Q4 | 40,090 | 21,685 | 18,405 | 35,290 | 12,356 | 22,934 | 42,399 | 22,933 | 19,466 | 37,619 | 13,457 | 24,161 | ||||||
| 157,811 | 89,733 | 68,078 | 129,023 | 46,856 | 82,167 | 165,266 | 93,131 | 72,135 | 138,414 | 52,230 | 86,183 | |||||||
| 2011 | ||||||||||||||||||
| Q1 | 40,446 | 22,884 | 17,562 | 33,199 | 12,712 | 20,487 | 41,963 | 23,952 | 18,011 | 34,620 | 13,484 | 21,135 | ||||||
| Q2 | 42,433 | 23,183 | 19,250 | 33,034 | 12,252 | 20,782 | 44,635 | 24,557 | 20,078 | 34,575 | 13,158 | 21,416 | ||||||
| Q3 | 41,653 | 23,029 | 18,624 | 31,463 | 11,175 | 20,288 | 43,768 | 24,298 | 19,470 | 32,724 | 11,752 | 20,972 | ||||||
| Q4 | 42,555 | 22,551 | 20,004 | 34,701 | 12,187 | 22,514 | 43,963 | 23,169 | 20,794 | 35,654 | 12,596 | 23,058 | ||||||
| 167,086 | 91,647 | 75,439 | 132,398 | 48,326 | 84,072 | 174,329 | 95,976 | 78,353 | 137,572 | 50,991 | 86,582 | |||||||
| 2012 | ||||||||||||||||||
| Q1 | 44,488 | 24,565 | 19,923 | 36,284 | 14,630 | 21,654 | 44,923 | 24,817 | 20,106 | 36,605 | 14,742 | 21,863 | ||||||
| Q2 | 46,599 | 24,725 | 21,874 | 37,475 | 13,119 | 24,356 | 46,693 | 24,837 | 21,855 | 37,557 | 13,175 | 24,383 | ||||||
| Q3 | 45,712 | 24,435 | 21,277 | 35,567 | 13,379 | 22,188 | 45,290 | 24,109 | 21,181 | 35,270 | 13,217 | 22,053 | ||||||
| Q4 | 45,708 | 23,251 | 22,457 | 37,753 | 13,443 | 24,310 | 45,600 | 23,212 | 22,388 | 37,648 | 13,438 | 24,210 | ||||||
| 182,506 | 96,976 | 85,530 | 147,079 | 54,571 | 92,508 | 182,506 | 96,976 | 85,530 | 147,079 | 54,571 | 92,508 | |||||||
| 2013 | ||||||||||||||||||
| Q1 | 43,687 | 22,467 | 21,220 | 35,367 | 13,796 | 21,571 | 43,912 | 22,767 | 21,145 | 35,549 | 14,044 | 21,506 | ||||||
| Q2 | 47,498 | 24,092 | 23,406 | 37,436 | 13,798 | 23,638 | 47,384 | 24,210 | 23,174 | 37,405 | 14,008 | 23,397 | ||||||
| Q3 | 45,882 | 23,172 | 22,710 | 35,779 | 13,589 | 22,190 | 45,952 | 23,477 | 22,475 | 35,774 | 13,788 | 21,986 | ||||||
| Q4 | 46,988 | 22,032 | 24,956 | 39,111 | 14,397 | 24,714 | 47,318 | 22,555 | 24,763 | 39,303 | 14,768 | 24,535 | ||||||
| 184,056 | 91,763 | 92,293 | 147,694 | 55,580 | 92,114 | 184,565 | 93,010 | 91,556 | 148,031 | 56,608 | 91,423 | |||||||
| 2014 | ||||||||||||||||||
| Q1 | 46,669 | 24,320 | 22,349 | 37,689 | 14,174 | 23,515 | 47,103 | 25,105 | 21,999 | 37,634 | 14,212 | 23,422 | ||||||
| Q2 | 53,122 | 27,196 | 25,926 | 41,949 | 15,017 | 26,932 | 53,569 | 28,095 | 25,474 | 41,866 | 15,199 | 26,667 | ||||||
| Q3 | 53,069 | 27,319 | 25,750 | 41,550 | 14,961 | 26,589 | 53,084 | 27,797 | 25,287 | 41,370 | 15,133 | 26,237 | ||||||
| % growth rate year on year | ||||||||||||||||||
| 2008 | ||||||||||||||||||
| Q1 | -0.7 | -4.6 | 5.5 | 2.5 | -8.1 | 13.5 | 1.2 | 0.9 | 1.5 | 0.8 | -10.1 | 12.3 | ||||||
| Q2 | -1.9 | -5.9 | 4.4 | 1.0 | -6.3 | 7.4 | 0.8 | 1.2 | 0.2 | -0.3 | -7.7 | 6.4 | ||||||
| Q3 | -1.6 | -3.5 | 1.3 | -1.4 | -7.5 | 3.7 | -0.7 | 0.2 | -2.0 | -2.8 | -9.0 | 2.5 | ||||||
| Q4 | -1.7 | -5.3 | 4.0 | -5.0 | -21.1 | 9.3 | -4.6 | -8.0 | 0.4 | -7.5 | -24.2 | 7.8 | ||||||
| 2009 | ||||||||||||||||||
| Q1 | -0.3 | 0.8 | -2.0 | -8.5 | -20.7 | 1.8 | -4.2 | -3.2 | -5.6 | -11.0 | -20.5 | -2.9 | ||||||
| Q2 | -0.2 | -0.3 | -0.0 | -8.1 | -21.3 | 2.0 | -4.0 | -5.2 | -2.2 | -8.9 | -18.2 | -1.6 | ||||||
| Q3 | -3.3 | -5.0 | -1.1 | -13.5 | -24.5 | -5.3 | -4.2 | -5.7 | -2.1 | -12.6 | -19.6 | -7.3 | ||||||
| Q4 | -6.2 | -10.5 | 0.1 | -6.9 | -17.6 | 0.0 | -3.6 | -5.8 | -0.7 | -4.3 | -9.5 | -1.0 | ||||||
| 2010 | ||||||||||||||||||
| Q1 | 1.4 | -2.1 | 6.7 | -3.8 | -8.8 | -0.6 | 1.8 | -0.6 | 5.2 | -3.8 | -7.2 | -1.4 | ||||||
| Q2 | 6.7 | 4.9 | 9.2 | 5.4 | 3.8 | 6.4 | 4.8 | 3.0 | 7.3 | 2.8 | -0.1 | 4.7 | ||||||
| Q3 | 13.2 | 14.2 | 11.8 | 13.3 | 9.9 | 15.3 | 10.3 | 11.2 | 9.0 | 8.5 | 2.1 | 12.7 | ||||||
| Q4 | 10.2 | 5.7 | 16.1 | 10.2 | 11.6 | 9.4 | 7.9 | 4.3 | 12.4 | 4.8 | 1.3 | 6.8 | ||||||
| 2011 | ||||||||||||||||||
| Q1 | 9.3 | 6.6 | 12.9 | 12.0 | 13.8 | 10.9 | 7.7 | 6.8 | 8.9 | 7.6 | 5.6 | 8.9 | ||||||
| Q2 | 5.5 | -0.1 | 13.1 | 2.3 | 3.6 | 1.6 | 7.0 | 3.7 | 11.4 | -0.3 | -1.1 | 0.3 | ||||||
| Q3 | 2.9 | -1.5 | 8.9 | -1.1 | -2.9 | -0.1 | 3.7 | 0.8 | 7.5 | -3.6 | -7.5 | -1.3 | ||||||
| Q4 | 6.1 | 4.0 | 8.7 | -1.7 | -1.4 | -1.8 | 3.7 | 1.0 | 6.8 | -5.2 | -6.4 | -4.6 | ||||||
| 2012 | ||||||||||||||||||
| Q1 | 10.0 | 7.3 | 13.4 | 9.3 | 15.1 | 5.7 | 7.1 | 3.6 | 11.6 | 5.7 | 9.3 | 3.4 | ||||||
| Q2 | 9.8 | 6.7 | 13.6 | 13.4 | 7.1 | 17.2 | 4.6 | 1.1 | 8.9 | 8.6 | 0.1 | 13.9 | ||||||
| Q3 | 9.7 | 6.1 | 14.2 | 13.0 | 19.7 | 9.4 | 3.5 | -0.8 | 8.8 | 7.8 | 12.5 | 5.2 | ||||||
| Q4 | 7.4 | 3.1 | 12.3 | 8.8 | 10.3 | 8.0 | 3.7 | 0.2 | 7.7 | 5.6 | 6.7 | 5.0 | ||||||
| 2013 | ||||||||||||||||||
| Q1 | -1.8 | -8.5 | 6.5 | -2.5 | -5.7 | -0.4 | -2.3 | -8.3 | 5.2 | -2.9 | -4.7 | -1.6 | ||||||
| Q2 | 1.9 | -2.6 | 7.0 | -0.1 | 5.2 | -2.9 | 1.5 | -2.5 | 6.0 | -0.4 | 6.3 | -4.0 | ||||||
| Q3 | 0.4 | -5.2 | 6.7 | 0.6 | 1.6 | 0.0 | 1.5 | -2.6 | 6.1 | 1.4 | 4.3 | -0.3 | ||||||
| Q4 | 2.8 | -5.2 | 11.1 | 3.6 | 7.1 | 1.7 | 3.8 | -2.8 | 10.6 | 4.4 | 9.9 | 1.3 | ||||||
| 2014 | ||||||||||||||||||
| Q1 | 6.8 | 8.2 | 5.3 | 6.6 | 2.7 | 9.0 | 7.3 | 10.3 | 4.0 | 5.9 | 1.3 | 8.9 | ||||||
| Q2 | 11.8 | 12.9 | 10.8 | 12.1 | 8.8 | 13.9 | 13.0 | 15.9 | 9.9 | 11.8 | 8.2 | 14.0 | ||||||
| Q3 | 15.7 | 17.9 | 13.4 | 16.1 | 10.1 | 19.8 | 15.5 | 18.4 | 12.5 | 15.6 | 9.8 | 19.3 | ||||||
| Seasonally Adjusted (SA) Annex 1 - Trade Summary: Quarterly Breakdown of trade into goods/services at SA current and SA constant prices | ||||||||||||||||||||
| Trade at Current Prices | Trade at Constant Prices | € million | ||||||||||||||||||
| Exports | Imports | Exports | Imports | |||||||||||||||||
| Total | Goods | Services | Total | Goods | Services | Total | Goods | Services | Total | Goods | Services | |||||||||
| 2008 | ||||||||||||||||||||
| Q1 | 37,625 | 22,072 | 15,330 | 34,185 | 15,233 | 18,984 | 40,994 | 23,686 | 17,181 | 38,176 | 17,128 | 21,080 | ||||||||
| Q2 | 37,003 | 21,756 | 15,279 | 33,325 | 14,532 | 18,741 | 40,777 | 23,754 | 16,937 | 37,010 | 16,303 | 20,638 | ||||||||
| Q3 | 37,417 | 21,891 | 15,470 | 33,677 | 14,539 | 19,043 | 40,314 | 23,310 | 16,972 | 37,095 | 16,229 | 20,886 | ||||||||
| Q4 | 38,253 | 22,807 | 15,658 | 32,638 | 13,019 | 19,850 | 40,127 | 23,286 | 17,074 | 35,601 | 14,177 | 21,545 | ||||||||
| 150,297 | 88,526 | 61,736 | 133,825 | 57,323 | 76,618 | 162,212 | 94,037 | 68,164 | 147,881 | 63,837 | 84,150 | |||||||||
| 2009 | ||||||||||||||||||||
| Q1 | 37,316 | 22,139 | 15,092 | 31,364 | 12,046 | 19,347 | 39,391 | 22,808 | 16,401 | 34,117 | 13,620 | 20,552 | ||||||||
| Q2 | 36,958 | 21,679 | 15,218 | 30,596 | 11,395 | 19,056 | 38,958 | 22,505 | 16,449 | 33,639 | 13,265 | 20,236 | ||||||||
| Q3 | 36,110 | 20,669 | 15,393 | 29,313 | 10,929 | 18,187 | 38,525 | 21,823 | 16,685 | 32,596 | 12,989 | 19,539 | ||||||||
| Q4 | 36,099 | 20,656 | 15,569 | 30,269 | 10,848 | 19,763 | 38,862 | 22,192 | 16,846 | 34,022 | 12,978 | 21,212 | ||||||||
| 146,482 | 85,143 | 61,272 | 121,542 | 45,218 | 76,354 | 155,737 | 89,327 | 66,381 | 134,375 | 52,852 | 81,539 | |||||||||
| 2010 | ||||||||||||||||||||
| Q1 | 37,816 | 21,604 | 16,145 | 30,304 | 10,990 | 19,315 | 40,017 | 22,611 | 17,266 | 32,947 | 12,634 | 20,337 | ||||||||
| Q2 | 39,309 | 22,679 | 16,574 | 32,103 | 11,731 | 20,173 | 40,796 | 23,108 | 17,652 | 34,407 | 13,153 | 21,106 | ||||||||
| Q3 | 40,780 | 23,453 | 17,293 | 33,046 | 11,991 | 20,946 | 42,370 | 24,116 | 18,264 | 35,258 | 13,245 | 21,986 | ||||||||
| Q4 | 40,016 | 22,095 | 18,025 | 33,561 | 12,203 | 21,727 | 42,138 | 23,402 | 18,917 | 35,832 | 13,251 | 22,762 | ||||||||
| 157,920 | 89,831 | 68,038 | 129,014 | 46,914 | 82,160 | 165,322 | 93,237 | 72,098 | 138,444 | 52,283 | 86,192 | |||||||||
| 2011 | ||||||||||||||||||||
| Q1 | 40,941 | 22,955 | 18,227 | 33,919 | 12,460 | 21,411 | 43,276 | 24,097 | 18,915 | 35,456 | 13,311 | 22,163 | ||||||||
| Q2 | 41,712 | 22,623 | 18,737 | 32,761 | 12,143 | 20,353 | 43,363 | 23,904 | 19,527 | 34,141 | 12,977 | 20,985 | ||||||||
| Q3 | 41,907 | 22,949 | 18,905 | 32,659 | 11,612 | 20,983 | 43,861 | 24,175 | 19,713 | 34,017 | 12,234 | 21,741 | ||||||||
| Q4 | 42,576 | 23,227 | 19,529 | 33,076 | 12,109 | 21,318 | 43,865 | 23,892 | 20,168 | 34,013 | 12,469 | 21,712 | ||||||||
| 167,136 | 91,754 | 75,397 | 132,415 | 48,324 | 84,065 | 174,365 | 96,068 | 78,323 | 137,627 | 50,991 | 86,601 | |||||||||
| 2012 | ||||||||||||||||||||
| Q1 | 45,069 | 24,634 | 20,648 | 37,163 | 14,388 | 22,695 | 46,202 | 24,966 | 20,968 | 37,523 | 14,558 | 22,943 | ||||||||
| Q2 | 45,744 | 24,026 | 21,318 | 36,989 | 12,936 | 23,766 | 45,352 | 24,052 | 21,346 | 36,931 | 12,960 | 23,828 | ||||||||
| Q3 | 45,972 | 24,246 | 21,619 | 36,713 | 13,869 | 22,878 | 45,368 | 23,915 | 21,485 | 36,530 | 13,746 | 22,795 | ||||||||
| Q4 | 45,733 | 24,139 | 21,921 | 36,220 | 13,375 | 23,182 | 45,584 | 24,122 | 21,722 | 36,135 | 13,303 | 22,993 | ||||||||
| 182,518 | 97,046 | 85,505 | 147,085 | 54,568 | 92,521 | 182,505 | 97,054 | 85,521 | 147,118 | 54,568 | 92,558 | |||||||||
| 2013 | ||||||||||||||||||||
| Q1 | 44,274 | 22,527 | 21,974 | 36,369 | 13,617 | 22,694 | 45,261 | 22,909 | 21,976 | 36,531 | 13,895 | 22,606 | ||||||||
| Q2 | 46,655 | 23,341 | 22,838 | 36,813 | 13,596 | 22,907 | 45,921 | 23,333 | 22,688 | 36,653 | 13,790 | 22,723 | ||||||||
| Q3 | 46,155 | 22,948 | 23,087 | 36,848 | 14,024 | 22,886 | 46,029 | 23,277 | 22,818 | 36,970 | 14,297 | 22,721 | ||||||||
| Q4 | 46,938 | 22,945 | 24,368 | 37,665 | 14,332 | 23,629 | 47,337 | 23,518 | 24,062 | 37,904 | 14,619 | 23,402 | ||||||||
| 184,022 | 91,760 | 92,267 | 147,695 | 55,569 | 92,115 | 184,548 | 93,037 | 91,544 | 148,057 | 56,601 | 91,451 | |||||||||
| 2014 | ||||||||||||||||||||
| Q1 | 47,066 | 24,400 | 23,138 | 38,693 | 13,961 | 24,688 | 48,739 | 25,290 | 22,948 | 38,610 | 14,042 | 24,571 | ||||||||
| Q2 | 52,525 | 26,308 | 25,348 | 41,313 | 14,887 | 26,123 | 51,801 | 26,981 | 24,876 | 41,090 | 15,035 | 25,885 | ||||||||
| Q3 | 53,354 | 27,036 | 26,139 | 42,584 | 15,382 | 27,287 | 53,176 | 27,581 | 25,646 | 42,520 | 15,648 | 26,972 | ||||||||
| % growth rate quarter on quarter | ||||||||||||||||||||
| 2008 | ||||||||||||||||||||
| Q1 | -2.8 | -7.3 | 1.4 | -1.1 | -6.9 | 4.3 | -2.1 | -5.3 | 0.5 | -1.3 | -7.7 | 5.2 | ||||||||
| Q2 | -1.7 | -1.4 | -0.3 | -2.5 | -4.6 | -1.3 | -0.5 | 0.3 | -1.4 | -3.1 | -4.8 | -2.1 | ||||||||
| Q3 | 1.1 | 0.6 | 1.3 | 1.1 | 0.0 | 1.6 | -1.1 | -1.9 | 0.2 | 0.2 | -0.5 | 1.2 | ||||||||
| Q4 | 2.2 | 4.2 | 1.2 | -3.1 | -10.5 | 4.2 | -0.5 | -0.1 | 0.6 | -4.0 | -12.6 | 3.2 | ||||||||
| 2009 | ||||||||||||||||||||
| Q1 | -2.4 | -2.9 | -3.6 | -3.9 | -7.5 | -2.5 | -1.8 | -2.1 | -3.9 | -4.2 | -3.9 | -4.6 | ||||||||
| Q2 | -1.0 | -2.1 | 0.8 | -2.4 | -5.4 | -1.5 | -1.1 | -1.3 | 0.3 | -1.4 | -2.6 | -1.5 | ||||||||
| Q3 | -2.3 | -4.7 | 1.1 | -4.2 | -4.1 | -4.6 | -1.1 | -3.0 | 1.4 | -3.1 | -2.1 | -3.4 | ||||||||
| Q4 | -0.0 | -0.1 | 1.1 | 3.3 | -0.7 | 8.7 | 0.9 | 1.7 | 1.0 | 4.4 | -0.1 | 8.6 | ||||||||
| 2010 | ||||||||||||||||||||
| Q1 | 4.8 | 4.6 | 3.7 | 0.1 | 1.3 | -2.3 | 3.0 | 1.9 | 2.5 | -3.2 | -2.6 | -4.1 | ||||||||
| Q2 | 3.9 | 5.0 | 2.7 | 5.9 | 6.7 | 4.4 | 1.9 | 2.2 | 2.2 | 4.4 | 4.1 | 3.8 | ||||||||
| Q3 | 3.7 | 3.4 | 4.3 | 2.9 | 2.2 | 3.8 | 3.9 | 4.4 | 3.5 | 2.5 | 0.7 | 4.2 | ||||||||
| Q4 | -1.9 | -5.8 | 4.2 | 1.6 | 1.8 | 3.7 | -0.5 | -3.0 | 3.6 | 1.6 | 0.0 | 3.5 | ||||||||
| 2011 | ||||||||||||||||||||
| Q1 | 2.3 | 3.9 | 1.1 | 1.1 | 2.1 | -1.5 | 2.7 | 3.0 | -0.0 | -1.0 | 0.5 | -2.6 | ||||||||
| Q2 | 1.9 | -1.4 | 2.8 | -3.4 | -2.5 | -4.9 | 0.2 | -0.8 | 3.2 | -3.7 | -2.5 | -5.3 | ||||||||
| Q3 | 0.5 | 1.4 | 0.9 | -0.3 | -4.4 | 3.1 | 1.1 | 1.1 | 1.0 | -0.4 | -5.7 | 3.6 | ||||||||
| Q4 | 1.6 | 1.2 | 3.3 | 1.3 | 4.3 | 1.6 | 0.0 | -1.2 | 2.3 | -0.0 | 1.9 | -0.1 | ||||||||
| 2012 | ||||||||||||||||||||
| Q1 | 5.9 | 6.1 | 5.7 | 12.4 | 18.8 | 6.5 | 5.3 | 4.5 | 4.0 | 10.3 | 16.8 | 5.7 | ||||||||
| Q2 | 1.5 | -2.5 | 3.2 | -0.5 | -10.1 | 4.7 | -1.8 | -3.7 | 1.8 | -1.6 | -11.0 | 3.9 | ||||||||
| Q3 | 0.5 | 0.9 | 1.4 | -0.7 | 7.2 | -3.7 | 0.0 | -0.6 | 0.7 | -1.1 | 6.1 | -4.3 | ||||||||
| Q4 | -0.5 | -0.4 | 1.4 | -1.3 | -3.6 | 1.3 | 0.5 | 0.9 | 1.1 | -1.1 | -3.2 | 0.9 | ||||||||
| 2013 | ||||||||||||||||||||
| Q1 | -3.2 | -6.7 | 0.2 | 0.4 | 1.8 | -2.1 | -0.7 | -5.0 | 1.2 | 1.1 | 4.5 | -1.7 | ||||||||
| Q2 | 5.4 | 3.6 | 3.9 | 1.2 | -0.2 | 0.9 | 1.5 | 1.9 | 3.2 | 0.3 | -0.8 | 0.5 | ||||||||
| Q3 | -1.1 | -1.7 | 1.1 | 0.1 | 3.1 | -0.1 | 0.2 | -0.2 | 0.6 | 0.9 | 3.7 | -0.0 | ||||||||
| Q4 | 1.7 | -0.0 | 5.5 | 2.2 | 2.2 | 3.2 | 2.8 | 1.0 | 5.5 | 2.5 | 2.3 | 3.0 | ||||||||
| 2014 | ||||||||||||||||||||
| Q1 | 0.3 | 6.3 | -5.0 | 2.7 | -2.6 | 4.5 | 3.0 | 7.5 | -4.6 | 1.9 | -3.9 | 5.0 | ||||||||
| Q2 | 11.6 | 7.8 | 9.5 | 6.8 | 6.6 | 5.8 | 6.3 | 6.7 | 8.4 | 6.4 | 7.1 | 5.3 | ||||||||
| Q3 | 1.6 | 2.8 | 3.1 | 3.1 | 3.3 | 4.5 | 2.7 | 2.2 | 3.1 | 3.5 | 4.1 | 4.2 | ||||||||
| Annex 2 Transportable Goods Industries & Utilities Sector and Building & Construction Sector at Constant Factor Cost - | |||||||
| (Chain linked annually and referenced to year 2012) Non-Seasonally Adjusted and Seasonally Adjusted and Seasonally Adjusted | |||||||
| NON-SEASONALLY ADJUSTED | SEASONALLY ADJUSTED | ||||||
| of which | of which | of which | of which | ||||
| Period | Industry | Transportable Goods Industries and Utilities | Building and Construct. | Industry | Transportable Goods Industries and Utilities | Building and construct. | |
| 2008 | |||||||
| Q1 | 12,515 | 10,601 | 1,690 | 12,072 | 10,147 | 1,717 | |
| Q2 | 12,545 | 10,940 | 1,574 | 12,057 | 10,289 | 1,646 | |
| Q3 | 11,482 | 9,557 | 1,616 | 12,044 | 10,267 | 1,565 | |
| Q4 | 10,317 | 8,557 | 1,464 | 10,749 | 8,991 | 1,423 | |
| 2009 | |||||||
| Q1 | 11,551 | 10,362 | 1,265 | 11,147 | 9,930 | 1,293 | |
| Q2 | 11,396 | 10,424 | 1,146 | 10,790 | 9,684 | 1,197 | |
| Q3 | 9,647 | 8,491 | 1,140 | 10,117 | 9,078 | 1,098 | |
| Q4 | 9,251 | 8,204 | 1,062 | 9,795 | 8,772 | 1,028 | |
| 2010 | |||||||
| Q1 | 11,346 | 10,542 | 829 | 10,802 | 9,941 | 857 | |
| Q2 | 10,984 | 10,172 | 840 | 10,387 | 9,492 | 876 | |
| Q3 | 9,884 | 9,031 | 892 | 10,380 | 9,626 | 856 | |
| Q4 | 10,071 | 9,262 | 842 | 10,796 | 10,033 | 810 | |
| 2011 | |||||||
| Q1 | 11,135 | 10,386 | 755 | 10,735 | 9,942 | 792 | |
| Q2 | 11,351 | 10,624 | 726 | 10,472 | 9,675 | 755 | |
| Q3 | 10,356 | 9,633 | 734 | 10,886 | 10,244 | 702 | |
| Q4 | 10,486 | 9,790 | 700 | 11,371 | 10,735 | 670 | |
| 2012 | |||||||
| Q1 | 11,373 | 10,723 | 630 | 10,818 | 10,102 | 669 | |
| Q2 | 11,906 | 11,228 | 656 | 11,043 | 10,324 | 682 | |
| Q3 | 9,775 | 9,080 | 710 | 10,257 | 9,616 | 675 | |
| Q4 | 9,253 | 8,536 | 744 | 10,109 | 9,433 | 708 | |
| 2013 | |||||||
| Q1 | 11,224 | 10,556 | 668 | 10,659 | 9,922 | 717 | |
| Q2 | 11,147 | 10,424 | 723 | 10,314 | 9,577 | 751 | |
| Q3 | 10,083 | 9,250 | 834 | 10,555 | 9,764 | 790 | |
| Q4 | 9,251 | 8,411 | 840 | 10,181 | 9,365 | 797 | |
| 2014 | |||||||
| Q1 | 10,666 | 9,934 | 733 | 10,293 | 9,514 | 793 | |
| Q2 | 11,868 | 11,076 | 792 | 10,782 | 9,964 | 821 | |
| Q3 | 10,281 | 9,387 | 895 | 10,731 | 9,879 | 845 | |
| Percentage change on corresponding period of previous year | Percentage change on previous quarter | ||||||
| 2008 | |||||||
| Q1 | -3.4 | -3.9 | -2.2 | -6.3 | -7.4 | 3.6 | |
| Q2 | 0.5 | 1.0 | -2.0 | -0.1 | 1.4 | -4.2 | |
| Q3 | -4.2 | -3.7 | -4.5 | -0.1 | -0.2 | -4.9 | |
| Q4 | -17.9 | -19.4 | -14.2 | -10.7 | -12.4 | -9.0 | |
| 2009 | |||||||
| Q1 | -7.7 | -2.3 | -25.2 | 3.7 | 10.4 | -9.1 | |
| Q2 | -9.2 | -4.7 | -27.2 | -3.2 | -2.5 | -7.4 | |
| Q3 | -16.0 | -11.2 | -29.5 | -6.2 | -6.3 | -8.3 | |
| Q4 | -10.3 | -4.1 | -27.5 | -3.2 | -3.4 | -6.4 | |
| 2010 | |||||||
| Q1 | -1.8 | 1.7 | -34.5 | 10.3 | 13.3 | -16.7 | |
| Q2 | -3.6 | -2.4 | -26.7 | -3.8 | -4.5 | 2.3 | |
| Q3 | 2.5 | 6.4 | -21.8 | -0.1 | 1.4 | -2.3 | |
| Q4 | 8.9 | 12.9 | -20.7 | 4.0 | 4.2 | -5.4 | |
| 2011 | |||||||
| Q1 | -1.9 | -1.5 | -8.9 | -0.6 | -0.9 | -2.2 | |
| Q2 | 3.3 | 4.4 | -13.5 | -2.4 | -2.7 | -4.7 | |
| Q3 | 4.8 | 6.7 | -17.6 | 3.9 | 5.9 | -7.1 | |
| Q4 | 4.1 | 5.7 | -16.8 | 4.5 | 4.8 | -4.5 | |
| 2012 | |||||||
| Q1 | 2.1 | 3.2 | -16.6 | -4.9 | -5.9 | -0.2 | |
| Q2 | 4.9 | 5.7 | -9.6 | 2.1 | 2.2 | 2.0 | |
| Q3 | -5.6 | -5.7 | -3.3 | -7.1 | -6.9 | -1.0 | |
| Q4 | -11.8 | -12.8 | 6.2 | -1.4 | -1.9 | 4.8 | |
| 2013 | |||||||
| Q1 | -1.3 | -1.6 | 6.1 | 5.4 | 5.2 | 1.2 | |
| Q2 | -6.4 | -7.2 | 10.1 | -3.2 | -3.5 | 4.8 | |
| Q3 | 3.2 | 1.9 | 17.4 | 2.3 | 2.0 | 5.2 | |
| Q4 | -0.0 | -1.5 | 13.0 | -3.5 | -4.1 | 0.9 | |
| 2014 | |||||||
| Q1 | -5.0 | -5.9 | 9.6 | 1.1 | 1.6 | -0.4 | |
| Q2 | 6.5 | 6.3 | 9.5 | 4.7 | 4.7 | 3.5 | |
| Q3 | 2.0 | 1.5 | 7.3 | -0.5 | -0.9 | 3.0 | |
| Annex 3A Total Domestic Demand at Current Market Prices & Constant Prices (Chain linked annually and referenced to year 2012) -Non Seasonally Adjusted | |||||||||||||
| € million | |||||||||||||
| CURRENT MARKET PRICES | CONSTANT MARKET PRICES | ||||||||||||
| Period | Personal consumption of goods and services | Net exp. by central and local government on current goods and services | Gross domestic fixed capital formation | Final Domestic Demand | Value of physical changes in stocks | Total Domestic Demand | Personal consumption of goods and services | Net exp. by central and local government on current goods and services | Gross domestic fixed capital formation | Final Domestic Demand | Value of physical changes in stocks | Total Domestic Demand | |
| 2008 | 94,712 | 30,775 | 45,221 | 170,707 | -330 | 170,377 | 88,404 | 30,215 | 40,535 | 159,643 | -328 | 159,194 | |
| 2009 | 83,565 | 29,650 | 33,082 | 146,297 | -1,490 | 144,807 | 83,646 | 29,151 | 32,225 | 145,191 | -1,471 | 143,689 | |
| 2010 | 82,447 | 26,437 | 26,106 | 134,990 | -569 | 134,421 | 84,413 | 27,069 | 26,418 | 137,934 | -577 | 137,340 | |
| 2011 | 82,969 | 26,111 | 24,841 | 133,921 | 780 | 134,701 | 83,434 | 26,490 | 25,650 | 135,604 | 782 | 136,390 | |
| 2012 | 82,467 | 25,922 | 26,923 | 135,312 | 288 | 135,600 | 82,467 | 25,922 | 26,923 | 135,312 | 288 | 135,600 | |
| 2013 | 83,334 | 25,956 | 26,541 | 135,831 | 837 | 136,668 | 81,797 | 26,273 | 26,275 | 134,345 | 861 | 135,206 | |
| 2008 | |||||||||||||
| Q1 | 23,806 | 7,549 | 13,930 | 45,285 | -390 | 44,895 | 22,359 | 7,477 | 12,248 | 42,416 | -596 | 41,985 | |
| Q2 | 23,107 | 7,628 | 10,835 | 41,571 | 529 | 42,099 | 21,548 | 7,485 | 9,699 | 38,821 | 818 | 39,263 | |
| Q3 | 23,254 | 7,635 | 11,093 | 41,982 | -27 | 41,955 | 21,711 | 7,449 | 10,037 | 39,368 | 80 | 39,356 | |
| Q4 | 24,544 | 7,961 | 9,363 | 41,869 | -442 | 41,427 | 22,786 | 7,803 | 8,551 | 39,037 | -630 | 38,590 | |
| 94,712 | 30,775 | 45,221 | 170,707 | -330 | 170,377 | 88,404 | 30,215 | 40,535 | 159,643 | -328 | 159,194 | ||
| 2009 | |||||||||||||
| Q1 | 21,044 | 7,780 | 9,295 | 38,120 | -568 | 37,550 | 20,771 | 7,467 | 8,833 | 37,312 | -571 | 36,746 | |
| Q2 | 20,429 | 7,208 | 8,449 | 36,087 | 14 | 36,101 | 20,452 | 7,339 | 8,113 | 35,705 | 80 | 35,748 | |
| Q3 | 20,213 | 7,206 | 7,082 | 34,501 | -430 | 34,071 | 20,430 | 7,026 | 7,084 | 34,608 | -486 | 34,124 | |
| Q4 | 21,879 | 7,455 | 8,256 | 37,590 | -505 | 37,084 | 21,993 | 7,319 | 8,195 | 37,566 | -494 | 37,071 | |
| 83,565 | 29,650 | 33,082 | 146,297 | -1,490 | 144,807 | 83,646 | 29,151 | 32,225 | 145,191 | -1,471 | 143,689 | ||
| 2010 | |||||||||||||
| Q1 | 20,219 | 6,697 | 6,884 | 33,800 | -527 | 33,272 | 20,789 | 6,801 | 6,887 | 34,551 | -553 | 33,997 | |
| Q2 | 20,136 | 6,486 | 6,829 | 33,450 | -106 | 33,344 | 20,670 | 6,848 | 6,909 | 34,237 | -67 | 34,165 | |
| Q3 | 20,314 | 6,430 | 5,787 | 32,530 | 353 | 32,883 | 20,847 | 6,580 | 5,995 | 33,423 | 348 | 33,763 | |
| Q4 | 21,778 | 6,825 | 6,607 | 35,210 | -288 | 34,922 | 22,107 | 6,839 | 6,626 | 35,723 | -305 | 35,415 | |
| 82,447 | 26,437 | 26,106 | 134,990 | -569 | 134,421 | 84,413 | 27,069 | 26,418 | 137,934 | -577 | 137,340 | ||
| 2011 | |||||||||||||
| Q1 | 20,393 | 6,513 | 6,665 | 33,570 | -317 | 33,253 | 20,699 | 6,762 | 6,875 | 34,194 | -366 | 33,816 | |
| Q2 | 20,302 | 6,505 | 6,476 | 33,282 | 403 | 33,685 | 20,491 | 6,680 | 6,657 | 33,758 | 358 | 34,121 | |
| Q3 | 20,075 | 6,560 | 5,404 | 32,039 | 599 | 32,638 | 20,228 | 6,511 | 5,557 | 32,440 | 632 | 33,082 | |
| Q4 | 22,199 | 6,534 | 6,296 | 35,029 | 95 | 35,124 | 22,016 | 6,537 | 6,561 | 35,212 | 158 | 35,370 | |
| 82,969 | 26,111 | 24,841 | 133,921 | 780 | 134,701 | 83,434 | 26,490 | 25,650 | 135,604 | 782 | 136,390 | ||
| 2012 | |||||||||||||
| Q1 | 19,895 | 6,602 | 6,776 | 33,272 | -577 | 32,695 | 20,034 | 6,602 | 6,955 | 33,583 | -612 | 32,962 | |
| Q2 | 19,906 | 6,430 | 5,684 | 32,020 | 549 | 32,568 | 19,986 | 6,430 | 5,656 | 32,088 | 537 | 32,631 | |
| Q3 | 20,345 | 6,511 | 5,690 | 32,546 | 290 | 32,835 | 20,412 | 6,511 | 5,601 | 32,544 | 289 | 32,836 | |
| Q4 | 22,322 | 6,380 | 8,773 | 37,475 | 27 | 37,502 | 22,035 | 6,380 | 8,712 | 37,098 | 73 | 37,172 | |
| 82,467 | 25,922 | 26,923 | 135,312 | 288 | 135,600 | 82,467 | 25,922 | 26,923 | 135,312 | 288 | 135,600 | ||
| 2013 | |||||||||||||
| Q1 | 20,089 | 6,431 | 6,610 | 33,130 | 409 | 33,539 | 19,873 | 6,447 | 6,673 | 32,993 | 499 | 33,493 | |
| Q2 | 20,037 | 6,459 | 5,830 | 32,326 | 240 | 32,565 | 19,745 | 6,297 | 5,764 | 31,806 | 287 | 32,093 | |
| Q3 | 20,623 | 6,475 | 6,235 | 33,333 | 798 | 34,131 | 20,269 | 6,699 | 6,115 | 33,083 | 787 | 33,870 | |
| Q4 | 22,586 | 6,591 | 7,866 | 37,043 | -610 | 36,433 | 21,910 | 6,830 | 7,723 | 36,462 | -713 | 35,750 | |
| 83,334 | 25,956 | 26,541 | 135,831 | 837 | 136,668 | 81,797 | 26,273 | 26,275 | 134,345 | 861 | 135,206 | ||
| 2014 | |||||||||||||
| Q1 | 20,557 | 6,365 | 7,135 | 34,058 | 493 | 34,551 | 20,003 | 6,636 | 7,050 | 33,689 | 514 | 34,203 | |
| Q2 | 20,630 | 6,396 | 7,109 | 34,135 | 85 | 34,220 | 19,982 | 6,667 | 6,871 | 33,519 | 74 | 33,593 | |
| Q3 | 20,949 | 6,480 | 6,834 | 34,263 | 533 | 34,796 | 20,278 | 6,608 | 6,592 | 33,479 | 351 | 33,829 | |
| Percentage change on corresponding period of previous year | Percentage change on corresponding period of previous year | ||||||||||||
| 2008 | |||||||||||||
| Q1 | 6.4 | 6.3 | -11.4 | 0.2 | -0.8 | 3.6 | 1.5 | -4.7 | 0.3 | -0.6 | |||
| Q2 | 1.9 | 6.4 | -18.6 | -3.7 | -3.3 | -0.2 | 2.2 | -10.6 | -3.0 | -2.7 | |||
| Q3 | 1.1 | 3.6 | -9.1 | -1.4 | -0.3 | -0.3 | -1.2 | -1.2 | -0.6 | 0.8 | |||
| Q4 | -2.1 | 4.5 | -28.5 | -8.5 | -11.6 | -2.7 | -0.2 | -22.2 | -7.9 | -11.0 | |||
| 2009 | |||||||||||||
| Q1 | -11.6 | 3.1 | -33.3 | -15.8 | -16.4 | -7.1 | -0.1 | -27.9 | -12.0 | -12.5 | |||
| Q2 | -11.6 | -5.5 | -22.0 | -13.2 | -14.2 | -5.1 | -1.9 | -16.4 | -8.0 | -9.0 | |||
| Q3 | -13.1 | -5.6 | -36.2 | -17.8 | -18.8 | -5.9 | -5.7 | -29.4 | -12.1 | -13.3 | |||
| Q4 | -10.9 | -6.4 | -11.8 | -10.2 | -10.5 | -3.5 | -6.2 | -4.2 | -3.8 | -3.9 | |||
| 2010 | |||||||||||||
| Q1 | -3.9 | -13.9 | -25.9 | -11.3 | -11.4 | 0.1 | -8.9 | -22.0 | -7.4 | -7.5 | |||
| Q2 | -1.4 | -10.0 | -19.2 | -7.3 | -7.6 | 1.1 | -6.7 | -14.8 | -4.1 | -4.4 | |||
| Q3 | 0.5 | -10.8 | -18.3 | -5.7 | -3.5 | 2.0 | -6.3 | -15.4 | -3.4 | -1.1 | |||
| Q4 | -0.5 | -8.5 | -20.0 | -6.3 | -5.8 | 0.5 | -6.6 | -19.1 | -4.9 | -4.5 | |||
| 2011 | |||||||||||||
| Q1 | 0.9 | -2.7 | -3.2 | -0.7 | -0.1 | -0.4 | -0.6 | -0.2 | -1.0 | -0.5 | |||
| Q2 | 0.8 | 0.3 | -5.2 | -0.5 | 1.0 | -0.9 | -2.5 | -3.6 | -1.4 | -0.1 | |||
| Q3 | -1.2 | 2.0 | -6.6 | -1.5 | -0.7 | -3.0 | -1.1 | -7.3 | -2.9 | -2.0 | |||
| Q4 | 1.9 | -4.3 | -4.7 | -0.5 | 0.6 | -0.4 | -4.4 | -1.0 | -1.4 | -0.1 | |||
| 2012 | |||||||||||||
| Q1 | -2.4 | 1.4 | 1.7 | -0.9 | -1.7 | -3.2 | -2.4 | 1.2 | -1.8 | -2.5 | |||
| Q2 | -1.9 | -1.2 | -12.2 | -3.8 | -3.3 | -2.5 | -3.8 | -15.0 | -4.9 | -4.4 | |||
| Q3 | 1.3 | -0.7 | 5.3 | 1.6 | 0.6 | 0.9 | -0.0 | 0.8 | 0.3 | -0.7 | |||
| Q4 | 0.6 | -2.3 | 39.3 | 7.0 | 6.8 | 0.1 | -2.4 | 32.8 | 5.4 | 5.1 | |||
| 2013 | |||||||||||||
| Q1 | 1.0 | -2.6 | -2.5 | -0.4 | 2.6 | -0.8 | -2.3 | -4.1 | -1.8 | 1.6 | |||
| Q2 | 0.7 | 0.5 | 2.6 | 1.0 | -0.0 | -1.2 | -2.1 | 1.9 | -0.9 | -1.6 | |||
| Q3 | 1.4 | -0.5 | 9.6 | 2.4 | 3.9 | -0.7 | 2.9 | 9.2 | 1.7 | 3.2 | |||
| Q4 | 1.2 | 3.3 | -10.3 | -1.2 | -2.8 | -0.6 | 7.0 | -11.4 | -1.7 | -3.8 | |||
| 2014 | |||||||||||||
| Q1 | 2.3 | -1.0 | 7.9 | 2.8 | 3.0 | 0.7 | 2.9 | 5.6 | 2.1 | 2.1 | |||
| Q2 | 3.0 | -1.0 | 21.9 | 5.6 | 5.1 | 1.2 | 5.9 | 19.2 | 5.4 | 4.7 | |||
| Q3 | 1.6 | 0.1 | 9.6 | 2.8 | 2.0 | 0.0 | -1.4 | 7.8 | 1.2 | -0.1 | |||
| Annex 3B Total Domestic Demand at Current Market Prices & Constant Prices (Chain linked annually and referenced to year 2012) -Seasonally Adjusted | |||||||||||||
| € million | |||||||||||||
| CURRENT MARKET PRICES | CONSTANT MARKET PRICES | ||||||||||||
| Period | Personal comsumption of goods and services | Net exp. by central and local government on current goods and services | Gross domestic fixed capital formation | Final Domestic Demand | Value of physical changes in stock | Total Domestic Demand | Personal Personal comsumption of goods and services | Net exp. by central and local government on current goods and services | Gross domestic fixed capital formation | Final Domestic Demand | Value of physical changes in stock | Total Domestic Demand | |
| 2008 | |||||||||||||
| Q1 | 23,931 | 7,580 | 13,142 | 44,846 | -304 | 44,745 | 22,485 | 7,562 | 11,381 | 41,931 | -516 | 41,594 | |
| Q2 | 23,693 | 7,722 | 10,948 | 42,451 | 199 | 42,854 | 22,036 | 7,544 | 9,919 | 39,781 | 342 | 39,976 | |
| Q3 | 23,798 | 7,690 | 11,964 | 43,211 | 150 | 43,605 | 22,129 | 7,532 | 10,810 | 40,625 | 391 | 40,864 | |
| Q4 | 23,254 | 7,796 | 9,121 | 40,167 | -414 | 39,239 | 21,697 | 7,596 | 8,391 | 37,334 | -596 | 36,807 | |
| 2009 | |||||||||||||
| Q1 | 21,278 | 7,796 | 8,796 | 37,957 | -392 | 37,712 | 21,017 | 7,528 | 8,228 | 37,046 | -384 | 36,687 | |
| Q2 | 20,920 | 7,288 | 8,515 | 36,788 | -279 | 36,698 | 20,913 | 7,368 | 8,262 | 36,515 | -325 | 36,311 | |
| Q3 | 20,664 | 7,264 | 7,719 | 35,576 | -443 | 35,297 | 20,832 | 7,139 | 7,715 | 35,778 | -424 | 35,312 | |
| Q4 | 20,652 | 7,312 | 7,953 | 35,836 | -396 | 35,033 | 20,817 | 7,141 | 7,956 | 35,760 | -362 | 35,289 | |
| 2010 | |||||||||||||
| Q1 | 20,469 | 6,700 | 6,533 | 33,728 | -312 | 33,494 | 21,067 | 6,853 | 6,410 | 34,345 | -346 | 34,005 | |
| Q2 | 20,702 | 6,559 | 6,889 | 34,209 | -343 | 34,005 | 21,207 | 6,845 | 7,060 | 35,115 | -362 | 34,828 | |
| Q3 | 20,747 | 6,472 | 6,373 | 33,599 | 192 | 33,966 | 21,223 | 6,687 | 6,612 | 34,571 | 228 | 34,821 | |
| Q4 | 20,467 | 6,710 | 6,249 | 33,325 | -103 | 32,929 | 20,853 | 6,718 | 6,311 | 33,833 | -100 | 33,649 | |
| 2011 | |||||||||||||
| Q1 | 20,851 | 6,521 | 6,375 | 33,826 | -107 | 33,773 | 21,159 | 6,743 | 6,476 | 34,285 | -155 | 34,171 | |
| Q2 | 20,786 | 6,571 | 6,580 | 33,944 | 223 | 34,227 | 20,951 | 6,720 | 6,815 | 34,529 | 128 | 34,629 | |
| Q3 | 20,475 | 6,587 | 5,953 | 33,070 | 335 | 33,586 | 20,570 | 6,585 | 6,144 | 33,498 | 408 | 33,968 | |
| Q4 | 20,784 | 6,434 | 5,875 | 32,987 | 358 | 33,115 | 20,702 | 6,462 | 6,149 | 33,231 | 427 | 33,607 | |
| 2012 | |||||||||||||
| Q1 | 20,326 | 6,615 | 6,515 | 33,514 | -435 | 33,086 | 20,464 | 6,576 | 6,563 | 33,654 | -494 | 33,168 | |
| Q2 | 20,503 | 6,495 | 5,838 | 32,861 | 440 | 33,320 | 20,563 | 6,471 | 5,873 | 33,017 | 408 | 33,379 | |
| Q3 | 20,729 | 6,517 | 6,252 | 33,559 | -28 | 33,707 | 20,726 | 6,554 | 6,194 | 33,542 | 26 | 33,617 | |
| Q4 | 20,830 | 6,296 | 8,090 | 35,162 | 346 | 35,350 | 20,673 | 6,317 | 8,049 | 34,914 | 379 | 35,316 | |
| 2013 | |||||||||||||
| Q1 | 20,545 | 6,453 | 6,378 | 33,392 | 475 | 33,851 | 20,307 | 6,439 | 6,311 | 33,081 | 529 | 33,605 | |
| Q2 | 20,710 | 6,522 | 6,068 | 33,320 | 186 | 33,488 | 20,391 | 6,331 | 6,079 | 32,867 | 223 | 33,014 | |
| Q3 | 20,985 | 6,466 | 6,795 | 34,301 | 459 | 34,976 | 20,551 | 6,736 | 6,717 | 34,032 | 519 | 34,599 | |
| Q4 | 21,032 | 6,512 | 7,216 | 34,690 | -246 | 34,322 | 20,517 | 6,748 | 7,080 | 34,245 | -369 | 33,967 | |
| 2014 | |||||||||||||
| Q1 | 21,179 | 6,403 | 6,899 | 34,651 | 493 | 35,123 | 20,577 | 6,636 | 6,730 | 34,076 | 483 | 34,568 | |
| Q2 | 21,232 | 6,446 | 7,464 | 35,402 | 65 | 35,419 | 20,541 | 6,710 | 7,267 | 34,883 | 28 | 34,754 | |
| Q3 | 21,299 | 6,463 | 7,410 | 35,324 | 191 | 35,893 | 20,536 | 6,651 | 7,210 | 34,501 | 92 | 34,868 | |
| Percentage change on previous quarter | Percentage change on previous quarter | ||||||||||||
| 2008 | |||||||||||||
| Q1 | 0.4 | 1.8 | 1.9 | 1.6 | 0.3 | 0.3 | -0.5 | 4.5 | 3.0 | 0.2 | |||
| Q2 | -1.0 | 1.9 | -16.7 | -5.3 | -4.2 | -2.0 | -0.2 | -12.8 | -5.1 | -3.9 | |||
| Q3 | 0.4 | -0.4 | 9.3 | 1.8 | 1.8 | 0.4 | -0.2 | 9.0 | 2.1 | 2.2 | |||
| Q4 | -2.3 | 1.4 | -23.8 | -7.0 | -10.0 | -2.0 | 0.9 | -22.4 | -8.1 | -9.9 | |||
| 2009 | |||||||||||||
| Q1 | -8.5 | -0.0 | -3.6 | -5.5 | -3.9 | -3.1 | -0.9 | -1.9 | -0.8 | -0.3 | |||
| Q2 | -1.7 | -6.5 | -3.2 | -3.1 | -2.7 | -0.5 | -2.1 | 0.4 | -1.4 | -1.0 | |||
| Q3 | -1.2 | -0.3 | -9.4 | -3.3 | -3.8 | -0.4 | -3.1 | -6.6 | -2.0 | -2.8 | |||
| Q4 | -0.1 | 0.7 | 3.0 | 0.7 | -0.7 | -0.1 | 0.0 | 3.1 | -0.1 | -0.1 | |||
| 2010 | |||||||||||||
| Q1 | -0.9 | -8.4 | -17.9 | -5.9 | -4.4 | 1.2 | -4.0 | -19.4 | -4.0 | -3.6 | |||
| Q2 | 1.1 | -2.1 | 5.4 | 1.4 | 1.5 | 0.7 | -0.1 | 10.1 | 2.2 | 2.4 | |||
| Q3 | 0.2 | -1.3 | -7.5 | -1.8 | -0.1 | 0.1 | -2.3 | -6.3 | -1.6 | -0.0 | |||
| Q4 | -1.4 | 3.7 | -2.0 | -0.8 | -3.1 | -1.7 | 0.5 | -4.6 | -2.1 | -3.4 | |||
| 2011 | |||||||||||||
| Q1 | 1.9 | -2.8 | 2.0 | 1.5 | 2.6 | 1.5 | 0.4 | 2.6 | 1.3 | 1.6 | |||
| Q2 | -0.3 | 0.8 | 3.2 | 0.3 | 1.3 | -1.0 | -0.3 | 5.2 | 0.7 | 1.3 | |||
| Q3 | -1.5 | 0.2 | -9.5 | -2.6 | -1.9 | -1.8 | -2.0 | -9.8 | -3.0 | -1.9 | |||
| Q4 | 1.5 | -2.3 | -1.3 | -0.3 | -1.4 | 0.6 | -1.9 | 0.1 | -0.8 | -1.1 | |||
| 2012 | |||||||||||||
| Q1 | -2.2 | 2.8 | 10.9 | 1.6 | -0.1 | -1.1 | 1.8 | 6.7 | 1.3 | -1.3 | |||
| Q2 | 0.9 | -1.8 | -10.4 | -1.9 | 0.7 | 0.5 | -1.6 | -10.5 | -1.9 | 0.6 | |||
| Q3 | 1.1 | 0.3 | 7.1 | 2.1 | 1.2 | 0.8 | 1.3 | 5.5 | 1.6 | 0.7 | |||
| Q4 | 0.5 | -3.4 | 29.4 | 4.8 | 4.9 | -0.3 | -3.6 | 30.0 | 4.1 | 5.1 | |||
| 2013 | |||||||||||||
| Q1 | -1.4 | 2.5 | -21.2 | -5.0 | -4.2 | -1.8 | 1.9 | -21.6 | -5.2 | -4.8 | |||
| Q2 | 0.8 | 1.1 | -4.9 | -0.2 | -1.1 | 0.4 | -1.7 | -3.7 | -0.6 | -1.8 | |||
| Q3 | 1.3 | -0.9 | 12.0 | 2.9 | 4.4 | 0.8 | 6.4 | 10.5 | 3.5 | 4.8 | |||
| Q4 | 0.2 | 0.7 | 6.2 | 1.1 | -1.9 | -0.2 | 0.2 | 5.4 | 0.6 | -1.8 | |||
| 2014 | |||||||||||||
| Q1 | 0.7 | -1.7 | -4.4 | -0.1 | 2.3 | 0.3 | -1.7 | -4.9 | -0.5 | 1.8 | |||
| Q2 | 0.2 | 0.7 | 8.2 | 2.2 | 0.8 | -0.2 | 1.1 | 8.0 | 2.4 | 0.5 | |||
| Q3 | 0.3 | 0.3 | -0.7 | -0.2 | 1.3 | -0.0 | -0.9 | -0.8 | -1.1 | 0.3 | |||
Introduction
This release gives the official quarterly national accounts estimates for Ireland. It provides the first set of results for Q3 of 2014.
National accounts are compiled in the EU according to the European System of National and Regional Accounts (ESA) framework. In 2014, the new ESA 2010 framework will replace the current ESA 95 version and all EU member states are required to adopt ESA 2010 by September 2014. ESA 2010 is the European version of the current UN mandated international standards for national accounts statistics, the System of National Accounts (SNA) 2008. The results for all years in this release are published on an ESA 2010 basis. For Ireland, the ESA 2010 change with the greatest impact on gross domestic product (GDP) is the new treatment of research and development (R&D) expenditure. Under ESA95, R&D expenditure was treated as an ancillary cost to the main production of an enterprise, while under ESA2010, R&D expenditure is recognised as capital investment.
In addition to the ESA 2010 changes, the results include additional estimates for illegal economic activities in line with the requirement from the European statistical agency, Eurostat to include such estimates in the National Accounts before September 2014.
The aggregates shown have been derived from a wide variety of sources. As some of the available sources are of lesser reliability than those used for the annual national accounts, the quarterly estimates given in this release have a higher margin of error than the annual figures.
Revisions
Minor revisions have been made to the previously published figures for 2014.
In compliance with EU regulations the Nace Rev. 2 classification system is used in tables 1, 4 and Annex 2. (The national classification system that was used up to and including the Q4 2011 QNA results that were published in March 2012 was replaced with the Nace Rev. 2 classification system in the Q1 2012 results published in July 2012).
The results for the economy are shown for five sectors. The contents of the sectors conform to the Nace Rev. 2 system. The “Publishing” industry is classified in the sector “Distribution, transport, software and communication”. In addition, enterprises in the Hotels and catering sector are also classified to this sector. The “Software” industry is also part of the “Distribution transport, software and communications” category in the NACE rev 2 classification.
In tables 1 and 4 the following is the correspondence with the relevant sections of Nace Rev. 2:
| Agriculture, forestry and fishing | Section A |
| Industry | Sections B to F |
| Distribution, transport, software & communications | Sections G to J |
| Public Administration and Defence | Section O |
| Other Services |
Sections K to N and P to U |
For further information on the Nace Rev. 2 classification of industrial activity, visit the CSO website:
http://www.cso.ie/en/surveysandmethodology/classifications/classificationofindustrialactivity.
For the annual accounts, GDP at current prices is calculated using two independent approaches i.e. the income and expenditure methods. On a quarterly basis, it is not possible to compile a reliable income based estimate. The estimates in current prices are on the expenditure basis only and these are supplied in Table 2. The balancing item (i.e. the statistical discrepancy) which is required to adjust the expenditure based estimate to the definitive measure of GDP (the average of income and expenditure) has been projected forward into 2014 in line with the trend in the aggregate of all the other expenditure items
At constant prices, two measures (output and expenditure) are used. These measures are now being produced using annual chain linked indices. On the output side, for each quarter, the volume growth measures at a detailed level are weighted together using value added weights of the previous year.
Similarly, on the expenditure side, the growth estimates are weighted by expenditure weights of the previous year. The average of the two measures is the growth measure used. The change over a period of years is then calculated by linking together the annual changes. The estimates in this release are referenced to 2012 values. A consequence of this method is that the individual components of GDP at reference year values do not add to the total.
Gross Domestic Product (GDP) represents the total value added (output) in the production of goods and services in the country.
Net factor income from the rest of the world (NFI) is the difference between investment income (interest, profits etc.) and labour income earned abroad by Irish resident persons and companies (inflows) and similar incomes earned in Ireland by non-residents (outflows). The data are taken from the Balance of Payments statistics that are based on the new BPM6 framework introduced in the Q1 2014 Balance of Payments release. (BPM6 is consistent with ESA 2010:for further details please refer to Q1 2014 Balance of Payments release) The components of interest flows involving banks in the Net factor income item in the national accounts are constructed on the basis of “pure” interest rates (that is exclusive of FISIM).Under BPM5 based Balance of Payments data released previously, this FISIM adjustment was not carried out. However, under the new BPM6 framework,FISIM is now being treated as part of financial services,rather than income,bringing it into line with the treatment of FISIM in national accounts statistics. The deflator used to generate the constant price figures is based on the implied quarterly price index for the exports of goods and services. In some years exceptional income payments have had to be deflated individually.
Gross National Product (GNP) is the sum of GDP and NFI. Because NFI is the difference between two large gross flows, its magnitude can fluctuate greatly from one quarter to another. This can lead to significant differences between the GDP and GNP growth rate for the same quarter.
Methodology Table 1: Output Measure
The estimation procedures are similar to those used for the annual accounts whenever possible. However, in a number of cases the annual methodology cannot be followed due to the lack of relevant data.
The estimate for Agriculture is calculated by using the available sub-annual information for exports and slaughterings of animals, milk deliveries, stock changes (six-monthly), fertiliser and feeding stuffs usage etc. For some items, annual figures are distributed equally across the quarters. Monthly sea fish landings are used to estimate the quarterly output of fishing.
The gross value added of manufacturing industy is calculated by applying monthly volume of production indices to the previous year's quarterly gross value added, including royalties. Royalties are separately deflated using the export price index and then deducted.
Changes in the volume of investment in construction projects are used to estimate the output of the building and construction sector.
For distribution the methods used are similar to those used for the annual calculation. They rely heavily on the retail sales indices and other CSO services inquiries. In the case of transport, most of the output measures used for the annual calculations are available on a quarterly basis.
For communications the main data sources are direct inquiries to the suppliers, with additional data and trend estimation for some residual components.
The quarterly estimate of value added for public administration and defence has been calculated based on the employment trends in the public sector.
The Other Services category covers a variety of service activities, some of which are surveyed on a quarterly basis by the CSO. For some services, information on outputs is not directly available on a quarterly basis. In most of these cases, quarterly estimates are derived using trends in related indicators. In a small number of residual cases, annual estimates are distributed equally across the quarters.
Taxes and subsidies are deflated at a detailed level using appropriate price indices. Value added taxes and excise duties have been accrued and recorded in the period in which the underlying expenditure took place.
The value of net income flows with the rest of the world in the Quarterly National Accounts release is generally consistent with the published Balance of Payments statistics except for the FISIM adjustment (see the definition of this item above).
The various components of the expenditure based measure of GDP are defined in the annual National Income and Expenditure publication. The methods used for the quarterly series are similar to those used for the annual where possible but in many cases alternative methods have been applied.
Personal Consumption Expenditure is estimated using CSO data, such as the Retail Sales Indices together with some direct inquiries. Administrative data sources are used for some goods such as fuel and power products and motor vehicles. Constant price estimates are obtained using components of the Consumer Price Index (CPI).
Net Expenditure by Central and Local Government at current market prices is estimated using Government records. From Q2 of 2009 it is calculated net of the public sector pension levy introduced in March 2009. The constant price estimates of remuneration are derived by extrapolating base year estimates using an index of employment or using appropriate deflators for wages and are unaffected by the pension levy which is treated as a reduction in wage rates. Expenditure on goods and services is deflated partly by consumer price indices and partly by wholesale price indices.
Gross Domestic Fixed Capital Formation at current market prices includes expenditure on building and construction work and machinery and equipment. The quarterly estimates of dwellings are based on data from the Department of Environment’s (DoE) Quarterly Housing Bulletin. Information on other building and construction is based on the CSO’s quarterly index of production in Building and Construction. Quarterly estimates of commercial vehicles used in the business sector are estimated using administrative data. Estimates of other machinery and equipment and R&D (included under ESA 2010 standards) are made by reference to import statistics and the CSO Quarterly Capital Assets in Industry Inquiry. Current estimates are deflated to prices of the previousyear using appropriate price indices such as components of the Wholesale Price Index (WPI) and indices for construction activity year using appropriate price indices such as components of the Wholesale Price Index (WPI) and indices for construction activity.
Value of Physical Changes in Stocks at current pricescovers stock changes in the agricultural, industrial and distribution sectors and in intervention stocks. This item measures the actual value change in stocks between the beginning and end of quarter adjusted for any changes in the prices of the underlying commodities. Data on industrial and distribution stocks are taken from published and unpublished components of the CSO Quarterly Stocks Inquiry. Agricultural stocks are estimated from the results of CSO’s agricultural enumerations and statistics on animal slaughterings, etc. Constant price estimates are calculated by deflating the current estimates using relevant price indices and price data on agricultural and intervention stocks. Some adjustments have been made to the stocks values to improve the coherence of the quarterly accounts. These are judgmental adjustments to allow for within-year timing differences between the output and expenditure measures. Over a calendar year, these adjustments are neutral.
Exports and Imports of Goods and Services at current prices are taken from the CSO Balance of Payments series. An adjustment is made for FISIM (see the definition of “net factor income from the rest of the world” page 12) Current price estimates are converted to previous year prices using the available price indices, including export and import unit value indices.
A very significant fall in the pattern of distributive type trade with Great Britain in Electrical machinery and parts in 2002 has a very large influence on year-on-year comparisons of both exports and imports for 2003 and the latter part of 2002. While the comparisons of gross flows are considerably influenced, the net balance of trade is not significantly affected.
Seasonal adjustment is conducted using the direct seasonal adjustment approach. Under this approach each individual time series is independently adjusted, i.e. aggregate series are adjusted without reference to the component series. This direct approach is applied to GDP and GNP and the seasonally adjusted GDP and GNP are not derived as the sum of the seasonally adjusted components (such as Personal Consumption, Exports etc.) but rather by seasonally adjusting the unadjusted values of GDP and GNP as shown in Tables 1 - 3. On this account, and also because of the statistical discrepancy in the original series, the sum of the seasonally adjusted components of GDP and GNP do not add to the respective seasonally adjusted series. As part of the seasonal adjustment process, ARIMA models are identified for each series based on unadjusted data spanning Q1 1997 to Q1 2014. These models are then applied to the entire series (Q1 1997 to Q3 2014). Seasonal factors and the parameters of the ARIMA models are updated each quarter.
The adjustments are completed by applying the X-12-ARIMA model, developed by the U.S. Census Bureau to the unadjusted data. This methodology estimates seasonal factors while also taking into consideration factors that impact on the quality of the seasonal adjustment such as, for example:
• Calendar effects, e.g. the timing of Easter
• Outliers, temporary changes and level shifts in the series
For additional information on the use of X-12-ARIMA see (Findley, D.F., B.C. Monsell, W.R. Bell, M.C. Otto, and B. Chen (1998), “New Capabilities and Methods of the X-12-Arima Seasonal Adjustment Program”, Journal of Business & Economic Statistics, 16, pp. 127-177.)
 Hide Background Notes
Scan the QR code below to view this release online or go to
http://www.cso.ie/en/releasesandpublications/er/na/quarterlynationalaccountsquarter32014/
 Show Table 1 Gross Domestic Product by Sector of Origin and Gross National Product at Constant Market Prices
(Chain linked annually and referenced to year 2012)
Show Table 1 Gross Domestic Product by Sector of Origin and Gross National Product at Constant Market Prices
(Chain linked annually and referenced to year 2012) Hide Table 1 Gross Domestic Product by Sector of Origin and Gross National Product at Constant Market Prices
(Chain linked annually and referenced to year 2012)
Hide Table 1 Gross Domestic Product by Sector of Origin and Gross National Product at Constant Market Prices
(Chain linked annually and referenced to year 2012)