
| Live Register Total | Seasonally Adjusted | Standardised Unemployment Rate (SUR) % | |
| January 2014 | 399,630 | 401,300 | 12.1 |
| December 2014 | 356,112 | 363,800 | 10.6 |
| January 2015 | 358,672 | 360,200 | 10.5 |
| Percentage Points | |||
| Change in month | - | - 3,600 | -0.1 |
| Change in year | - 40,958 | - | -1.6 |
The standardised unemployment rate (SUR) in January 2015 was 10.5%, down from 10.6% in December 2014. The seasonally adjusted unemployment rate from the most recent Quarterly National Household Survey (QNHS) was 11.1% in the third quarter of 2014. See table 3.
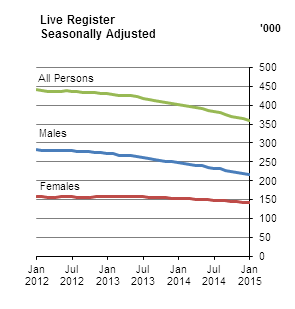
On a seasonally adjusted basis the Live Register total recorded a monthly decrease of 3,600 (-1.0%) in January 2015, reducing the seasonally adjusted total to 360,200. See table 2(a).
In unadjusted terms there were 358,672 people signing on the Live Register in January 2015. This represents an annual decrease of 40,958 (-10.2%). See table 1(a).
Other features include:
|
The Live Register is not designed to measure unemployment. It includes part-time workers (those who work up to three days a week), seasonal and casual workers entitled to Jobseeker’s Benefit (JB) or Jobseeker’s Allowance (JA). Unemployment is measured by the Quarterly National Household Survey and the latest estimated number of persons unemployed as of the third quarter of 2014 was 245,500. |
| Duration | Less than one year | One year or more |
|---|---|---|
| Jan 2013 | 239539 | 189857 |
| Feb 2013 | 239409 | 189467 |
| Mar 2013 | 237192 | 187896 |
| Apr 2013 | 231530 | 186063 |
| May 2013 | 229740 | 191997 |
| Jun 2013 | 237849 | 197508 |
| Jul 2013 | 244405 | 197571 |
| Aug 2013 | 238472 | 196808 |
| Sept 2013 | 219789 | 188881 |
| Oct 2013 | 214111 | 182401 |
| Nov 2013 | 211749 | 179758 |
| Dec 2013 | 215790 | 179621 |
| Jan 2014 | 218304 | 181326 |
| Feb 2014 | 217573 | 180496 |
| Mar 2014 | 211897 | 179335 |
| Apr 2014 | 210334 | 178225 |
| May 2014 | 205394 | 183370 |
| June 2014 | 209955 | 188858 |
| July 2014 | 215845 | 188670 |
| Aug 2014 | 210727 | 187598 |
| Sept 2014 | 191662 | 178388 |
| Oct 2014 | 187738 | 170892 |
| Nov 2014 | 186175 | 166472 |
| Dec 2014 | 191316 | 164796 |
| Jan 2015 | 193828 | 164844 |
Live Register duration of continuous registration
The number of long term claimants on the Live Register in January 2015 was 164,844. The number of male long term claimants decreased by 15,840 (-12.8%) in the year to January 2015, while females decreased by 642 (-1.1%), giving an overall annual decrease of 16,482 (-9.1%) in the number of long term claimants. See table 7 and graph above.
In January 2015, 54.0% (193,828) of all claimants on the Live Register were short term claimants. The comparable figure for January 2014 was 54.6% (218,304). The annual fall of 24,476 (-11.2%) in the number of short term claimants consisted of a decrease of 14,205 (-11.4%) in the number of male short term claimants and a decrease of 10,271 (-11.0%) in female short term claimants. See table 7.
Live Register casual and part-time workers
There were 72,085 casual and part-time workers on the Live Register in January 2015, which represents 20.1% of the total Live Register. This compares with 20.3% one year earlier when there were 80,958 casual and part-time workers on the Live Register. In the year to January 2015 the number of casual and part-time workers decreased by 8,873 (-11.0%), with the number of males decreasing by 5,157 (-11.8%) and the number of females decreasing by 3,716 (-10.0%). See table 8.
| Under 25 years | 25 years and over | |
| January 2013 | 68364 | 361032 |
| January 2014 | 60537 | 339093 |
| January 2015 | 49289 | 309383 |
Live Register age groups
In the year to January 2015 the number of persons aged 25 and over on the Live Register decreased by 29,710 (-8.8%), and the number of persons aged under 25 decreased by 11,248 (-18.6%). Annual decreases in persons aged under 25 have occurred in all months since July 2010, while the number of persons aged 25 and over have fallen annually in all months since July 2012.The percentage of persons aged under 25 on the Live Register now stands at 13.7% for January 2015, down from 15.1% in January 2014 and 15.9% in January 2013. See tables 1(b) and 1(c) and graph above.
Live Register new registrants
There were 37,745 new registrants on the Live Register in January 2015, consisting of 17,622 Jobseeker’s Benefit (JB) claims, 18,333 Jobseeker’s Allowance (JA) claims and 1,790 ‘Other Registrants’. Males accounted for 54.2% (20,452) and females 45.8% (17,293) of all new registrants. On average 4,090 male and 3,459 female new registrants joined the Live Register each week of the month. The difference between the number of new registrants on the Live Register and the change in the total number on the Live Register is accounted for by closed claims and movements between schemes. See table 4.
Live Register last occupation held
Craft and related (20.0%) remained the largest occupational group1 on the Live Register in January, despite the fact that the number in the group fell over the year by 12,797 (-15.2%) to 71,640. The second largest annual percentage decrease was in the Sales group (-11.3%). The two smallest occupational groups in January were the Associate professional and technical and Managers and administrators groups which accounted for 2.8% and 4.4% of the Live Register respectively. See table 6 and graph below.
1 While the ‘No Occupation’ group is excluded from the analysis its subtotals are included in the relevant calculations presented in the text.
| Broad Occupational Group | January 2013 | January 2014 | January 2015 |
|---|---|---|---|
| 1 | 17668 | 16795 | 15731 |
| 2 | 24453 | 22036 | 19773 |
| 3 | 12326 | 11284 | 10082 |
| 4 | 40557 | 37202 | 33697 |
| 5 | 97932 | 84437 | 71640 |
| 6 | 51789 | 50508 | 46470 |
| 7 | 45528 | 43713 | 38771 |
| 8 | 69974 | 66781 | 59316 |
| 9 | 49111 | 46276 | 43032 |
| 10 | 20058 | 20598 | 20160 |
| KEY | |
| 1- | Managers and administrators |
| 2- | Professional |
| 3- | Associate professional and technical |
| 4- | Clerical and secretarial |
| 5- | Craft and related |
| 6- | Personal and Protective service |
| 7- | Sales |
| 8- | Plant and machine operatives |
| 9- | Other occupation |
| 10- | No occupation |
Live Register by other classifications
Other points which can be noted include:
Annex - Activation Programmes
Data up to the end of December 2014 on the number of people availing of a range of programmes targeted primarily at the long-term unemployed (over 12 months) and other welfare recipients (including Lone Parents) is provided in the Annex – Live Register Activation Programmes table.
There were 86,027 people availing of these programmes in December 2014, which is a decrease of 135 (-0.2%) from the previous year, when there were 86,162 people in activation programmes.
Persons on activation programmes are not counted as part of the monthly Live Register.
| Table 1(a) Total persons on the Live Register | |||||
| Category | January 2014 | December 2014 | January 2015 | Monthly change | Annual change |
| Males | |||||
| JB Claims | 31,029 | 24,109 | 26,002 | +1,893 | -5,027 |
| JA Applications | 205,013 | 179,998 | 180,500 | +502 | -24,513 |
| Other Registrants | 12,681 | 12,232 | 12,176 | -56 | -505 |
| Total | 248,723 | 216,339 | 218,678 | +2,339 | -30,045 |
| Females | |||||
| JB Claims | 30,165 | 25,511 | 25,488 | -23 | -4,677 |
| JA Applications | 97,930 | 91,648 | 92,011 | +363 | -5,919 |
| Other Registrants | 22,812 | 22,614 | 22,495 | -119 | -317 |
| Total | 150,907 | 139,773 | 139,994 | +221 | -10,913 |
| All Persons | |||||
| JB Claims | 61,194 | 49,620 | 51,490 | +1,870 | -9,704 |
| JA Applications | 302,943 | 271,646 | 272,511 | +865 | -30,432 |
| Other Registrants | 35,493 | 34,846 | 34,671 | -175 | -822 |
| Total | 399,630 | 356,112 | 358,672 | +2,560 | -40,958 |
| Table 1(b) Persons under 25 years of age on the Live Register | |||||
| Category | January 2014 | December 2014 | January 2015 | Monthly change | Annual change |
| Males | |||||
| JB Claims | 1,814 | 1,244 | 1,528 | +284 | -286 |
| JA Applications | 34,213 | 27,234 | 27,693 | +459 | -6,520 |
| Other Registrants | 116 | 107 | 114 | +7 | -2 |
| Total | 36,143 | 28,585 | 29,335 | +750 | -6,808 |
| Females | |||||
| JB Claims | 1,925 | 1,313 | 1,544 | +231 | -381 |
| JA Applications | 22,293 | 17,874 | 18,248 | +374 | -4,045 |
| Other Registrants | 176 | 156 | 162 | +6 | -14 |
| Total | 24,394 | 19,343 | 19,954 | +611 | -4,440 |
| All Persons | |||||
| JB Claims | 3,739 | 2,557 | 3,072 | +515 | -667 |
| JA Applications | 56,506 | 45,108 | 45,941 | +833 | -10,565 |
| Other Registrants | 292 | 263 | 276 | +13 | -16 |
| Total | 60,537 | 47,928 | 49,289 | +1,361 | -11,248 |
| Table 1(c) Persons 25 years of age and over on the Live Register | |||||
| Category | January 2014 | December 2014 | January 2015 | Monthly change | Annual change |
| Males | |||||
| JB Claims | 29,215 | 22,865 | 24,474 | +1,609 | -4,741 |
| JA Applications | 170,800 | 152,764 | 152,807 | +43 | -17,993 |
| Other Registrants | 12,565 | 12,125 | 12,062 | -63 | -503 |
| Total | 212,580 | 187,754 | 189,343 | +1,589 | -23,237 |
| Females | |||||
| JB Claims | 28,240 | 24,198 | 23,944 | -254 | -4,296 |
| JA Applications | 75,637 | 73,774 | 73,763 | -11 | -1,874 |
| Other Registrants | 22,636 | 22,458 | 22,333 | -125 | -303 |
| Total | 126,513 | 120,430 | 120,040 | -390 | -6,473 |
| All Persons | |||||
| JB Claims | 57,455 | 47,063 | 48,418 | +1,355 | -9,037 |
| JA Applications | 246,437 | 226,538 | 226,570 | +32 | -19,867 |
| Other Registrants | 35,201 | 34,583 | 34,395 | -188 | -806 |
| Total | 339,093 | 308,184 | 309,383 | +1,199 | -29,710 |
| Table 2(a) Total persons on the Live Register - Unadjusted and Seasonally Adjusted | ||||||||
| Unadjusted Series | Seasonally Adjusted Series1 | |||||||
| Month | Males | Females | All Persons | Males | Females | All Persons | ||
| 2013 | January | 273,600 | 155,800 | 429,400 | 272,500 | 158,400 | 430,900 | |
| February | 272,900 | 156,000 | 428,900 | 270,900 | 158,200 | 429,100 | ||
| March | 269,000 | 156,100 | 425,100 | 267,900 | 158,100 | 426,100 | ||
| April | 265,000 | 152,600 | 417,600 | 268,000 | 158,100 | 426,000 | ||
| May | 266,900 | 154,800 | 421,700 | 266,500 | 157,900 | 424,400 | ||
| June | 270,900 | 164,400 | 435,400 | 263,800 | 157,900 | 421,800 | ||
| July | 270,300 | 171,700 | 442,000 | 261,700 | 157,200 | 418,900 | ||
| August | 266,400 | 168,800 | 435,300 | 258,700 | 156,500 | 415,200 | ||
| September | 254,000 | 154,600 | 408,700 | 257,500 | 156,200 | 413,700 | ||
| October | 246,800 | 149,800 | 396,500 | 254,700 | 155,200 | 409,900 | ||
| November | 243,500 | 148,000 | 391,500 | 252,200 | 154,800 | 407,000 | ||
| December | 245,700 | 149,700 | 395,400 | 249,900 | 153,900 | 403,800 | ||
| 2014 | January | 248,700 | 150,900 | 399,600 | 247,800 | 153,500 | 401,300 | |
| February | 247,400 | 150,700 | 398,100 | 245,600 | 152,900 | 398,500 | ||
| March | 243,200 | 148,000 | 391,200 | 243,500 | 152,400 | 395,900 | ||
| April | 239,500 | 149,000 | 388,600 | 240,900 | 151,800 | 392,700 | ||
| May | 240,400 | 148,400 | 388,800 | 239,600 | 151,200 | 390,800 | ||
| June | 242,700 | 156,100 | 398,800 | 236,300 | 149,800 | 386,200 | ||
| July | 241,300 | 163,200 | 404,500 | 233,700 | 149,100 | 382,700 | ||
| August | 238,100 | 160,300 | 398,300 | 231,200 | 148,400 | 379,600 | ||
| September | 224,800 | 145,200 | 370,100 | 227,900 | 147,000 | 374,900 | ||
| October | 217,800 | 140,900 | 358,600 | 225,000 | 146,200 | 371,300 | ||
| November | 214,700 | 137,900 | 352,600 | 222,500 | 144,600 | 367,200 | ||
| December | 216,300 | 139,800 | 356,100 | 220,100 | 143,700 | 363,800 | ||
| 2015 | January | 218,700 | 140,000 | 358,700 | 217,800 | 142,400 | 360,200 | |
| 1 Table contains revised figures. | ||||||||
| Table 2(b) Persons under 25 years of age on the Live Register - Unadjusted and Seasonally Adjusted | ||||||||
| Unadjusted Series | Seasonally Adjusted Series1 | |||||||
| Month | Males | Females | All Persons | Males | Females | All Persons | ||
| 2013 | January | 41,500 | 26,900 | 68,400 | 42,100 | 28,100 | 70,200 | |
| February | 41,400 | 27,000 | 68,400 | 41,700 | 27,900 | 69,600 | ||
| March | 40,300 | 26,200 | 66,600 | 41,000 | 27,400 | 68,400 | ||
| April | 39,400 | 25,600 | 65,000 | 40,700 | 27,500 | 68,200 | ||
| May | 40,400 | 26,900 | 67,300 | 40,700 | 27,500 | 68,200 | ||
| June | 42,100 | 29,200 | 71,300 | 39,800 | 27,100 | 66,900 | ||
| July | 42,400 | 30,200 | 72,500 | 39,400 | 26,700 | 66,100 | ||
| August | 41,800 | 30,100 | 71,900 | 38,800 | 26,500 | 65,300 | ||
| September | 38,900 | 27,300 | 66,200 | 38,600 | 26,500 | 65,100 | ||
| October | 37,000 | 25,600 | 62,600 | 38,200 | 26,300 | 64,600 | ||
| November | 35,500 | 24,200 | 59,700 | 37,700 | 26,000 | 63,700 | ||
| December | 35,300 | 23,800 | 59,100 | 37,200 | 25,800 | 63,000 | ||
| 2014 | January | 36,100 | 24,400 | 60,500 | 36,800 | 25,400 | 62,200 | |
| February | 36,000 | 24,200 | 60,200 | 36,300 | 25,100 | 61,300 | ||
| March | 35,300 | 23,600 | 58,900 | 35,900 | 24,900 | 60,700 | ||
| April | 34,200 | 23,100 | 57,200 | 35,300 | 24,500 | 59,700 | ||
| May | 34,900 | 23,600 | 58,500 | 35,100 | 24,000 | 59,100 | ||
| June | 36,000 | 25,400 | 61,400 | 34,000 | 23,600 | 57,600 | ||
| July | 35,900 | 26,200 | 62,100 | 33,400 | 23,200 | 56,500 | ||
| August | 35,400 | 26,100 | 61,500 | 32,800 | 22,900 | 55,700 | ||
| September | 32,100 | 23,000 | 55,100 | 31,900 | 22,300 | 54,300 | ||
| October | 30,100 | 21,100 | 51,200 | 31,200 | 21,800 | 53,000 | ||
| November | 29,000 | 19,900 | 48,900 | 30,800 | 21,400 | 52,200 | ||
| December | 28,600 | 19,300 | 47,900 | 30,200 | 21,000 | 51,200 | ||
| 2015 | January | 29,300 | 20,000 | 49,300 | 29,900 | 20,800 | 50,700 | |
| 1 Table contains revised figures. | ||||||||
| Table 2(c) Persons 25 years of age and over on the Live Register - Unadjusted and Seasonally Adjusted | ||||||||
| Unadjusted Series | Seasonally Adjusted Series1 | |||||||
| Month | Males | Females | All Persons | Males | Females | All Persons | ||
| 2013 | January | 232,200 | 128,900 | 361,000 | 230,400 | 130,400 | 360,700 | |
| February | 231,500 | 129,000 | 360,500 | 229,200 | 130,300 | 359,500 | ||
| March | 228,700 | 129,900 | 358,500 | 226,900 | 130,800 | 357,700 | ||
| April | 225,700 | 127,000 | 352,600 | 227,300 | 130,500 | 357,800 | ||
| May | 226,600 | 127,900 | 354,500 | 225,800 | 130,400 | 356,200 | ||
| June | 228,800 | 135,200 | 364,000 | 224,000 | 130,900 | 354,900 | ||
| July | 227,900 | 141,500 | 369,400 | 222,300 | 130,500 | 352,800 | ||
| August | 224,600 | 138,700 | 363,300 | 220,000 | 130,000 | 349,900 | ||
| September | 215,200 | 127,300 | 342,500 | 218,900 | 129,700 | 348,600 | ||
| October | 209,800 | 124,100 | 333,900 | 216,500 | 128,900 | 345,400 | ||
| November | 208,000 | 123,700 | 331,800 | 214,600 | 128,700 | 343,300 | ||
| December | 210,400 | 125,900 | 336,300 | 212,800 | 128,100 | 340,800 | ||
| 2014 | January | 212,600 | 126,500 | 339,100 | 211,000 | 128,000 | 339,100 | |
| February | 211,400 | 126,500 | 337,800 | 209,400 | 127,800 | 337,100 | ||
| March | 207,900 | 124,400 | 332,400 | 207,700 | 127,500 | 335,200 | ||
| April | 205,400 | 125,900 | 331,300 | 205,600 | 127,400 | 333,000 | ||
| May | 205,500 | 124,800 | 330,200 | 204,500 | 127,100 | 331,700 | ||
| June | 206,700 | 130,700 | 337,400 | 202,300 | 126,300 | 328,600 | ||
| July | 205,400 | 137,000 | 342,400 | 200,300 | 125,900 | 326,200 | ||
| August | 202,600 | 134,200 | 336,800 | 198,400 | 125,500 | 323,900 | ||
| September | 192,700 | 122,200 | 314,900 | 195,900 | 124,700 | 320,600 | ||
| October | 187,700 | 119,800 | 307,400 | 193,800 | 124,500 | 318,300 | ||
| November | 185,700 | 118,000 | 303,800 | 191,700 | 123,200 | 315,000 | ||
| December | 187,800 | 120,400 | 308,200 | 189,900 | 122,700 | 312,600 | ||
| 2015 | January | 189,300 | 120,000 | 309,400 | 187,900 | 121,600 | 309,600 | |
| 1 Table contains revised figures. | ||||||||
| Table 3 Seasonally Adjusted Standardised Unemployment Rates (SUR)1 | |||||||
| Month | 2011 | 2012 | 2013 | 2014 | 2015 | ||
| % | % | % | % | % | |||
| January | 14.5 | 15.0 | 13.9 | 12.1 | 10.5 | ||
| February2 | 14.4 | 15.1 | 13.7 | 12.0 | |||
| March | 14.4 | 14.9 | 13.6 | 11.9 | |||
| April | 14.4 | 14.8 | 13.6 | 11.6 | |||
| May2 | 14.4 | 14.7 | 13.5 | 11.5 | |||
| June | 14.5 | 14.8 | 13.3 | 11.3 | |||
| July | 14.7 | 14.7 | 13.0 | 11.2 | |||
| August2 | 14.8 | 14.7 | 12.7 | 11.1 | 3 | ||
| September | 14.7 | 14.5 | 12.6 | 11.0 | |||
| October | 14.8 | 14.4 | 12.4 | 10.9 | |||
| November2 | 14.9 | 14.2 | 12.2 | 10.7 | |||
| December | 15.0 | 14.1 | 12.2 | 10.6 | |||
| Annual average | 14.6 | 14.7 | 13.1 | 11.3 | |||
| 1 Table contains revised figures. See Background Notes. | |||||||
| 2 Benchmark Quarterly National Household Survey (QNHS) calendar quarter estimates. | |||||||
| 3 The latest QNHS estimate of the unemployment rate (adjusted for seasonality) is: July- September 2014, 11.1%. | |||||||
| Table 4 Summary of flows1 on and off the Live Register | |||||||||||
| Males | Females | ||||||||||
| Number of Weeks | New Regis-trations | Average Weekly Change | New Regis-trations | Average Weekly Change | |||||||
| Live Register | Outflow (derived) | Live Register | Outflow (derived) | ||||||||
| JB Claims | |||||||||||
| 2014 | January | 5 | 31,029 | 9,330 | 7,908 | +284 | 30,165 | 9,876 | 9,750 | +25 | |
| February | 4 | 30,755 | 6,255 | 6,529 | -69 | 29,953 | 6,588 | 6,800 | -53 | ||
| March | 4 | 28,864 | 4,724 | 6,615 | -473 | 28,129 | 4,694 | 6,518 | -456 | ||
| April | 4 | 27,751 | 4,898 | 6,011 | -278 | 29,121 | 6,108 | 5,116 | +248 | ||
| May | 5 | 26,201 | 5,811 | 7,361 | -310 | 26,584 | 7,203 | 9,740 | -507 | ||
| June | 4 | 25,780 | 4,611 | 5,032 | -105 | 28,944 | 7,078 | 4,718 | +590 | ||
| July | 4 | 25,624 | 5,008 | 5,164 | -39 | 33,789 | 9,967 | 5,122 | +1,211 | ||
| August | 5 | 24,201 | 5,031 | 6,454 | -285 | 31,093 | 5,978 | 8,674 | -539 | ||
| September | 4 | 22,126 | 4,247 | 6,322 | -519 | 24,150 | 4,714 | 11,657 | -1,736 | ||
| October | 5 | 22,129 | 6,304 | 6,301 | +1 | 23,981 | 6,242 | 6,411 | -34 | ||
| November | 4 | 22,565 | 5,844 | 5,408 | +109 | 23,533 | 6,522 | 6,970 | -112 | ||
| December | 4 | 24,109 | 4,845 | 3,301 | +386 | 25,511 | 5,300 | 3,322 | +495 | ||
| 2015 | January | 5 | 26,002 | 8,782 | 6,889 | +379 | 25,488 | 8,840 | 8,863 | -5 | |
| JA Applications | |||||||||||
| 2014 | January | 5 | 205,013 | 12,463 | 11,105 | +272 | 97,930 | 8,157 | 7,162 | +199 | |
| February | 4 | 203,878 | 9,905 | 11,040 | -284 | 97,838 | 6,474 | 6,566 | -23 | ||
| March | 4 | 201,543 | 8,751 | 11,086 | -584 | 97,088 | 5,681 | 6,431 | -188 | ||
| April | 4 | 198,974 | 7,921 | 10,490 | -642 | 96,788 | 5,453 | 5,753 | -75 | ||
| May | 5 | 201,419 | 11,707 | 9,262 | +489 | 98,847 | 8,083 | 6,024 | +412 | ||
| June | 4 | 204,157 | 10,356 | 7,618 | +685 | 103,919 | 9,278 | 4,206 | +1,268 | ||
| July | 4 | 203,043 | 9,496 | 10,610 | -279 | 105,608 | 8,061 | 6,372 | +422 | ||
| August | 5 | 201,263 | 11,339 | 13,119 | -356 | 105,590 | 8,082 | 8,100 | -4 | ||
| September | 4 | 190,338 | 10,456 | 21,381 | -2,731 | 98,272 | 7,376 | 14,694 | -1,830 | ||
| October | 5 | 183,349 | 12,585 | 19,574 | -1,398 | 94,184 | 8,181 | 12,269 | -818 | ||
| November | 4 | 179,940 | 10,176 | 13,585 | -852 | 91,872 | 6,346 | 8,658 | -578 | ||
| December | 4 | 179,998 | 7,825 | 7,767 | +15 | 91,648 | 4,744 | 4,968 | -56 | ||
| 2015 | January | 5 | 180,500 | 11,066 | 10,564 | +100 | 92,011 | 7,267 | 6,904 | +73 | |
| Other Registrants | |||||||||||
| 2014 | January | 5 | 12,681 | 847 | 625 | +44 | 22,812 | 1,311 | 1,215 | +19 | |
| February | 4 | 12,748 | 641 | 574 | +17 | 22,897 | 1,003 | 918 | +21 | ||
| March | 4 | 12,782 | 515 | 481 | +9 | 22,826 | 792 | 863 | -18 | ||
| April | 4 | 12,816 | 476 | 442 | +9 | 23,109 | 972 | 689 | +71 | ||
| May | 5 | 12,794 | 523 | 545 | -4 | 22,919 | 1,072 | 1,262 | -38 | ||
| June | 4 | 12,760 | 449 | 483 | -9 | 23,253 | 1,103 | 769 | +84 | ||
| July | 4 | 12,650 | 549 | 659 | -28 | 23,801 | 1,564 | 1,016 | +137 | ||
| August | 5 | 12,598 | 566 | 618 | -10 | 23,580 | 1,064 | 1,285 | -44 | ||
| September | 4 | 12,355 | 500 | 743 | -61 | 22,809 | 924 | 1,695 | -193 | ||
| October | 5 | 12,294 | 667 | 728 | -12 | 22,693 | 1,260 | 1,376 | -23 | ||
| November | 4 | 12,221 | 577 | 650 | -18 | 22,516 | 1,060 | 1,237 | -44 | ||
| December | 4 | 12,232 | 442 | 431 | +3 | 22,614 | 813 | 715 | +25 | ||
| 2015 | January | 5 | 12,176 | 604 | 660 | -11 | 22,495 | 1,186 | 1,305 | -24 | |
| 1 Flow analysis: inflows and outflows published in this table do not take account of inter-scheme activity within the Live Register. For example, | |||||||||||
| if a claimant exhausts his/her entitlement to JB and opens a new JA claim this is counted as an outflow in JB and an inflow in JA. | |||||||||||
| Table 5 Persons on the Live Register classified by region | |||||||
| NUTS2 and NUTS3 Regions1 | January 2014 | December 2014 | January 2015 | Monthly change | Annual change | Under 25 years | 25 years & over |
| Males | |||||||
| Border, Midland and Western | 76,833 | 67,273 | 67,987 | +714 | -8,846 | 9,469 | 58,518 |
| Border | 34,913 | 30,701 | 31,067 | +366 | -3,846 | 4,472 | 26,595 |
| Midland | 19,780 | 17,279 | 17,435 | +156 | -2,345 | 2,503 | 14,932 |
| West | 22,140 | 19,293 | 19,485 | +192 | -2,655 | 2,494 | 16,991 |
| Southern and Eastern | 171,890 | 149,066 | 150,691 | +1,625 | -21,199 | 19,866 | 130,825 |
| Dublin | 61,032 | 53,266 | 53,623 | +357 | -7,409 | 7,260 | 46,363 |
| Mid-East | 23,576 | 20,437 | 20,684 | +247 | -2,892 | 2,867 | 17,817 |
| Mid-West | 20,950 | 18,100 | 18,064 | -36 | -2,886 | 2,478 | 15,586 |
| South-East | 33,366 | 29,071 | 29,428 | +357 | -3,938 | 4,046 | 25,382 |
| South-West | 32,966 | 28,192 | 28,892 | +700 | -4,074 | 3,215 | 25,677 |
| Total | 248,723 | 216,339 | 218,678 | +2,339 | -30,045 | 29,335 | 189,343 |
| Females | |||||||
| Border, Midland and Western | 48,165 | 45,085 | 45,200 | +115 | -2,965 | 6,811 | 38,389 |
| Border | 21,603 | 20,254 | 20,374 | +120 | -1,229 | 3,156 | 17,218 |
| Midland | 12,289 | 11,548 | 11,591 | +43 | -698 | 1,921 | 9,670 |
| West | 14,273 | 13,283 | 13,235 | -48 | -1,038 | 1,734 | 11,501 |
| Southern and Eastern | 102,742 | 94,688 | 94,794 | +106 | -7,948 | 13,143 | 81,651 |
| Dublin | 34,444 | 31,441 | 31,609 | +168 | -2,835 | 4,433 | 27,176 |
| Mid-East | 15,107 | 14,236 | 14,246 | +10 | -861 | 1,957 | 12,289 |
| Mid-West | 13,038 | 11,956 | 11,688 | -268 | -1,350 | 1,701 | 9,987 |
| South-East | 19,691 | 18,401 | 18,351 | -50 | -1,340 | 2,828 | 15,523 |
| South-West | 20,462 | 18,654 | 18,900 | +246 | -1,562 | 2,224 | 16,676 |
| Total | 150,907 | 139,773 | 139,994 | +221 | -10,913 | 19,954 | 120,040 |
| All Persons | |||||||
| Border, Midland and Western | 124,998 | 112,358 | 113,187 | +829 | -11,811 | 16,280 | 96,907 |
| Border | 56,516 | 50,955 | 51,441 | +486 | -5,075 | 7,628 | 43,813 |
| Midland | 32,069 | 28,827 | 29,026 | +199 | -3,043 | 4,424 | 24,602 |
| West | 36,413 | 32,576 | 32,720 | +144 | -3,693 | 4,228 | 28,492 |
| Southern and Eastern | 274,632 | 243,754 | 245,485 | +1,731 | -29,147 | 33,009 | 212,476 |
| Dublin | 95,476 | 84,707 | 85,232 | +525 | -10,244 | 11,693 | 73,539 |
| Mid-East | 38,683 | 34,673 | 34,930 | +257 | -3,753 | 4,824 | 30,106 |
| Mid-West | 33,988 | 30,056 | 29,752 | -304 | -4,236 | 4,179 | 25,573 |
| South-East | 53,057 | 47,472 | 47,779 | +307 | -5,278 | 6,874 | 40,905 |
| South-West | 53,428 | 46,846 | 47,792 | +946 | -5,636 | 5,439 | 42,353 |
| Total | 399,630 | 356,112 | 358,672 | +2,560 | -40,958 | 49,289 | 309,383 |
| 1 The composition of the regions is described in the Background Notes. | |||||||
| Table 6 Persons on the Live Register classified by last held occupation | |||||||
| Janaury 2014 | December 2014 | January 2015 | Monthly change | Annual change | Under 25 years | 25 years & over | |
| Broad occupational group | |||||||
| Males | |||||||
| Managers and administrators | 9,635 | 8,910 | 9,056 | +146 | -579 | 294 | 8,762 |
| Professional | 10,211 | 9,242 | 9,084 | -158 | -1,127 | 685 | 8,399 |
| Associate professional and technical | 6,446 | 5,690 | 5,733 | +43 | -713 | 690 | 5,043 |
| Clerical and secretarial | 10,302 | 9,390 | 9,285 | -105 | -1,017 | 997 | 8,288 |
| Craft and related | 77,262 | 64,141 | 64,611 | +470 | -12,651 | 4,536 | 60,075 |
| Personal and protective service | 17,747 | 15,609 | 15,933 | +324 | -1,814 | 1,877 | 14,056 |
| Sales | 17,059 | 14,315 | 14,863 | +548 | -2,196 | 3,945 | 10,918 |
| Plant and machine operatives | 51,115 | 43,969 | 44,756 | +787 | -6,359 | 5,373 | 39,383 |
| Other occupation | 36,250 | 32,788 | 33,089 | +301 | -3,161 | 5,844 | 27,245 |
| No occupation1 | 12,696 | 12,285 | 12,268 | -17 | -428 | 5,094 | 7,174 |
| Total | 248,723 | 216,339 | 218,678 | +2,339 | -30,045 | 29,335 | 189,343 |
| Females | |||||||
| Managers and administrators | 7,160 | 6,522 | 6,675 | +153 | -485 | 110 | 6,565 |
| Professional | 11,825 | 11,286 | 10,689 | -597 | -1,136 | 665 | 10,024 |
| Associate professional and technical | 4,838 | 4,420 | 4,349 | -71 | -489 | 350 | 3,999 |
| Clerical and secretarial | 26,900 | 25,328 | 24,412 | -916 | -2,488 | 1,248 | 23,164 |
| Craft and related | 7,175 | 6,757 | 7,029 | +272 | -146 | 875 | 6,154 |
| Personal and protective service | 32,761 | 30,149 | 30,537 | +388 | -2,224 | 4,413 | 26,124 |
| Sales | 26,654 | 23,190 | 23,908 | +718 | -2,746 | 4,591 | 19,317 |
| Plant and machine operatives | 15,666 | 14,353 | 14,560 | +207 | -1,106 | 1,964 | 12,596 |
| Other occupation | 10,026 | 9,870 | 9,943 | +73 | -83 | 2,554 | 7,389 |
| No occupation1 | 7,902 | 7,898 | 7,892 | -6 | -10 | 3,184 | 4,708 |
| Total | 150,907 | 139,773 | 139,994 | +221 | -10,913 | 19,954 | 120,040 |
| All Persons | |||||||
| Managers and administrators | 16,795 | 15,432 | 15,731 | +299 | -1,064 | 404 | 15,327 |
| Professional | 22,036 | 20,528 | 19,773 | -755 | -2,263 | 1,350 | 18,423 |
| Associate professional and technical | 11,284 | 10,110 | 10,082 | -28 | -1,202 | 1,040 | 9,042 |
| Clerical and secretarial | 37,202 | 34,718 | 33,697 | -1,021 | -3,505 | 2,245 | 31,452 |
| Craft and related | 84,437 | 70,898 | 71,640 | +742 | -12,797 | 5,411 | 66,229 |
| Personal and protective service | 50,508 | 45,758 | 46,470 | +712 | -4,038 | 6,290 | 40,180 |
| Sales | 43,713 | 37,505 | 38,771 | +1,266 | -4,942 | 8,536 | 30,235 |
| Plant and machine operatives | 66,781 | 58,322 | 59,316 | +994 | -7,465 | 7,337 | 51,979 |
| Other occupation | 46,276 | 42,658 | 43,032 | +374 | -3,244 | 8,398 | 34,634 |
| No occupation1 | 20,598 | 20,183 | 20,160 | -23 | -438 | 8,278 | 11,882 |
| Total | 399,630 | 356,112 | 358,672 | +2,560 | -40,958 | 49,289 | 309,383 |
| 1 Includes those who never worked and those who have no stated occupation. | |||||||
| Table 7 Persons on the Live Register classified by duration of continuous registration | |||||||
| January 2014 | December 2014 | January 2015 | Monthly change | Annual change | Under 25 years | 25 years & over | |
| Duration | |||||||
| Males | |||||||
| Less than one year | 124,554 | 107,855 | 110,349 | +2,494 | -14,205 | 19,054 | 91,295 |
| One year or more | 124,169 | 108,484 | 108,329 | -155 | -15,840 | 10,281 | 98,048 |
| Total | 248,723 | 216,339 | 218,678 | +2,339 | -30,045 | 29,335 | 189,343 |
| Females | |||||||
| Less than one year | 93,750 | 83,461 | 83,479 | +18 | -10,271 | 13,986 | 69,493 |
| One year or more | 57,157 | 56,312 | 56,515 | +203 | -642 | 5,968 | 50,547 |
| Total | 150,907 | 139,773 | 139,994 | +221 | -10,913 | 19,954 | 120,040 |
| All Persons | |||||||
| Less than one year | 218,304 | 191,316 | 193,828 | +2,512 | -24,476 | 33,040 | 160,788 |
| One year or more | 181,326 | 164,796 | 164,844 | +48 | -16,482 | 16,249 | 148,595 |
| Total | 399,630 | 356,112 | 358,672 | +2,560 | -40,958 | 49,289 | 309,383 |
| Table 8 Casual and part-time workers on the Live Register | ||||||||||
| Males | Monthly change | Females | Monthly change | All Persons | Monthly change | |||||
| 2013 | January | 47,829 | +253 | 40,095 | +108 | 87,924 | -145 | |||
| February | 48,870 | +1,041 | 40,910 | +815 | 89,780 | +1,856 | ||||
| March | 48,961 | +91 | 40,837 | -73 | 89,798 | +18 | ||||
| April | 48,527 | -434 | 40,382 | -455 | 88,909 | -889 | ||||
| May | 48,095 | -432 | 39,848 | -534 | 87,943 | -966 | ||||
| June | 48,178 | +83 | 40,144 | +296 | 88,322 | +379 | ||||
| July | 47,592 | +586 | 39,827 | -317 | 87,419 | -903 | ||||
| August | 46,259 | -1,333 | 38,846 | -981 | 85,105 | -2,314 | ||||
| September | 44,676 | -1,583 | 37,619 | -1,227 | 82,295 | -2,810 | ||||
| October | 43,945 | -731 | 37,374 | -245 | 81,319 | -976 | ||||
| November | 43,911 | -34 | 37,578 | +204 | 81,489 | +170 | ||||
| December | 43,927 | +16 | 37,455 | -123 | 81,382 | -107 | ||||
| 2014 | January | 43,706 | -221 | 37,252 | -203 | 80,958 | -424 | |||
| February | 43,860 | +154 | 37,344 | +92 | 81,204 | +246 | ||||
| March | 43,032 | -828 | 36,779 | -565 | 79,811 | -1,393 | ||||
| April | 42,207 | -825 | 36,158 | -621 | 78,365 | -1,446 | ||||
| May | 41,310 | -897 | 35,452 | -706 | 76,762 | -1,603 | ||||
| June | 41,083 | -227 | 35,478 | +26 | 76,561 | -201 | ||||
| July | 40,562 | -521 | 35,168 | -310 | 75,730 | -831 | ||||
| August | 39,709 | -853 | 34,417 | -751 | 74,126 | -1,604 | ||||
| September | 38,481 | -1,228 | 33,263 | -1,154 | 71,744 | -2,382 | ||||
| October | 38,275 | -206 | 33,177 | -86 | 71,452 | -292 | ||||
| November | 38,714 | +439 | 33,563 | +386 | 72,277 | +825 | ||||
| December | 38,681 | -33 | 33,681 | +118 | 72,362 | +85 | ||||
| 2015 | January | 38,549 | -132 | 33,536 | -145 | 72,085 | -277 | |||
| Table 9 Persons on the Live Register classified by nationality grouping | |||||||||
| Nationality grouping | |||||||||
| Non-Irish nationals | |||||||||
| EU15 excl. IRL & UK | EU15 to EU281 States | ||||||||
| United Kingdom | Non-Irish nationals | Irish nationals | All Persons | ||||||
| Other | |||||||||
| 2013 | January | 16,934 | 3,743 | 42,004 | 13,761 | 76,442 | 352,954 | 429,396 | |
| February | 16,799 | 3,853 | 42,561 | 13,616 | 76,829 | 352,047 | 428,876 | ||
| March | 16,555 | 3,851 | 42,246 | 13,194 | 75,846 | 349,242 | 425,088 | ||
| April | 16,180 | 3,683 | 41,635 | 12,864 | 74,362 | 343,231 | 417,593 | ||
| May | 16,187 | 3,663 | 40,858 | 13,124 | 73,832 | 347,905 | 421,737 | ||
| June | 16,706 | 3,750 | 40,634 | 13,520 | 74,610 | 360,747 | 435,357 | ||
| July | 16,873 | 3,748 | 40,136 | 13,312 | 74,069 | 367,907 | 441,976 | ||
| August | 16,515 | 3,679 | 39,175 | 13,083 | 72,452 | 362,828 | 435,280 | ||
| September | 15,543 | 3,536 | 37,842 | 12,320 | 69,241 | 339,429 | 408,670 | ||
| October | 15,145 | 3,490 | 37,275 | 11,627 | 67,537 | 328,975 | 396,512 | ||
| November | 15,099 | 3,660 | 37,748 | 11,386 | 67,893 | 323,614 | 391,507 | ||
| December | 15,201 | 3,711 | 38,221 | 11,344 | 68,477 | 326,934 | 395,411 | ||
| 2014 | January | 15,253 | 3,830 | 39,263 | 11,355 | 69,701 | 329,929 | 399,630 | |
| February | 15,147 | 3,836 | 39,337 | 11,372 | 69,692 | 328,377 | 398,069 | ||
| March | 14,918 | 3,650 | 38,587 | 11,267 | 68,422 | 322,810 | 391,232 | ||
| April | 14,757 | 3,638 | 37,867 | 11,133 | 67,395 | 321,164 | 388,559 | ||
| May | 14,682 | 3,648 | 37,092 | 11,388 | 66,810 | 321,954 | 388,764 | ||
| June | 15,034 | 3,751 | 36,772 | 11,793 | 67,350 | 331,463 | 398,813 | ||
| July | 15,173 | 3,712 | 36,399 | 11,656 | 66,940 | 337,575 | 404,515 | ||
| August | 14,985 | 3,674 | 35,445 | 11,280 | 65,384 | 332,941 | 398,325 | ||
| September | 14,075 | 3,494 | 33,843 | 10,099 | 61,511 | 308,539 | 370,050 | ||
| October | 13,687 | 3,460 | 33,324 | 9,420 | 59,891 | 298,739 | 358,630 | ||
| November | 13,549 | 3,641 | 33,578 | 9,133 | 59,901 | 292,746 | 352,647 | ||
| December | 13,632 | 3,644 | 34,090 | 9,074 | 60,440 | 295,672 | 356,112 | ||
| 2015 | January | 13,665 | 3,688 | 35,219 | 8,916 | 61,488 | 297,184 | 358,672 | |
| 1With the addition of Croatia from July 2013, EU15- EU28 | |||||||||
| Table 10 Live Register Compositional Analysis | ||||||||
| January 2012 | January 2013 | January 2014 | January 2015 | |||||
| % of total | % of total | % of total | % of total | |||||
| Number | Number | Number | Number | |||||
| Sex | ||||||||
| Males | 283,893 | 64.6 | 273,627 | 63.7 | 248,723 | 62.2 | 218,678 | 61.0 |
| Females | 155,696 | 35.4 | 155,769 | 36.3 | 150,907 | 37.8 | 139,994 | 39.0 |
| Total | 439,589 | 100.0 | 429,396 | 100.0 | 399,630 | 100.0 | 358,672 | 100.0 |
| Age | ||||||||
| Under 25 years | 75,345 | 17.1 | 68,364 | 15.9 | 60,537 | 15.1 | 49,289 | 13.7 |
| 25 years and over | 364,244 | 82.9 | 361,032 | 84.1 | 339,093 | 84.9 | 309,383 | 86.3 |
| Total | 439,589 | 100.0 | 429,396 | 100.0 | 399,630 | 100.0 | 358,672 | 100.0 |
| Scheme | ||||||||
| JB Claims | 104,333 | 23.7 | 86,728 | 20.2 | 61,194 | 15.3 | 51,490 | 14.4 |
| JA Applications | 304,200 | 69.2 | 308,846 | 71.9 | 302,943 | 75.8 | 272,511 | 76.0 |
| Other Registrants | 31,056 | 7.1 | 33,822 | 7.9 | 35,493 | 8.9 | 34,671 | 9.7 |
| Total | 439,589 | 100.0 | 429,396 | 100.0 | 399,630 | 100.0 | 358,672 | 100.0 |
| Duration of Continuous Registration | ||||||||
| Less than one year | 255,740 | 58.2 | 239,539 | 55.8 | 218,304 | 54.6 | 193,828 | 54.0 |
| One year or more | 183,849 | 41.8 | 189,857 | 44.2 | 181,326 | 45.4 | 164,844 | 46.0 |
| Total | 439,589 | 100.0 | 429,396 | 100.0 | 399,630 | 100.0 | 358,672 | 100.0 |
| Nationality Grouping | ||||||||
| Irish Nationals | 361,438 | 82.2 | 352,954 | 82.2 | 329,929 | 82.6 | 297,184 | 82.9 |
| Non-Irish Nationals | 78,151 | 17.8 | 76,442 | 17.8 | 69,701 | 17.4 | 61,488 | 17.1 |
| Total | 439,589 | 100.0 | 429,396 | 100.0 | 399,630 | 100.0 | 358,672 | 100.0 |
| NUTS2 Regions1 | ||||||||
| Border, Midland and Western | 135,741 | 30.9 | 133,323 | 31.0 | 124,998 | 31.3 | 113,187 | 31.6 |
| Southern and Eastern | 303,848 | 69.1 | 296,073 | 69.0 | 274,632 | 68.7 | 245,485 | 68.4 |
| Total | 439,589 | 100.0 | 429,396 | 100.0 | 399,630 | 100.0 | 358,672 | 100.0 |
| Last Held Occupation | ||||||||
| Managers and administrators | 16,940 | 3.9 | 17,668 | 4.1 | 16,795 | 4.2 | 15,731 | 4.4 |
| Professional | 24,174 | 5.5 | 24,453 | 5.7 | 22,036 | 5.5 | 19,773 | 5.5 |
| Associate professional and technical | 12,384 | 2.8 | 12,326 | 2.9 | 11,284 | 2.8 | 10,082 | 2.8 |
| Clerical and secretarial | 41,914 | 9.5 | 40,557 | 9.4 | 37,202 | 9.3 | 33,697 | 9.4 |
| Craft and related | 106,691 | 24.3 | 97,932 | 22.8 | 84,437 | 21.1 | 71,640 | 20.0 |
| Personal and protective service | 52,362 | 11.9 | 51,789 | 12.1 | 50,508 | 12.6 | 46,470 | 13.0 |
| Sales | 46,263 | 10.5 | 45,528 | 10.6 | 43,713 | 10.9 | 38,771 | 10.8 |
| Plant and machine operatives | 70,966 | 16.1 | 69,974 | 16.3 | 66,781 | 16.7 | 59,316 | 16.5 |
| Other occupation | 49,954 | 11.4 | 49,111 | 11.4 | 46,276 | 11.6 | 43,032 | 12.0 |
| No occupation2 | 17,941 | 4.1 | 20,058 | 4.7 | 20,598 | 5.2 | 20,160 | 5.6 |
| Total | 439,589 | 100.0 | 429,396 | 100.0 | 399,630 | 100.0 | 358,672 | 100.0 |
| Casual Status | ||||||||
| No casual and part-time work | 352,560 | 80.2 | 341,472 | 79.5 | 318,672 | 79.7 | 286,587 | 79.9 |
| Casual and part-time work | 87,029 | 19.8 | 87,924 | 20.5 | 80,958 | 20.3 | 72,085 | 20.1 |
| Total | 439,589 | 100.0 | 429,396 | 100.0 | 399,630 | 100.0 | 358,672 | 100.0 |
| 1 The composition of the regions is described in the Background Notes. | ||||||||
| 2 Includes those who never worked and those who have no stated occupation. | ||||||||
| Live Register Activation Programmes | |||
| December 2013 | November 2014 | December 2014 | |
| Back to Work Schemes | |||
| Back to Work allowance scheme - Employee strand1 | 11 | 5 | 3 |
| Back to Work Enterprise allowance scheme -self employed strand | 10,098 | 11,009 | 11,166 |
| Short-term Enterprise Allowance2 | 583 | 492 | 479 |
| Total Back to Work payments | 10,692 | 11,506 | 11,648 |
| Other Activation Programmes | |||
| DSP Part-time Job Incentive | 312 | 393 | 397 |
| TUS - Community Work Placement Initiative (2011) | 7,108 | 7,860 | 7,877 |
| JobBridge (2011) | 6,483 | 6,742 | 6,371 |
| Total Other Activation Programmes | 13,903 | 14,995 | 14,645 |
| Community Employment Schemes (excluding Supervisors) | 22,575 | 23,035 | 23,249 |
| FAS Full Time Training for Unemployed People(3) | 8,996 | 8,910 | 8,771 |
| Back to Education Courses | |||
| Vocational Training Opportunities Scheme (VTOS)4 | N/A | N/A | N/A |
| Back to Education Allowance (BTEA)5 | 24,996 | 22,714 | 22,714 |
| Total Back to Education Courses | 29,996 | 27,714 | 27,714 |
| Total Activation Programmes | 86,162 | 86,160 | 86,027 |
| 1 This scheme was closed to new applications from 1st May 2009. | |||
| 2 This scheme was introduced from 1st May 2009. It provides immediate support for someone in receipt of Jobseekers | |||
| Benefit who wants to start a business. | |||
| 3 Specific Skills Training/Local Training initiative/Traineeship/Return to Work. | |||
| 4 VTOS figures are estimated at 5,000 each year. | |||
| 5 BTEA figures include all schemes but participants from JA & JB are not entitled to BTEA during the summer holidays. | |||
Source and scope of the Live Register
The Live Register is compiled from returns made for each local office to the Central Statistics Office by the Department of Social Protection. It comprises of persons under 65 years of age in the following classes:
The Live Register excludes those claimants on Jobseeker schemes who are 65 years of age and over. There was no change to this exclusion criterion with the removal of the State Pension (Transition) Scheme from 1st January 2014. Persons aged 65 years can remain on a Jobseeker scheme up to their next birthday but are not included in the Live Register.
Reference Period
The reference periods for the Live Register results are as follows:
January 2015 – 27th December 2014 to 30th January 2015
January 2014 – 28th December 2013 to 31st January 2014
Unemployment statistics
The Live Register is not designed to measure unemployment. It includes part-time (those who work up to three days a week), seasonal and casual workers entitled to Jobseeker’s Allowance and or Jobseeker’s Benefit. Unemployment is measured by the Quarterly National Household Survey (formerly the Annual Labour Force Survey).
Standardised unemployment rates
The Standardised Unemployment Rate (SUR) series in Table 3 is based on the estimated number of persons unemployed expressed as a percentage of the total economically active population (i.e. the Labour Force), using internationally comparable definitions of employment and unemployment, as recommended by the International Labour Office.
Official estimates of the number of persons unemployed and the unemployment rate are produced from the Quarterly National Household Survey (QNHS). The QNHS is the only source of information on unemployment and employment which can apply standard International Labour Organisation (ILO) methodology to the estimation of these key indicators. The background notes of the QNHS release contain more information on the ILO criteria. Given the timelag required to produce estimates from the QNHS and the quarterly periodicity, short-term trends in the Live Register are used to estimate more up-to-date monthly unemployment rates.
The seasonally adjusted QNHS estimate of unemployment is used as a benchmark for February (Quarter 1 QNHS), May (Quarter 2 QNHS), August (Quarter 3 QNHS) and November (Quarter 4 QNHS) each year. The latest QNHS benchmark is updated using the trend in the seasonally adjusted Live Register to allow the estimation of the SUR. Once new QNHS data is available it is used to revise the SUR series. The assumption underlying this methodology is that over short periods the change in the seasonally adjusted Live Register will represent accurately the change in unemployment which will be seen from the QNHS. This methodology has been used since the QNHS was first initiated at the end of 1997.
QNHS
The Quarterly National Household Survey (QNHS), which began in September 1997, replaced the Labour Force Survey and provides quarterly estimates of the unemployment rate. Up to and including the fourth quarter of 2008 the QNHS operated on a seasonal quarter basis. As of the first quarter 2009 the QNHS is now undertaken on a calendar quarter basis.
The calendar reference quarters for survey results are:
Q1 - January to March, Q2 - April to June, Q3 - July to September and Q4 - October to December.
The calendar quarter estimates for Q3 2014 (adjusted for seasonality) are:
|
|
Q1 % |
Q2 % |
Q3 % |
Q4 % |
|
2009 |
10.2 |
12.1 |
12.6 |
13.0 |
|
2010 |
13.0 |
13.8 |
13.9 |
14.7 |
|
2011 |
14.4 |
14.4 |
14.8 |
14.9 |
|
2012 |
15.1 |
14.7 |
14.7 |
14.2 |
|
2013 |
13.7 |
13.5 |
12.7 |
12.2 |
|
2014 |
12.0 |
11.5 |
11.1 |
Seasonal Adjustment
Since January 2011 the seasonal adjustment of the Live Register is completed by applying the X-12-ARIMA model, developed by the U.S. Census Bureau. Seasonal adjustment is conducted using the indirect approach, where each individual series is independently adjusted (male under 25 years, female under 25 years, male 25 years and over and female 25 years and over). To preserve consistency between the individual and aggregate series, the series for gender, age group and total Live Register are then created from these four component series.
The X-12 ARIMA method has the X-11 moving averages process at its core, but builds on this by providing options for pre-treating the series using a regARIMA approach for prior adjustment and series extension. In essence this methodology will estimate seasonal factors while taking account of temporary changes, outliers, level shifts and calendar effects (e.g timing of Easter).
All Live Register series are updated monthly with the latest three years of seasonally adjusted data as part of the concurrent approach. The comprehensive annual review contains revisions to the entire series. Revisions to the series are typically very minor in scale.
For additional information on the use of X-12-ARIMA see detailed note in the January 2011 Live Register release.
Jobseeker’s Benefit Duration
Prior to 19 January 2004 Jobseeker’s Benefit was payable for 15 months (390 days).
From 19 January 2004, Jobseeker’s Benefit could be paid for a maximum of 15 months (390 days) to people who had at least 260 paid PRSI contributions. Jobseeker’s Benefit could be paid for a maximum of 12 months (312 days) to people who had less than 260 paid contributions (Refers to new claim).
From 15 October 2008, Jobseeker’s Benefit could be paid for a maximum of 12 months (312 days) to people who had at least 260 paid PRSI contributions. Jobseeker’s Benefit could be paid for a maximum of 9 months(234 days) to people who had less than 260 paid contributions.
As of 3 April 2013, Jobseeker’s Benefit can be paid for a maximum of 9 months (234 days) to people who have 260 paid PRSI contributions. Jobseeker’s Benefit can be paid for a maximum of 6 months (156 days) to people who have less than 260 paid contributions (Refers to new claims).
Claimants getting Jobseeker’s Benefit for 6 months or more on 3 April 2013 (or 3 months for people with fewer than 260 contributions) will not be affected.
One-Parent Family Payment (OFP)
The One-Parent Family Payment is a social welfare payment for men and women who are younger than 66 and bring up children without the support of a partner and meet certain other criteria. Claimants on this scheme are not counted as part of the Live Register.
From July 2013 new rules came into operation reducing the age limits for the One-Parent Family Payment. This means that some people no longer qualify for the payment and may avail of other schemes or supports.
As a consequence, approximately 2,800 people in July 2013 and 1,300 people in July 2014, previously receiving the One-Parent Family Payment, made a claim for Jobseekers Allowance (JA) and will therefore appear on the Live Register.
For information on the age-related changes to the OFP scheme from July 2013, please see the following link to the Department of Social Protection website:
http://www.welfare.ie/en/Pages/278_One-Parent-Family-Payment.aspx
Live Register Flows
Live Register flows data is sourced from information collected by the Department of Social Protection. The aggregate of new registrations for each month is used in conjunction with the net change over the same period to calculate the outflow from the register. A new registration is defined as anybody on the Live Register in a particular month who was not on it the previous month. Inflows and outflows published in this release do not take account of inter-scheme activity within the Live Register. For example, if a claimant exhausts his/her entitlement to JB and opens a new JA claim this is counted as an outflow in JB and an inflow in JA.
Live Register Area Analysis
The basis of the area analysis in Live Register statistics is the Department of Social Protection local office of registration. The areas served by Local Employment Offices do not correspond to specific geographic boundaries. Therefore, registrants at a given local office do not necessarily come from a particular region or area which can be precisely delineated e.g. data for the Cork City Local Office of Registration refers to all persons signing on in Cork City but may include persons not resident in Cork City. The latest available Live Register data by Province, County and Local Office of Registration will be released on the CSO website through the CSO StatBank one day after the publication of this release, see link here.
NUTS2 and NUTS3 regions
The Regional classifications are based on the NUTS (Nomenclature of Territorial Units) classification used by Eurostat. The NUTS3 regions correspond to the eight Regional Authorities established under the Local Government Act, 1991 (Regional Authorities) (Establishment) Order, 1993, which came into operation on 1 January 1994. The NUTS2 regions, which were proposed by Government and agreed by Eurostat in 1999, are groupings of the NUTS3 regions.
| Border, Midland and Western NUTS2 Region | Southern and Eastern NUTS2 Region | ||
| Border | Cavan | Dublin | Dublin City |
| Donegal | Dun Laoghaire-Rathdown | ||
| Leitrim | Fingal | ||
| Louth | South Dublin | ||
| Monaghan | |||
| Sligo | Mid-East | Kildare | |
| Meath | |||
| Midland | Laois | Wicklow | |
| Longford | Mid-West | Clare | |
| Offaly | Limerick City | ||
| Westmeath | Limerick County | ||
| North Tipperary | |||
| West | Galway City | ||
| Galway County | South-East | Carlow | |
| Mayo | Kilkenny | ||
| Roscommon | South Tipperary | ||
| Waterford City | |||
| Waterford County | |||
| Wexford | |||
| South-West | Cork City | ||
| Cork County | |||
| Kerry | |||
Occupations
Live Register occupational data is sourced from information collected by the Department of Social Protection on the most recent occupation of claimants when they sign on the Live Register. The classification used is based on the UK Standard Occupational Classification (SOC). “No occupation” is an additional category and includes those who have never worked and those who have no stated occupation.
Age by Duration Analysis
Detailed tables relating to regional and scheme data are available on the CSO website through the CSO Main Data Dissemination Service, StatBank, to see these please click here
Casual and part-time workers
The casual and part-time workers’ figure is based on data supplied by the Department of Social Protection. People may apply for Jobseeker’s Benefit or Jobseeker’s Allowance if they only work for part of a week and be included on the Live Register.
Nationality
Data in the nationality grouping table is sourced from information collected by the Department of Social Protection on the nationality of claimants when they first sign on the Live Register.
For further information or assistance use the contact details on the front page of the release or e-mail labour@cso.ie
 Hide Background Notes
Scan the QR code below to view this release online or go to
http://www.cso.ie/en/releasesandpublications/er/lr/liveregisterjanuary2015/
 Show Table 1(a) Total persons on the Live Register
 Hide Table 1(a) Total persons on the Live Register