
| Largest sectors by Net Selling Value, 2020 | ||
| €'000 | % | |
| Food products | 22,007,563 | 17.3% |
| Chemicals and chemical products | 20,346,689 | 16.0% |
| Basic pharmaceutical products and preparations | 53,004,710 | 41.7% |
| Other sectors | 31,874,356 | 25.1% |
| Total NSV | 127,233,318 | 100.0% |
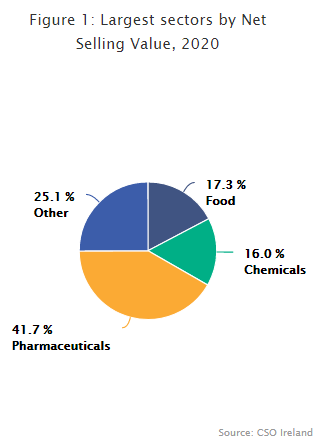
The largest three sectors accounted for 75.0% of all production in Ireland in 2020.
These three sectors had an aggregate Net Selling Value (NSV) of €95.4 billion, while the remaining sectors reported a value of €31.9 billion. This data is based on the annual "PRODCOM" survey of industrial enterprises employing 3 or more people.
Basic pharmaceutical products and preparations (€53.0 billion) accounted for the largest proportion of NSV in 2020 at 41.7%. This was followed by Food products (€22.0 billion) at 17.3% of NSV and Chemicals and chemical products with an NSV value of €20.3 billion (16.0%). See Figure 1 and Headline table.
Value of products manufactured and sold by Irish based enterprises down 5.5% to €127.2 billion in 2020
The total value of products manufactured in Ireland in 2020 was €127.2 billion. This was 5.5% less than the year 2019, when the total value of products manufactured in Ireland was €134.6 billion.
However, the value of products sold in Ireland in 2020 was 6.7% greater than in 2018, when total manufacturing in Ireland equalled €119.3 billion. See Table 1.
Annual domestic NSV decreased in all Irish Industrial sectors in 2020
Following the onset of the COVID-19 pandemic in Ireland during 2020, all industrial sectors experienced annual decreases in domestic NSV. The Transport equipment sector had the largest annual decrease (-15.9%) This was closely followed by Rubber and plastic products (-15.5%) and Textiles (-14.8%). The sectors which were least impacted by the COVID-19 pandemic in terms of domestic NSV were Pharmaceutical Products (-1.6%), Food products (-4.6%) and Chemical products (-4.7%). See Figure 2 and Tables 1 & 2.
| X-axis label | 2019 - 2020 |
|---|---|
| Pharmaceutical products | -1.6 |
| Food products | -4.6 |
| Chemical products | -4.7 |
| Paper and paper products | -6.3 |
| Other | -9.9 |
| Wood and wood products | -10.6 |
| Beverages | -11.7 |
| Mining & Quarrying | -11.9 |
| Basic metals, machinery and equipment n.e.c. | -14 |
| Computer,electronic,optical and electrical equipment | -14.2 |
| Textiles | -14.8 |
| Rubber and plastic products | -15.5 |
| Transport equipment | -15.9 |
Food & Beverage sector trends 2018 to 2020
In 2020, the value of all Food and Beverages products was €24.4 billion and represented a share of total NSV at 19.2%. These sectors had an NSV of €25.8 billion in 2019 and also accounted for 19.2% of total NSV, down from 21.8% in 2018, when NSV was valued at €26.0 billion. See Figure 3 and Tables 1 & 3.
| 2018 | 2019 | 2020 | |
| Mining & Quarrying | 0.6 | 0.4 | 0.4 |
| Food | 19.7 | 17.1 | 17.3 |
| Beverages | 2.1 | 2 | 1.9 |
| Textiles | 0.3 | 0.3 | 0.3 |
| Paper and paper products | 1.2 | 1.1 | 1.1 |
| Chemical products | 12.2 | 15.9 | 16 |
| Pharmaceutical products | 38.7 | 40 | 41.7 |
| Rubber and plastic products | 1.1 | 1 | 0.9 |
| Basic metals, machinery and equipment n.e.c. | 4.3 | 4.3 | 3.9 |
| Computer, electronic, optical and electrical equipment | 9.3 | 8.2 | 7.4 |
| Wood and wood products | 2.7 | 2.7 | 2.5 |
| Transport equipment | 0.4 | 0.4 | 0.3 |
| Other | 7.4 | 6.6 | 6.3 |
The Pharmaceutical sector reported NSV of €53.0 billion in 2020
Basic pharmaceutical products and preparations decreased by 1.6% from €53.9 billion in 2019 to €53.0 billion in 2020.
In terms of NSV, the three largest sectors of Food, Chemicals and Pharmaceutical products, accounted for 75.0% or €95.4 billion of total NSV in Ireland in 2020, up from 73.0% or €98.3 billion of total NSV in 2019. See Figure 4 and Table 1.
| X-axis label | Total NSV | Food, Chemical and Pharmaceutical sectors combined |
|---|---|---|
| 2019 | 134.6 | 98.3 |
| 2020 | 127.2 | 95.4 |
The value of EU Industrial production was less concentrated in 2020 than in Ireland
Irish Industrial production and sales were largely concentrated in four sectors when compared to the EU27. The Pharmaceutical sector (NACE 21) was the largest contributor in Ireland in 2020 with 41.7% of total NSV. In contrast, in the EU27 as a whole, the Pharmaceutical sector accounted for 4.1% of total NSV in 2020.
Data for the EU27 in 2020 was more evenly spread over a larger number of industrial sectors. The most dominant sectors in terms of NSV for the EU27 were Basic metals (22.6%), Food products (17.0%) and Transport equipment at 14.7%. See Figure 5 and Table 3.
| X-axis label | Ireland | EU27 |
|---|---|---|
| Mining & Quarrying | 0.4 | 0.7 |
| Food | 17.3 | 17 |
| Beverages | 1.9 | 2.6 |
| Textiles | 0.3 | 2.3 |
| Paper and paper products | 1.1 | 3.8 |
| Chemical products | 16 | 7.7 |
| Pharmaceutical products | 41.7 | 4.1 |
| Rubber and plastic products | 0.9 | 5 |
| Basic metals, machinery and equipment n.e.c. | 3.9 | 22.6 |
| Computer, electronic, optical and electrical equipment | 7.4 | 8 |
| Wood and wood products | 2.5 | 6.5 |
| Transport equipment | 0.3 | 14.7 |
| Other | 6.3 | 4.8 |
NSV generated by top 10 and top 50 Industrial enterprises
The Top 10 industrial enterprises accounted for 52.3% of all production in Ireland in 2020. These 10 enterprises had an aggregate Net Selling Value (NSV) of €66.6 billion, while the remaining 3,272 industrial enterprises reported €60.7 billion.
The Top 50 industrial enterprises in Ireland represented 76.2% of the overall NSV with a value of €96.9 billion. This highlights that the Manufacturing sector in Ireland is heavily reliant on a very small number of enterprises. See Figures 6a & 6b and Table 4.
| For long labels below use to display on multiple lines | Percentage |
|---|---|
| Other | 47.7 |
| Top 10 | 52.3 |
| For long labels below use to display on multiple lines | % |
|---|---|
| Other | 23.8 |
| Top 50 | 76.2 |
| Table 1 Total Net Selling Value of production by sector, 2018 - 2020 | |||
| 2018 | 2019 | 2020 | |
| €'000 | €'000 | €'000 | |
| Mining and Quarrying (05,06,07,08,09) | 677,538 | 596,954 | 525,912 |
| Food products (10) | 23,501,571 | 23,065,433 | 22,007,563 |
| Beverages (11) | 2,504,103 | 2,715,900 | 2,398,509 |
| Textiles, wearing apparel, leather and related products (13,14,15) | 355,112 | 374,754 | 319,181 |
| Paper and paper products (17,18) | 1,461,313 | 1,498,571 | 1,403,469 |
| Chemicals and chemical products (20) | 14,582,640 | 21,357,592 | 20,346,689 |
| Basic pharmaceutical products and preparations (21) | 46,112,176 | 53,859,334 | 53,004,710 |
| Rubber and plastic products (22) | 1,319,758 | 1,369,124 | 1,157,390 |
| Basic metals and fabricated metal products,machinery and equipment (24,25,28) | 5,179,304 | 5,810,517 | 4,994,626 |
| Computer,electronic,optical and electrical equipment (26,27) | 11,038,518 | 11,034,517 | 9,467,629 |
| Wood and wood products, other non-metallic mineral products, furniture (16,23,31) | 3,279,373 | 3,587,207 | 3,206,746 |
| Transport equipment (29,30) | 434,618 | 476,315 | 400,380 |
| Other (12,32,33) | 8,846,377 | 8,880,822 | 8,000,514 |
| Total NSV | 119,292,401 | 134,627,040 | 127,233,318 |
| Source: CSO | |||
| Table 2 Percentage breakdown of production by sector, 2018 - 2020 | |||
| 2018 | 2019 | 2020 | |
| % | % | % | |
| Mining and Quarrying (05,06,07,08,09) | 0.6 | 0.4 | 0.4 |
| Food products (10) | 19.7 | 17.1 | 17.3 |
| Beverages (11) | 2.1 | 2.0 | 1.9 |
| Textiles, wearing apparel, leather and related products (13,14,15) | 0.3 | 0.3 | 0.3 |
| Paper and paper products (17,18) | 1.2 | 1.1 | 1.1 |
| Chemicals and chemical products (20) | 12.2 | 15.9 | 16.0 |
| Basic pharmaceutical products and preparations (21) | 38.7 | 40.0 | 41.7 |
| Rubber and plastic products (22) | 1.1 | 1.0 | 0.9 |
| Basic metals and fabricated metal products,machinery and equipment (24,25,28) | 4.3 | 4.3 | 3.9 |
| Computer,electronic,optical and electrical equipment (26,27) | 9.3 | 8.2 | 7.4 |
| Wood and wood products, other non-metallic mineral products, furniture (16,23,31) | 2.7 | 2.7 | 2.5 |
| Transport equipment (29,30) | 0.4 | 0.4 | 0.3 |
| Other (12,32,33) | 7.4 | 6.6 | 6.3 |
| Total NSV | 100.0 | 100.0 | 100.0 |
| Source: CSO | |||
| Table 3 EU comparisons by Net Selling Value and percentage breakdown, 2020 | ||||
| Ireland | EU27 | Ireland | EU27 | |
| €'000 | €'000 | % | % | |
| Mining and Quarrying (05,06,07,08,09) | 525,912 | 31,855,616 | 0.4 | 0.7 |
| Food products (10) | 22,007,563 | 820,472,948 | 17.3 | 17.0 |
| Beverages (11) | 2,398,509 | 126,352,790 | 1.9 | 2.6 |
| Textiles, wearing apparel, leather and related products (13,14,15) | 319,181 | 110,360,534 | 0.3 | 2.3 |
| Paper and paper products (17,18) | 1,403,469 | 184,969,373 | 1.1 | 3.8 |
| Chemicals and chemical products (20) | 20,346,689 | 373,215,777 | 16.0 | 7.7 |
| Basic pharmaceutical products and preparations (21) | 53,004,710 | 199,090,041 | 41.7 | 4.1 |
| Rubber and plastic products (22) | 1,157,390 | 243,131,431 | 0.9 | 5.0 |
| Basic metals and fabricated metal products,machinery and equipment (24,25,28) | 4,994,626 | 1,090,719,748 | 3.9 | 22.6 |
| Computer,electronic,optical and electrical equipment (26,27) | 9,467,629 | 383,883,936 | 7.4 | 8.0 |
| Wood and wood products, other non-metallic mineral products, furniture (16,23,31) | 3,206,746 | 313,939,709 | 2.5 | 6.5 |
| Transport equipment (29,30) | 400,380 | 707,049,094 | 0.3 | 14.7 |
| Other (12,32,33) | 8,000,514 | 232,874,962 | 6.3 | 4.8 |
| Total NSV | 127,233,318 | 4,817,915,960 | 100.0 | 100.0 |
| Source: Eurostat @ 15th July 2021 and CSO | ||||
| Table 4 Net Selling Value 2020 - Top 10 and Top 50 enterprises | ||||||
| €'000 | % | €'000 | % | |||
| Top 10 enterprises | 66,573,007 | 52.3% | Top 50 enterprises | 96,942,874 | 76.2% | |
| Other enterprises | 60,660,311 | 47.7% | Other enterprises | 30,290,444 | 23.8% | |
| Total NSV | 127,233,318 | 100.0% | Total NSV | 127,233,318 | 100.0% | |
Irish Industrial Production by Sector
Data for this survey is collected under the name of PRODCOM, but is currently published under the title of Irish Industrial Production by Sector.
Introduction to PRODCOM
This report presents results for the annual PRODCOM Inquiry conducted by the Central Statistics Office (CSO). This is an annual survey of the value and volume of products produced by industrial enterprises in Ireland and sold during the reference year. It is carried out in compliance with the European Community (EC) Council Regulation on the Establishment of a Community Survey of Industrial Production (No. 3924/91). The results are presented using a harmonised EU product classification called PRODCOM. The title comes from the French term "PRODuction COMmunautaire" (Community Production).
Appreciation is extended to all enterprises that co-operated with this annual inquiry.
Scope and Coverage
The survey covers all industrial enterprises with three or more persons engaged which are wholly or primarily engaged in industrial production and industrial services in the Mining, Quarrying and Manufacturing industries. The survey does not cover the following sectors and products:
• products of coal and lignite mining
• coke and refined petroleum products
Survey Organisation
Customised questionnaires are issued to enterprises on an annual basis, seeking information at a detailed level on the products sold in the previous year, irrespective of the year of manufacture. A residual category is included in each questionnaire for the recording of new products. The details returned are classified by reference to the PRODCOM classification. Individual questionnaires are updated annually to distinguish the particular products produced by each enterprise.
Product Groupings
In the PRODCOM classification products are grouped by the NACE Rev.2 four digit industrial sectors in which they are primarily produced (i.e. characteristic products). NACE Rev.2 is the EU system for classifying economic activities.
The value and volume data shown for a product includes not only the production by enterprises classified to the NACE sector where it is primarily produced but also its production by enterprises classified to other NACE Rev.2 sectors.
Classification of Products
The business activity classification used in this publication is based on the Statistical Classification of Economic Activities in the European Community i.e. NACE Rev. 2. Prior to 2008 PRODCOM publications were based on the NACE Rev.1.1 classification.
The PRODCOM classification is organised into product divisions and classes corresponding to the sectoral divisions (2 digit) of NACE Rev.2. It uses an eight-digit product code - XX.XX.XX.XX. The first four digits of the code correspond to the 4-digit classes of NACE Rev.2. The first six digits are the European Community Classification of Products by Activity (CPA) codes. The CPA provides a detailed listing of the characteristic products for each 4-digit NACE Rev.2 economic activity. The last two digits provide a more detailed breakdown of the CPA classes into PRODCOM product headings.
There is a direct link between the PRODCOM classification and the EU foreign trade Harmonised System/Combined Nomenclature (HS/CN) classification. Each PRODCOM 8-digit heading covers one or more HS/CN 8-digit headings. The following example shows the link between all the different classifications:
PRODCOM Description Foreign Trade HS/CN code
10.12.10.10 Fresh or chilled whole chickens 0207.11
The PRODCOM code 10.12.10.10 covers the same products as HS/CN code 0207.11, which is the code in foreign trade statistics under which imports and exports of chickens appear. Thus, for any product a direct link can be made for its production (PRODCOM code) and its imports and exports (HS/CN code) to derive domestic consumption (production plus imports minus exports). This in turn can be linked to the sector of economic activity.
As described above PRODCOM data may be combined with foreign trade data (imports and exports) to derive apparent domestic consumption. Apparent consumption is calculated by adding imports to domestic production and subtracting exports. This approximation may be of limited value in some instances due to the need to suppress details to preserve confidentiality, timing differences between PRODCOM and foreign trade data, or different valuation methods.
Variables
The data covers the value and volume of products manufactured and sold by enterprises, irrespective of the year of manufacture. Also included are the fees earned by the enterprises for industrial services provided and work done on commission.
Value relates to the net selling value, excluding VAT, invoiced to customers. It excludes duties and taxes payable on the goods such as excise duties, separately charged freight costs, discounts and goods resold without any further processing.
Estimation for Non-Response
Details for key non-respondents were estimated using turnover data from other CSO surveys, principally the Monthly Industrial Production Inquiry. Total turnover was disaggregated, where possible, by reference to the product mix details supplied by the non-respondents to an earlier PRODCOM inquiry. In all other cases, both volume and value are imputed by the IT system.
In the case of respondents, estimates for missing volumes have been made in certain cases by using the average unit price from the respondent firms. In other cases it was not possible to estimate for missing volumes.
Confidentiality
The information provided by enterprises is treated as strictly confidential in accordance with national and EU law. Rules are applied to both the value and volume data of each individual product or service to identify confidential data. Direct or indirect disclosure of information relating to identifiable respondents is avoided by suppressing confidential data. Individual products which are confidential are identified by -99,999,999.
|
LEXICON OF ABBREVIATIONS |
|
|
< = |
Less than or equal to |
|
= > |
Greater than or equal to |
|
ABS |
Acrylonitril-Butadiene-Styrene |
|
CVD |
Chemical Vapour Deposition |
|
PVD |
Physical Vapour Deposition |
|
HS |
Harmonized System |
|
CN |
Combined Nomenclature |
|
CG |
centigram |
|
CM3 |
cubic centimetre |
|
KVAR |
kilovar |
|
KV |
kilovolt |
|
MM |
millimetre |
|
MPA |
megapascal |
|
T |
tonne |
|
EXCL. |
excluding |
|
INCL. |
including |
|
N.E.C. |
not elsewhere classified |
|
N.P.R.S. |
not packaged for retail sale |
|
P.R.S. |
packaged for retail sale |
|
V.Q.P.R.D. |
vin de qualité produit dans une région déterminée (Quality wines produced in specified regions) |
|
S |
supressed (unreliable) |
|
-- |
Under the HS/CN heading, this denotes the absence of a tariff code from the current Prodcom list |
|
LIST OF UNITS |
|
|
GT |
Gross Tonnage |
|
CE/EL |
Number of elements |
|
G |
Gram |
|
KG |
Kilogram |
|
KWh |
Kilowatt hours |
|
KW |
Kilowatt |
|
L |
Litre |
|
M |
Metre |
|
M2 |
Square metre |
|
M3 |
Cubic metre |
|
PA |
Number of pairs |
|
P/ST |
Number of items |
|
- |
No unit |
|
CK |
Carats |
|
TJ |
Terajoule (gross calorific value) |
(1) Definition
Net Selling Value
The value of sales for each product relates to the net selling value i.e. the net amount (excluding VAT) invoiced to customers.
This value includes amounts charged by enterprises to customers for transport of goods by their own vehicles and packaging costs.
Excluded from this definition are:
• duties and taxes payable on the goods e.g. excise duties
• separately charged freight costs
• any discounts granted to customers
• goods resold with further processing i.e. goods merchanted or factored
(2) Products
(3) Prodcom
PRODCOM is the title of the European Community (EC) production statistics for Mining, Quarrying and Manufacturing, i.e. Section B and C of the Statistical Classification of Economic Activities in the European Community (NACE Rev. 2). The title comes from the French "PRODuction COMmunautaire" (Community production).
The basis of the survey is Council Regulation (EEC) No. 3924/91 on the establishment of a Community survey of industrial production (PRODCOM Regulation). In accordance with Article 2(2) of the above-mentioned Regulation, production is to be recorded according to the product headings of the PRODCOM list.
The list does not include the products of coal and lignite mining, extraction of crude petroleum and natural gas, manufacture of coke and refined petroleum products (Divisions 05, 06 and 19 of NACE Rev. 2), since they are already covered in a separate set of Community statistics.
 Hide Background Notes
Scan the QR code below to view this release online or go to
http://www.cso.ie/en/releasesandpublications/er/iips/irishindustrialproductionbysector2020/
 Show Table 1 Total Net Selling Value of production by sector, 2018 - 2020
 Hide Table 1 Total Net Selling Value of production by sector, 2018 - 2020