
| € billion | ||||||
| 31 December 2012 | 31 March 2013 | |||||
| Assets | Liabilities | NET | Assets | Liabilities | NET | |
| General Government | 7.5 | 124.0 | -116.4 | 8.9 | 130.9 | -122.0 |
| Monetary Authority | 17.7 | 79.3 | -61.6 | 18.2 | 60.1 | -41.9 |
| Monetary Financial Institutions | 707.3 | 700.5 | 6.8 | 686.5 | 693.0 | -6.5 |
| Other Financial Intermediaries | 1,805.3 | 1,727.9 | 77.4 | 1,928.4 | 1,849.8 | 78.5 |
| Non-Financial Companies | 280.3 | 364.0 | -83.7 | 296.2 | 384.9 | -88.7 |
| Total | 2,818.2 | 2,995.6 | -177.5 | 2,938.2 | 3,118.7 | -180.6 |
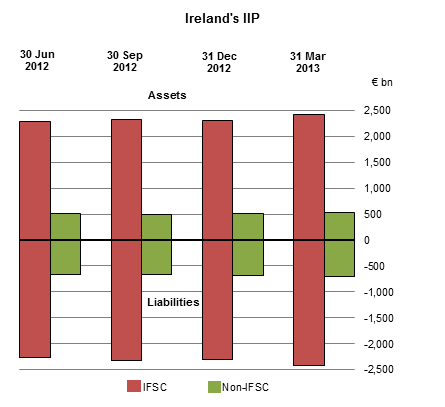
At 31st March 2013, Ireland’s quarterly international investment position (IIP) results show overall stocks of foreign financial assets of €2,938.2bn – an increase of €120.0bn from the end-December 2012 level, while the corresponding stocks of foreign financial liabilities increased by €123.1bn to €3,118.7bn over the quarter. Irish residents had an overall net foreign liability of €180.6bn at end-March 2013, an increase on the net foreign liability level as at end-December 2012 – see Table 1a.
Some points of note in the end-March 2013 quarterly IIP are:
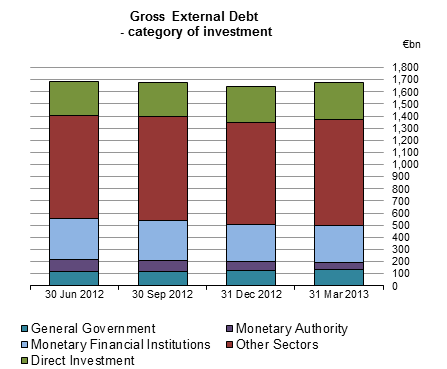
Gross External Debt is €1,675.8 billion at end-March 2013
At 31st March 2013, the gross external debt of all resident sectors (i.e. general government, the monetary authority, financial and non-financial corporations and households) amounted to €1,675.8bn. This represents a increase of €35.8bn in the stock of financial liabilities to non-residents (other than those arising from issues of Irish equities and derivatives contracts) compared to the level shown at 31st December 2012 (€1,640.0bn) – see Table 6a. Points of note are:
The results for Quarter 1 2013 incorporate revisions to Quarter 4 2012. Revisions for the remaining quarters of 2012 and for all quarters of 2011 will be incorporated in the Quarter 2 2013 International Investment Position and External Debt release.
| Table 1(a) International Investment Position (IIP) classified by Financial Instrument | € million | ||||||||
| Item | Q1 2011 | Q2 2011 | Q3 2011 | Q4 2011 | Q1 2012 | Q2 2012 | Q3 2012 | Q4 2012 1 | Q1 2013 |
| Foreign Assets | |||||||||
| Direct Investment Abroad 2 | 252,851 | 251,985 | 239,103 | 242,494 | 255,869 | 261,039 | 271,878 | 288,027 | 303,295 |
| Portfolio Investment | 1,420,594 | 1,364,297 | 1,359,620 | 1,432,908 | 1,542,059 | 1,528,164 | 1,566,401 | 1,588,982 | 1,674,699 |
| Other Investment 3 | 910,632 | 955,391 | 1,016,991 | 1,005,754 | 905,847 | 991,745 | 984,820 | 939,853 | 958,884 |
| Reserve Assets | 1,474 | 1,498 | 1,570 | 1,316 | 1,285 | 1,333 | 1,347 | 1,294 | 1,298 |
| Total Foreign Assets | 2,585,551 | 2,573,171 | 2,617,284 | 2,682,472 | 2,705,060 | 2,782,281 | 2,824,446 | 2,818,156 | 2,938,176 |
| Foreign Liabilities | |||||||||
| Direct Investment in Ireland 2 | 216,522 | 211,910 | 226,653 | 194,508 | 206,520 | 212,551 | 225,810 | 256,410 | 279,038 |
| Portfolio Investment | 1,644,239 | 1,643,505 | 1,632,959 | 1,725,510 | 1,779,529 | 1,814,920 | 1,862,923 | 1,905,521 | 1,988,113 |
| Other Investment 3 | 877,629 | 844,805 | 905,280 | 915,074 | 880,486 | 907,092 | 892,375 | 833,680 | 851,588 |
| Total Foreign Liabilities | 2,738,390 | 2,700,220 | 2,764,892 | 2,835,092 | 2,866,535 | 2,934,563 | 2,981,108 | 2,995,611 | 3,118,739 |
| Net International Investment Position (IIP) | |||||||||
| Direct Investment 2 | 36,329 | 40,075 | 12,450 | 47,986 | 49,349 | 48,488 | 46,068 | 31,617 | 24,257 |
| Portfolio Investment | -223,645 | -279,208 | -273,339 | -292,602 | -237,470 | -286,756 | -296,522 | -316,539 | -313,414 |
| Other Investment 3 | 33,003 | 110,586 | 111,711 | 90,680 | 25,361 | 84,653 | 92,445 | 106,173 | 107,296 |
| Reserve Assets | 1,474 | 1,498 | 1,570 | 1,316 | 1,285 | 1,333 | 1,347 | 1,294 | 1,298 |
| Total (Net IIP) | -152,839 | -127,049 | -147,608 | -152,620 | -161,475 | -152,282 | -156,662 | -177,455 | -180,563 |
| 1Revised. | |||||||||
| 2Reflecting the so-called directional principle for reclassifying Direct Investment (see background notes). | |||||||||
| 3Includes financial derivatives and trade credits; in the case of liabilities this category also includes life insurance liabilities to non-residents. | |||||||||
| Table 1(b) International Investment Position (IIP) classified by Institutional Sector | € million | ||||||||
| Item | Q1 2011 | Q2 2011 | Q3 2011 | Q4 2011 | Q1 2012 | Q2 2012 | Q3 2012 | Q4 2012 1 | Q1 2013 |
| Foreign Assets | |||||||||
| General Government | 9,977 | 4,687 | 5,186 | 5,382 | 6,058 | 5,758 | 6,092 | 7,542 | 8,945 |
| Monetary Authority 2 | 17,592 | 17,692 | 19,092 | 19,037 | 19,929 | 22,812 | 17,569 | 17,695 | 18,162 |
| Monetary Financial Institutions 3 | 876,592 | 849,400 | 891,725 | 800,251 | 748,548 | 770,107 | 762,456 | 707,336 | 686,490 |
| Other Sectors 4 | 1,681,390 | 1,701,394 | 1,701,282 | 1,857,801 | 1,930,526 | 1,983,605 | 2,038,326 | 2,085,582 | 2,224,580 |
| of which: | |||||||||
| Other Financial Intermediaries | 1,445,363 | 1,461,779 | 1,474,573 | 1,626,956 | 1,686,185 | 1,733,368 | 1,778,431 | 1,805,276 | 1,928,359 |
| Non-Financial Companies 5 | 236,027 | 239,615 | 226,709 | 230,845 | 244,341 | 250,237 | 259,895 | 280,306 | 296,221 |
| Total Foreign Assets | 2,585,551 | 2,573,171 | 2,617,284 | 2,682,472 | 2,705,060 | 2,782,281 | 2,824,446 | 2,818,156 | 2,938,176 |
| Foreign Liabilities | |||||||||
| General Government | 95,168 | 98,320 | 102,660 | 103,889 | 109,256 | 114,315 | 121,731 | 123,981 | 130,938 |
| Monetary Authority 2 | 139,646 | 128,675 | 123,341 | 120,456 | 96,027 | 100,119 | 84,437 | 79,281 | 60,088 |
| Monetary Financial Institutions 3 | 810,709 | 785,516 | 838,320 | 746,649 | 715,536 | 738,440 | 730,763 | 700,504 | 692,976 |
| Other Sectors 4 | 1,692,866 | 1,687,710 | 1,700,570 | 1,864,098 | 1,945,717 | 1,981,689 | 2,044,178 | 2,091,844 | 2,234,735 |
| of which: | |||||||||
| Other Financial Intermediaries | 1,395,633 | 1,387,030 | 1,409,579 | 1,566,228 | 1,628,446 | 1,655,442 | 1,712,392 | 1,727,852 | 1,849,835 |
| Non-Financial Companies 5 | 297,233 | 300,680 | 290,991 | 297,870 | 317,271 | 326,247 | 331,786 | 363,992 | 384,900 |
| Total Foreign Liabilities | 2,738,390 | 2,700,220 | 2,764,892 | 2,835,092 | 2,866,535 | 2,934,563 | 2,981,108 | 2,995,611 | 3,118,739 |
| Net International Investment Position (IIP) | |||||||||
| General Government | -85,191 | -93,633 | -97,474 | -98,507 | -103,198 | -108,557 | -115,639 | -116,439 | -121,993 |
| Monetary Authority 2 | -122,054 | -110,983 | -104,249 | -101,419 | -76,098 | -77,307 | -66,868 | -61,586 | -41,926 |
| Monetary Financial Institutions 3 | 65,883 | 63,884 | 53,405 | 53,602 | 33,012 | 31,667 | 31,693 | 6,832 | -6,486 |
| Other Sectors 4 | -11,476 | 13,684 | 712 | -6,297 | -15,191 | 1,916 | -5,852 | -6,262 | -10,155 |
| of which: | |||||||||
| Other Financial Intermediaries | 49,730 | 74,749 | 64,994 | 60,728 | 57,739 | 77,926 | 66,039 | 77,424 | 78,524 |
| Non-Financial Companies 5 | -61,206 | -61,065 | -64,282 | -67,025 | -72,930 | -76,010 | -71,891 | -83,686 | -88,679 |
| Total (Net IIP) | -152,839 | -127,049 | -147,608 | -152,620 | -161,475 | -152,282 | -156,662 | -177,455 | -180,563 |
| 1Revised. | |||||||||
| 2Central Bank of Ireland. | |||||||||
| 3Covering licensed credit institutions and money market funds. | |||||||||
| 4Other sectors includes financial corporations other than the Monetary Authority and Monetary Financial Institutions, non-financial service and manufacturing companies and other industrial enterprises as well as (implicitly) households (see Background Notes). The gross liabilities to non-residents of financial corporations covered in other sectors tend to be very significant. | |||||||||
| 5Including households. | |||||||||
| Table 2 International Investment Position (IIP) - IFSC and non-IFSC activity by Institutional Sector | € million | ||||||
| 31 Dec 2012 1 | 31 Mar 2013 | ||||||
| Item | IFSC | Non-IFSC | Total | IFSC | Non-IFSC | Total | |
| Foreign Assets | |||||||
| General Government | 0 | 7,542 | 7,542 | 0 | 8,945 | 8,945 | |
| Monetary Authority 2 | 0 | 17,695 | 17,695 | 0 | 18,162 | 18,162 | |
| Monetary Financial Institutions 3 | 588,417 | 118,919 | 707,336 | 577,695 | 108,795 | 686,490 | |
| Other Sectors 4 | 1,719,564 | 366,018 | 2,085,582 | 1,839,682 | 384,898 | 2,224,580 | |
| of which: | |||||||
| Other Financial Intermediaries | 1,719,564 | 85,712 | 1,805,276 | 1,839,682 | 88,677 | 1,928,359 | |
| Non-Financial Companies 5 | 0 | 280,306 | 280,306 | 0 | 296,221 | 296,221 | |
| Total Foreign Assets | 2,307,981 | 510,175 | 2,818,156 | 2,417,377 | 520,799 | 2,938,176 | |
| Foreign Liabilities | |||||||
| General Government | 0 | 123,981 | 123,981 | 0 | 130,938 | 130,938 | |
| Monetary Authority 2 | 0 | 79,281 | 79,281 | 0 | 60,088 | 60,088 | |
| Monetary Financial Institutions 3 | 583,684 | 116,820 | 700,504 | 578,591 | 114,385 | 692,976 | |
| Other Sectors 4 | 1,721,860 | 369,984 | 2,091,844 | 1,843,513 | 391,222 | 2,234,735 | |
| of which: | |||||||
| Other Financial Intermediaries | 1,721,860 | 5,992 | 1,727,852 | 1,843,513 | 6,322 | 1,849,835 | |
| Non-Financial Companies 5 | 0 | 363,992 | 363,992 | 0 | 384,900 | 384,900 | |
| Total Foreign Liabilities | 2,305,544 | 690,067 | 2,995,611 | 2,422,104 | 696,635 | 3,118,739 | |
| Net International Investment Position (IIP) | |||||||
| General Government | 0 | -116,439 | -116,439 | 0 | -121,993 | -121,993 | |
| Monetary Authority 2 | 0 | -61,586 | -61,586 | 0 | -41,926 | -41,926 | |
| Monetary Financial Institutions 3 | 4,733 | 2,099 | 6,832 | -896 | -5,590 | -6,486 | |
| Other Sectors 4 | -2,296 | -3,966 | -6,262 | -3,831 | -6,324 | -10,155 | |
| of which: | |||||||
| Other Financial Intermediaries | -2,296 | 79,720 | 77,424 | -3,831 | 82,355 | 78,524 | |
| Non-Financial Companies 5 | 0 | -83,686 | -83,686 | 0 | -88,679 | -88,679 | |
| Total (Net IIP) | 2,437 | -179,892 | -177,455 | -4,727 | -175,836 | -180,563 | |
| 1Revised. | |||||||
| 2Central Bank of Ireland. | |||||||
| 3Covering licensed credit institutions and money market funds. | |||||||
| 4Other sectors includes financial corporations other than the Monetary Authority and Monetary Financial Institutions, non-financial service and manufacturing companies and other industrial enterprises as well as (implicitly) households (see Background Notes). The gross liabilities to non-residents of financial corporations covered in other sectors tend to be very significant. | |||||||
| 5Including households. | |||||||
| Table 3(a) International Investment Position (IIP) - Detailed Data | € million | |||
| Item | Q2 2012 | Q3 2012 | Q4 2012 1 | Q1 2013 |
| Foreign Assets | ||||
| Direct Investment Abroad 2 | 261,039 | 271,878 | 288,027 | 303,295 |
| Equity capital and reinvested earnings | 222,478 | 234,459 | 241,282 | 255,784 |
| Other capital | 38,561 | 37,419 | 46,745 | 47,511 |
| Portfolio Investment | 1,528,164 | 1,566,401 | 1,588,982 | 1,674,699 |
| Equity | 474,187 | 486,668 | 503,819 | 541,875 |
| Monetary authority 3 | 0 | 0 | 0 | 0 |
| General government | 4,242 | 4,359 | 4,283 | 4,530 |
| Monetary financial institutions 4 | 3,113 | 1,225 | 1,379 | 1,952 |
| Other sectors | 466,832 | 481,085 | 498,157 | 535,391 |
| Debt instruments | 1,053,977 | 1,079,733 | 1,085,164 | 1,132,825 |
| Bonds and notes | 746,591 | 766,175 | 802,296 | 831,250 |
| Monetary authority 3 | 10,522 | 11,173 | 12,217 | 13,808 |
| General government | 275 | 291 | 301 | 334 |
| Monetary financial institutions 4 | 181,492 | 180,621 | 188,228 | 174,751 |
| Other sectors | 554,302 | 574,091 | 601,551 | 642,357 |
| Money market instruments | 307,386 | 313,558 | 282,868 | 301,575 |
| Monetary authority 3 | 4,647 | 4,758 | 4,032 | 2,290 |
| General government | 0 | 0 | 0 | 0 |
| Monetary financial institutions 4 | 184,742 | 195,254 | 173,725 | 177,432 |
| Other sectors | 117,996 | 113,546 | 105,110 | 121,853 |
| Other Investment | 991,745 | 984,820 | 939,853 | 958,884 |
| Loans, currency and deposits | 795,109 | 787,759 | 745,629 | 739,128 |
| Monetary authority 3 | 6,386 | 176 | 144 | 766 |
| General government | 1,910 | 2,362 | 3,922 | 4,785 |
| Monetary financial institutions 4 | 335,086 | 324,431 | 290,575 | 285,127 |
| Other sectors | 451,727 | 460,790 | 450,988 | 448,450 |
| Trade Credits | 39,292 | 36,763 | 40,134 | 40,452 |
| General government | 0 | 0 | 0 | 0 |
| Other sectors | 39,292 | 36,763 | 40,134 | 40,452 |
| Other assets 5 | 157,343 | 160,297 | 154,089 | 179,302 |
| Monetary authority 3 | -76 | 115 | 8 | 0 |
| General government | -669 | -920 | -963 | -705 |
| Monetary financial institutions 4 | 59,868 | 55,272 | 48,493 | 42,472 |
| Other sectors | 98,220 | 105,830 | 106,551 | 137,535 |
| Reserve assets | 1,333 | 1,347 | 1,294 | 1,298 |
| Monetary gold | 241 | 266 | 244 | 242 |
| Special drawing rights | 777 | 771 | 748 | 752 |
| Reserve Position in the IMF | 312 | 309 | 301 | 302 |
| Foreign Exchange | 3 | 1 | 1 | 2 |
| Other | 0 | 0 | 0 | 0 |
| Total Foreign Assets | 2,782,281 | 2,824,446 | 2,818,156 | 2,938,176 |
| 1Revised. | ||||
| 2Reflecting the so-called directional principle for reclassifying Direct Investment (see background notes). | ||||
| 3Central Bank of Ireland. | ||||
| 4Covering licensed credit institutions and money market funds. | ||||
| 5Includes financial derivatives. | ||||
| Table 3(b) International Investment Position (IIP) - Detailed Data | € million | |||
| Item | Q2 2012 | Q3 2012 | Q4 2012 1 | Q1 2013 |
| Foreign Liabilities | ||||
| Direct Investment in Ireland 2 | 212,551 | 225,810 | 256,410 | 279,038 |
| Equity capital and reinvested earnings | 220,176 | 228,690 | 255,996 | 274,450 |
| Other capital | -7,625 | -2,880 | 415 | 4,588 |
| Portfolio Investment | 1,814,920 | 1,862,923 | 1,905,521 | 1,988,113 |
| Equity | 1,252,265 | 1,294,843 | 1,333,870 | 1,412,686 |
| Monetary authority 3 | 0 | 0 | 0 | 0 |
| General government | 0 | 0 | 0 | 0 |
| Monetary financial institutions 4 | 293,682 | 293,984 | 286,960 | 282,593 |
| Other sectors | 958,583 | 1,000,859 | 1,046,909 | 1,130,092 |
| Debt instruments | 562,655 | 568,081 | 571,651 | 575,428 |
| Bonds and notes | 554,105 | 558,590 | 553,044 | 555,018 |
| Monetary authority 3 | 0 | 0 | 0 | 0 |
| General government | 61,926 | 65,552 | 64,464 | 69,477 |
| Monetary financial institutions 4 | 53,046 | 52,238 | 48,376 | 47,875 |
| Other sectors | 439,132 | 440,800 | 440,204 | 437,664 |
| Money market instruments | 8,550 | 9,491 | 18,607 | 20,410 |
| Monetary authority 3 | 0 | 0 | 0 | 0 |
| General government | 1,117 | 1,230 | 2,265 | 2,933 |
| Monetary financial institutions 4 | 404 | 1,138 | 9,886 | 11,124 |
| Other sectors | 7,029 | 7,122 | 6,457 | 6,353 |
| Other Investment | 907,092 | 892,375 | 833,680 | 851,588 |
| Loans, currency and deposits | 659,248 | 634,914 | 596,411 | 591,146 |
| Monetary authority 3 | 100,092 | 84,413 | 79,259 | 60,059 |
| General government | 51,272 | 54,949 | 57,253 | 58,528 |
| Monetary financial institutions 4 | 281,377 | 269,734 | 236,437 | 238,616 |
| Other sectors | 226,507 | 225,818 | 223,462 | 233,943 |
| Trade Credits | 15,679 | 15,613 | 16,499 | 16,051 |
| General government | 0 | 0 | 0 | 0 |
| Other sectors | 15,679 | 15,613 | 16,499 | 16,051 |
| Other liabilities 5 | 232,166 | 241,849 | 220,771 | 244,391 |
| Monetary authority 3 | 27 | 24 | 22 | 29 |
| General government | 0 | 0 | 0 | 0 |
| Monetary financial institutions 4 | 68,798 | 67,452 | 59,243 | 50,769 |
| Other sectors | 163,341 | 174,373 | 161,506 | 193,593 |
| Total Foreign Liabilities | 2,934,563 | 2,981,108 | 2,995,611 | 3,118,739 |
| 1Revised | ||||
| 2Reflecting the so-called directional principle for reclassifying Direct Investment (see background notes). | ||||
| 3Central Bank of Ireland. | ||||
| 4Covering licensed credit institutions and money market funds. | ||||
| 5Includes financial derivatives and also includes life insurance liabilities to non-residents. | ||||
| Table 4 International Investment Position (IIP) showing IFSC and Non–IFSC activity | € million | |||
| Item | Q2 2012 | Q3 2012 | Q4 2012 1 | Q1 2013 |
| Foreign Assets | ||||
| Direct Investment Abroad 2 | 261,039 | 271,878 | 288,027 | 303,295 |
| - IFSC | 29,227 | 30,697 | 30,954 | 31,746 |
| - Non-IFSC | 231,812 | 241,181 | 257,073 | 271,549 |
| Portfolio Investment | 1,528,164 | 1,566,401 | 1,588,982 | 1,674,699 |
| - IFSC | 1,404,174 | 1,441,481 | 1,464,041 | 1,547,796 |
| - Non-IFSC | 123,990 | 124,920 | 124,941 | 126,903 |
| Other Investment 3 | 991,745 | 984,820 | 939,853 | 958,884 |
| - IFSC | 845,789 | 854,809 | 812,986 | 837,835 |
| - Non-IFSC | 145,956 | 130,011 | 126,867 | 121,049 |
| Reserve Assets | 1,333 | 1,347 | 1,294 | 1,298 |
| - IFSC | 0 | 0 | 0 | 0 |
| - Non-IFSC | 1,333 | 1,347 | 1,294 | 1,298 |
| Total Foreign Assets | 2,782,281 | 2,824,446 | 2,818,156 | 2,938,176 |
| - IFSC | 2,279,190 | 2,326,987 | 2,307,981 | 2,417,377 |
| - Non-IFSC | 503,091 | 497,459 | 510,175 | 520,799 |
| Foreign Liabilities | ||||
| Direct Investment in Ireland 2 | 212,551 | 225,810 | 256,410 | 279,038 |
| - IFSC | 92,646 | 102,692 | 98,847 | 107,410 |
| - Non-IFSC | 119,905 | 123,118 | 157,563 | 171,628 |
| Portfolio Investment | 1,814,920 | 1,862,923 | 1,905,521 | 1,988,113 |
| - IFSC | 1,587,363 | 1,622,457 | 1,657,951 | 1,727,891 |
| - Non-IFSC | 227,557 | 240,466 | 247,570 | 260,222 |
| Other Investment 3 | 907,092 | 892,375 | 833,680 | 851,588 |
| - IFSC | 593,192 | 598,031 | 548,746 | 586,803 |
| - Non-IFSC | 313,900 | 294,344 | 284,934 | 264,785 |
| Total Foreign Liabilities | 2,934,563 | 2,981,108 | 2,995,611 | 3,118,739 |
| - IFSC | 2,273,201 | 2,323,180 | 2,305,544 | 2,422,104 |
| - Non-IFSC | 661,362 | 657,928 | 690,067 | 696,635 |
| Net International Investment Position (IIP) | ||||
| Direct Investment 2 | 48,488 | 46,068 | 31,617 | 24,257 |
| - IFSC | -63,419 | -71,995 | -67,893 | -75,664 |
| - Non-IFSC | 111,907 | 118,063 | 99,510 | 99,921 |
| Portfolio Investment | -286,756 | -296,522 | -316,539 | -313,414 |
| - IFSC | -183,189 | -180,976 | -193,910 | -180,095 |
| - Non-IFSC | -103,567 | -115,546 | -122,629 | -133,319 |
| Other Investment 3 | 84,653 | 92,445 | 106,173 | 107,296 |
| - IFSC | 252,597 | 256,778 | 264,240 | 251,032 |
| - Non-IFSC | -167,944 | -164,333 | -158,067 | -143,736 |
| Reserve Assets | 1,333 | 1,347 | 1,294 | 1,298 |
| - IFSC | 0 | 0 | 0 | 0 |
| - Non-IFSC | 1,333 | 1,347 | 1,294 | 1,298 |
| Total (Net IIP) | -152,282 | -156,662 | -177,455 | -180,563 |
| - IFSC | 5,989 | 3,807 | 2,437 | -4,727 |
| - Non-IFSC | -158,271 | -160,469 | -179,892 | -175,836 |
| 1Revised. | ||||
| 2Reflecting the so-called directional principle for reclassifying Direct Investment (see background notes). | ||||
| 3Includes financial derivatives and trade credits; in the case of liabilities this category also includes life insurance liabilities to Non-residents. | ||||
| Table 5 International Investment Position (IIP) - 31 March 2013- Reconciliation of IIP and BOP Flows | € million | ||||||
| Item | Opening Position 01/01/13 1 | Bop Flows in Quarter | Valuation and Other Changes | Closing Position 31/03/13 | |||
| Foreign Assets | |||||||
| Direct Investment Abroad 2 | 288,027 | 9,855 | 5,413 | 303,295 | |||
| Equity capital and reinvested earnings | 241,282 | 9,795 | 4,707 | 255,784 | |||
| Other capital | 46,745 | 60 | 706 | 47,511 | |||
| Portfolio Investment | 1,588,982 | 56,918 | 28,799 | 1,674,699 | |||
| Equity | 503,819 | 15,939 | 22,117 | 541,875 | |||
| Debt instruments | 1,085,164 | 40,979 | 6,682 | 1,132,825 | |||
| Bonds and notes | 802,296 | 28,427 | 527 | 831,250 | |||
| Money market instruments | 282,868 | 12,552 | 6,155 | 301,575 | |||
| Other Investment | 939,853 | -1,571 | 20,602 | 958,884 | |||
| Loans, currency and deposits | 745,629 | -15,612 | 9,111 | 739,128 | |||
| Other 3 | 194,223 | 14,041 | 11,490 | 219,754 | |||
| Reserve Assets | 1,294 | 2 | 2 | 1,298 | |||
| Total Foreign Assets | 2,818,156 | 65,204 | 54,816 | 2,938,176 | |||
| Foreign Liabilities | |||||||
| Direct Investment in Ireland 2 | 256,410 | 16,708 | 5,920 | 279,038 | |||
| Equity capital and reinvested earnings | 255,996 | 15,953 | 2,501 | 274,450 | |||
| Other capital | 415 | 754 | 3,419 | 4,588 | |||
| Portfolio Investment | 1,905,521 | 36,712 | 45,880 | 1,988,113 | |||
| Equity | 1,333,870 | 33,015 | 45,801 | 1,412,686 | |||
| Debt instruments | 571,651 | 3,697 | 80 | 575,428 | |||
| Bonds and notes | 553,044 | 1,749 | 225 | 555,018 | |||
| Money market instruments | 18,607 | 1,948 | -145 | 20,410 | |||
| Other Investment | 833,680 | 8,699 | 9,209 | 851,588 | |||
| Loans, currency and deposits | 596,411 | -12,263 | 6,998 | 591,146 | |||
| Other 3 | 237,270 | 20,962 | 2,210 | 260,442 | |||
| Total Foreign Liabilities | 2,995,611 | 62,119 | 61,009 | 3,118,739 | |||
| 1Revised. | |||||||
| 2Reflecting the so-called directional principle for reclassifying Direct Investment (see background notes). | |||||||
| 3Includes financial derivatives and trade credits; in the case of liabilities this category also includes life insurance liabilities to non-residents. | |||||||
| Table 6(a) - Gross External Debt1 | € million | ||||||||||
| 31 Dec 2012 2 | 31 Mar 2013 | ||||||||||
| Item | IFSC | Non-IFSC | Total | IFSC | Non-IFSC | Total | |||||
| General Government | 0 | 123,981 | 123,981 | 0 | 130,938 | 130,938 | |||||
| Short-term | 0 | 2,265 | 2,265 | 0 | 2,933 | 2,933 | |||||
| Money market instruments | 0 | 2,265 | 2,265 | 0 | 2,933 | 2,933 | |||||
| Loans | 0 | 0 | 0 | 0 | 0 | 0 | |||||
| Long-term | 0 | 121,717 | 121,717 | 0 | 128,005 | 128,005 | |||||
| Bonds and notes | 0 | 64,464 | 64,464 | 0 | 69,477 | 69,477 | |||||
| Loans | 0 | 57,253 | 57,253 | 0 | 58,528 | 58,528 | |||||
| Monetary Authority 3 | 0 | 79,281 | 79,281 | 0 | 60,088 | 60,088 | |||||
| Short-term | 0 | 79,259 | 79,259 | 0 | 60,059 | 60,059 | |||||
| Loans and deposits | 0 | 79,259 | 79,259 | 0 | 60,059 | 60,059 | |||||
| Long-term | 0 | 22 | 22 | 0 | 29 | 29 | |||||
| Other debt liabilities | 0 | 22 | 22 | 0 | 29 | 29 | |||||
| Monetary Financial Institutions 4 | 216,524 | 83,052 | 299,576 | 221,921 | 81,037 | 302,958 | |||||
| Short-term | * | * | 195,874 | * | * | 204,136 | |||||
| Money market instruments | * | * | 9,886 | * | * | 11,124 | |||||
| Loans and deposits | 123,392 | 62,596 | 185,988 | 129,935 | 63,077 | 193,012 | |||||
| Long-term | * | * | 103,702 | * | * | 98,822 | |||||
| Bonds and notes | 36,296 | 12,080 | 48,376 | 38,533 | 9,342 | 47,875 | |||||
| Loans | 42,565 | 7,884 | 50,449 | 37,962 | 7,643 | 45,605 | |||||
| Other debt liabilities | * | * | 4,877 | * | * | 5,342 | |||||
| Other Sectors 5 | 772,907 | 71,459 | 844,366 | 806,537 | 71,264 | 877,801 | |||||
| Short-term | * | * | 115,593 | * | * | 122,373 | |||||
| Money market instruments | * | * | 6,457 | * | * | 6,353 | |||||
| Loans and deposits | 91,839 | 798 | 92,637 | 99,341 | 627 | 99,968 | |||||
| Trade credits | 9,315 | 7,184 | 16,499 | 8,269 | 7,783 | 16,052 | |||||
| Long-term | * | * | 728,773 | * | * | 755,428 | |||||
| Bonds and notes | * | * | 440,204 | * | * | 437,665 | |||||
| Loans | 91,928 | 38,898 | 130,826 | 95,880 | 38,096 | 133,976 | |||||
| Other debt liabilities | 138,153 | 19,590 | 157,743 | 163,932 | 19,855 | 183,787 | |||||
| Direct Investment 6 | 160,086 | 132,782 | 292,868 | 167,298 | 136,746 | 304,044 | |||||
| Debt liabilities to affiliated enterprises | 0 | 28,306 | 28,306 | 0 | 28,551 | 28,551 | |||||
| Debt liabilities to direct investors | 160,086 | 104,476 | 264,562 | 167,298 | 108,195 | 275,493 | |||||
| Gross External Debt | 1,149,517 | 490,556 | 1,640,073 | 1,195,756 | 480,073 | 1,675,829 | |||||
| 1Gross external debt represents the stock of Ireland's liabilities to non-residents other than equity and financial derivatives. | |||||||||||
| 2Revised. | |||||||||||
| 3Central Bank of Ireland. | |||||||||||
| 4Covering licensed credit institutions and money market funds. | |||||||||||
| 5Other sectors includes financial corporations other than the Monetary Authority and Monetary Financial Institutions, non-financial service and manufacturing companies and other industrial enterprises as well as (implicitly) households (see Background Notes). The gross liabilities to non-residents of financial corporations covered in other sectors tend to be very significant. | |||||||||||
| 6Covering inter affiliate loans, non-equity securities, trade credits and other debt liabilities. Debt liabilities to affiliated enterprises refers to direct investment abroad while debt liabilities to direct investors refers to direct investment in Ireland. | |||||||||||
| *Suppressed for confidentiality reasons. | |||||||||||
| Table 6(b) - External Assets in Debt Instruments 1 | € million | ||||||||||
| 31 Dec 2012 2 | 31 Mar 2013 | ||||||||||
| Item | IFSC | Non-IFSC | Total | IFSC | Non-IFSC | Total | |||||
| General Government | 0 | 4,223 | 4,223 | 0 | 5,119 | 5,119 | |||||
| Short-term | 0 | 3,574 | 3,574 | 0 | 4,437 | 4,437 | |||||
| Money market instruments | 0 | 0 | 0 | 0 | 0 | 0 | |||||
| Loans and Deposits | 0 | 3,574 | 3,574 | 0 | 4,437 | 4,437 | |||||
| Long-term | 0 | 649 | 649 | 0 | 682 | 682 | |||||
| Bonds and notes | 0 | 301 | 301 | 0 | 334 | 334 | |||||
| Loans | 0 | 348 | 348 | 0 | 348 | 348 | |||||
| Monetary Authority 3 | 0 | 16,393 | 16,393 | 0 | 16,864 | 16,864 | |||||
| Short-term | 0 | 4,176 | 4,176 | 0 | 3,056 | 3,056 | |||||
| Money market instruments | 0 | 4,032 | 4,032 | 0 | 2,290 | 2,290 | |||||
| Loans and deposits | 0 | 144 | 144 | 0 | 766 | 766 | |||||
| Long-term | 0 | 12,217 | 12,217 | 0 | 13,808 | 13,808 | |||||
| Bonds and notes | 0 | 12,217 | 12,217 | 0 | 13,808 | 13,808 | |||||
| Monetary Financial Institutions 4 | 550,147 | 104,805 | 654,952 | 544,062 | 95,949 | 640,011 | |||||
| Short-term | * | * | 438,875 | * | * | 432,999 | |||||
| Money market instruments | * | * | 173,725 | * | * | 177,432 | |||||
| Loans and deposits | 195,685 | 69,465 | 265,150 | 192,042 | 63,525 | 255,567 | |||||
| Long-term | * | * | 216,077 | * | * | 207,012 | |||||
| Bonds and notes | 165,341 | 22,887 | 188,228 | 153,816 | 20,935 | 174,751 | |||||
| Loans | 13,878 | 11,548 | 25,426 | 18,740 | 10,819 | 29,559 | |||||
| Other debt Assets | * | * | 2,423 | * | * | 2,702 | |||||
| Other Sectors 5 | 1,213,170 | 66,644 | 1,279,814 | 1,290,853 | 67,633 | 1,358,486 | |||||
| Short-term | 275,802 | 28,970 | 304,772 | 285,642 | 29,835 | 315,477 | |||||
| Money market instruments | 103,647 | 1,463 | 105,110 | 120,063 | 1,789 | 121,852 | |||||
| Loans and deposits | 149,332 | 10,195 | 159,527 | 142,412 | 10,761 | 153,173 | |||||
| Trade credit assets | 22,823 | 17,312 | 40,135 | 23,167 | 17,285 | 40,452 | |||||
| Long-term | 937,368 | 37,674 | 975,042 | 1,005,211 | 37,798 | 1,043,009 | |||||
| Bonds and notes | 568,843 | 32,707 | 601,550 | 609,804 | 32,553 | 642,357 | |||||
| Loans | 290,639 | 823 | 291,462 | 294,537 | 741 | 295,278 | |||||
| Other debt Assets | 77,886 | 4,144 | 82,030 | 100,870 | 4,504 | 105,374 | |||||
| Direct Investment 6 | 186,883 | 152,315 | 339,198 | 187,255 | 159,713 | 346,968 | |||||
| Debt asset claims on affiliated enterprises | 0 | 75,051 | 75,051 | 0 | 76,063 | 76,063 | |||||
| Debt asset claims on direct investors | 186,883 | 77,264 | 264,147 | 187,255 | 83,650 | 270,905 | |||||
| Reserve Assets | 0 | 1 | 1 | 0 | 2 | 2 | |||||
| External Assets in Debt Instruments | 1,950,200 | 344,381 | 2,294,581 | 2,022,170 | 345,280 | 2,367,450 | |||||
| Net External Debt 7 | -800,683 | 146,175 | -654,508 | -826,414 | 134,793 | -691,621 | |||||
| 1External Assets in Debt Instruments represents the stock of Ireland's claims on non-residents other than equity and financial derivatives. | |||||||||||
| 2Revised. | |||||||||||
| 3Central Bank of Ireland. | |||||||||||
| 4Covering licensed credit institutions and money market funds. | |||||||||||
| 5Other sectors includes financial corporations other than the Monetary Authority and Monetary Financial Institutions, non-financial service and manufacturing companies and other industrial enterprises as well as (implicitly) households (see Background Notes). The gross claims on non-residents of financial corporations covered in other sectors tend to be very significant. | |||||||||||
| 6Covering inter affiliate loans, non-equity securities, trade credits and other debt assets. Debt claims on affiliated enterprises refers to direct investment abroad while debt claims on direct investors refers to direct investment in Ireland. | |||||||||||
| 7Net External Debt equals Gross External Debt (from table 6a) minus External Assets in Debt Instruments. A negative sign indicates a net Asset position. | |||||||||||
| *Data suppressed for confidentiality reasons. | |||||||||||
The international investment position (or IIP) is a point in time statistical statement of: the value and composition of the stock of an economy’s foreign financial assets, or the economy’s claims on the rest of the world, and the value and composition of the stock of an economy’s financial liabilities (or obligations) to the rest of the world.
The IMF External Debt Manual defines external debt to be a point in time statistical statement of the value and composition of the stock of an economy’s gross foreign financial liabilities to the rest of the world. The liabilities referred to cover those arising from Irish residents issuing debt securities such as bonds, notes and money market instruments to non-residents, as well as any loans received from and outstanding to non-residents, and any trade payables due to non-residents. In essence, external debt refers to financial obligations to non-residents other than those arising from transactions in equity or financial derivative contracts.
For more detailed methodological information see the Quarterly International Investment Position and External Debt - Background Notes at the following link: Quarterly International Investment Position and External Debt - Background Notes (PDF 298KB)
 Hide Background Notes
Scan the QR code below to view this release online or go to
http://www.cso.ie/en/releasesandpublications/er/iiped/internationalinvestmentpositionandexternaldebtmarch2013/
 Show Table 1(a) International Investment Position (IIP) classified by Financial Instrument
 Hide Table 1(a) International Investment Position (IIP) classified by Financial Instrument