
| Domestic Trips '000 | Outbound Trips '000 | ||||
| Year | Year | Year | Year | ||
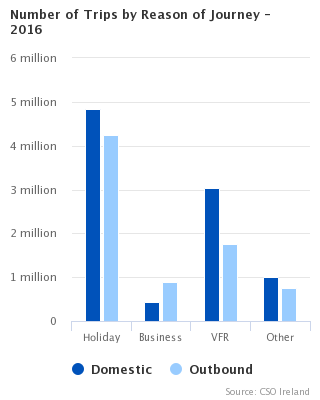
| Reason for Journey | 2015 | 2016 | 2015 | 2016 | |
| Holiday | 4,658 | 4,830 | 4,219 | 4,250 | |
| Business | 407 | 425 | 767 | 901 | |
| Visiting Friends/Relatives | 2,921 | 3,032 | 1,430 | 1,751 | |
| Other | 1,138 | 994 | 678 | 744 | |
| Total | 9,125 | 9,282 | 7,094 | 7,646 | |
Domestic Travel - 2016
Outbound Travel - 2016
Quarter 4 2016 Results
| Table 1 Domestic travel by Irish Residents - Number of Trips, Number of Nights, Expenditure & Average Length of Stay, Q1 2015 - Q4 2016 | |||||||||||||||
| '000 | |||||||||||||||
| 2012 | 2013 | 2014 | 2015 | 2016 | 2015 | 2016 | |||||||||
| Jan-Mar | Apr-Jun | Jul-Sep | Oct-Dec | Jan-Mar | Apr-Jun | Jul-Sep | Oct-Dec | ||||||||
| Total Domestic - Trips | 8,291 | 8,413 | 8,991 | 9,125 | 9,282 | 1,731 | 2,181 | 3,187 | 2,026 | 2,069 | 2,040 | 3,159 | 2,014 | ||
| Total Domestic - Nights | 23,703 | 24,195 | 26,086 | 25,267 | 25,435 | 3,545 | 5,308 | 12,054 | 4,360 | 4,558 | 4,883 | 11,546 | 4,448 | ||
| € million | |||||||||||||||
| Total Domestic - Expenditure | 1,514.2 | 1,533.0 | 1,713.5 | 1,725.3 | 1,776.1 | 269.1 | 393.6 | 701.9 | 360.6 | 326.9 | 366.1 | 692.3 | 390.8 | ||
| Nights | |||||||||||||||
| Average Length of Stay | 2.9 | 2.9 | 2.9 | 2.8 | 2.7 | 2.0 | 2.4 | 3.8 | 2.2 | 2.2 | 2.4 | 3.7 | 2.2 | ||
| Table 1a Domestic travel by Irish Residents - Number of Trips, Number of Nights, Expenditure & Average Length of Stay by Region Visited, Q1 2015 - Q4 2016 | |||||||||||||||
| '000 | |||||||||||||||
| 2012 | 2013 | 2014 | 2015 | 2016 | 2015 | 2016 | |||||||||
| Jan-Mar | Apr-Jun | Jul-Sep | Oct-Dec | Jan-Mar | Apr-Jun | Jul-Sep | Oct-Dec | ||||||||
| Total Domestic - Trips | 8,291 | 8,413 | 8,991 | 9,125 | 9,282 | 1,731 | 2,181 | 3,187 | 2,026 | 2,069 | 2,040 | 3,159 | 2,014 | ||
| Border, Midland and Western | 2,440 | 2,635 | 2,898 | 2,874 | 2,993 | 575 | 641 | 1,058 | 600 | 671 | 614 | 1,017 | 691 | ||
| Southern and Eastern | 5,851 | 5,779 | 6,093 | 6,251 | 6,289 | 1,156 | 1,540 | 2,129 | 1,426 | 1,398 | 1,426 | 2,142 | 1,323 | ||
| Total Domestic - Nights | 23,703 | 24,195 | 26,086 | 25,267 | 25,435 | 3,545 | 5,308 | 12,054 | 4,360 | 4,558 | 4,883 | 11,546 | 4,448 | ||
| Border, Midland and Western | 7,078 | 8,095 | 9,140 | 8,571 | 8,498 | 1,243 | 1,717 | 4,272 | 1,340 | 1,563 | 1,547 | 3,673 | 1,714 | ||
| Southern and Eastern | 16,626 | 16,099 | 16,946 | 16,696 | 16,936 | 2,302 | 3,591 | 7,782 | 3,021 | 2,995 | 3,335 | 7,872 | 2,734 | ||
| € million | |||||||||||||||
| Total Domestic - Expenditure | 1,514.2 | 1,533.0 | 1,713.5 | 1,725.3 | 1,776.1 | 269.1 | 393.6 | 701.9 | 360.6 | 326.9 | 366.1 | 692.3 | 390.8 | ||
| Border, Midland and Western | 461.9 | 505.4 | 569.1 | 559.4 | 577.5 | 88.4 | 120.3 | 250.0 | 100.7 | 107.2 | 114.9 | 209.5 | 145.9 | ||
| Southern and Eastern | 1,052.3 | 1,027.6 | 1,144.4 | 1,165.9 | 1,198.7 | 180.7 | 273.3 | 451.9 | 259.9 | 219.7 | 251.2 | 482.8 | 244.9 | ||
| Nights | |||||||||||||||
| Average Length of Stay | 2.9 | 2.9 | 2.9 | 2.8 | 2.7 | 2.0 | 2.4 | 3.8 | 2.2 | 2.2 | 2.4 | 3.7 | 2.2 | ||
| Border, Midland and Western | 2.9 | 3.1 | 3.2 | 3.0 | 2.8 | 2.2 | 2.7 | 4.0 | 2.2 | 2.3 | 2.5 | 3.6 | 2.5 | ||
| Southern and Eastern | 2.8 | 2.8 | 2.8 | 2.7 | 2.7 | 2.0 | 2.3 | 3.7 | 2.1 | 2.1 | 2.3 | 3.7 | 2.1 | ||
| Table 2 Domestic travel by Irish Residents - Number of Trips, Number of Nights, Expenditure & Average Length of Stay by Reason for Journey, Q1 2015 - Q4 2016 | |||||||||||||||
| '000 | |||||||||||||||
| 2012 | 2013 | 2014 | 2015 | 2016 | 2015 | 2016 | |||||||||
| Jan-Mar | Apr-Jun | Jul-Sep | Oct-Dec | Jan-Mar | Apr-Jun | Jul-Sep | Oct-Dec | ||||||||
| Total Domestic - Trips | 8,291 | 8,413 | 8,991 | 9,125 | 9,282 | 1,731 | 2,181 | 3,187 | 2,026 | 2,069 | 2,040 | 3,159 | 2,014 | ||
| Holiday | 4,036 | 4,073 | 4,436 | 4,658 | 4,830 | 767 | 1,063 | 1,968 | 860 | 958 | 1,074 | 1,884 | 914 | ||
| Business | 350 | 364 | 453 | 407 | 425 | 125 | 108 | 54 | 120 | 114 | 116 | 61 | 134 | ||
| Visiting Friends/Relatives | 2,765 | 2,988 | 2,918 | 2,921 | 3,032 | 613 | 708 | 797 | 804 | 754 | 607 | 912 | 760 | ||
| Other1 | 1,140 | 988 | 1,184 | 1,138 | 994 | 226 | 302 | 368 | 242 | 243 | 244 | 302 | 206 | ||
| Total Domestic - Nights | 23,703 | 24,195 | 26,086 | 25,267 | 25,435 | 3,545 | 5,308 | 12,054 | 4,360 | 4,558 | 4,883 | 11,546 | 4,448 | ||
| Holiday | 12,771 | 13,986 | 14,424 | 14,751 | 15,016 | 1,619 | 2,830 | 8,449 | 1,853 | 2,151 | 2,724 | 8,133 | 2,008 | ||
| Business | 693 | 616 | 904 | 672 | 752 | 189 | 219 | 70 | 194 | 186 | 227 | 103 | 235 | ||
| Visiting Friends/Relatives | 7,033 | 7,095 | 7,335 | 6,877 | 7,224 | 1,257 | 1,466 | 2,383 | 1,771 | 1,726 | 1,304 | 2,452 | 1,743 | ||
| Other1 | 3,206 | 2,498 | 3,423 | 2,967 | 2,443 | 481 | 792 | 1,152 | 543 | 495 | 628 | 857 | 463 | ||
| € million | |||||||||||||||
| Total Domestic - Expenditure | 1,514.2 | 1,533.0 | 1,713.5 | 1,725.3 | 1,776.1 | 269.1 | 393.6 | 701.9 | 360.6 | 326.9 | 366.1 | 692.3 | 390.8 | ||
| Holiday | 876.2 | 947.2 | 992.8 | 1,070.4 | 1,123.9 | 138.3 | 233.9 | 503.9 | 194.3 | 193.2 | 225.5 | 485.3 | 220.0 | ||
| Business | 80.5 | 84.2 | 110.3 | 98.0 | 104.7 | 27.3 | 30.5 | 11.4 | 28.8 | 25.1 | 31.0 | 13.1 | 35.5 | ||
| Visiting Friends/Relatives | 289.6 | 284.8 | 327.0 | 296.5 | 294.5 | 58.3 | 64.6 | 98.5 | 75.1 | 64.1 | 53.9 | 93.0 | 83.5 | ||
| Other1 | 268.0 | 216.8 | 283.4 | 260.4 | 253.0 | 45.2 | 64.6 | 88.2 | 62.4 | 44.6 | 55.7 | 100.9 | 51.8 | ||
| Nights | |||||||||||||||
| Average Length of Stay | 2.9 | 2.9 | 2.9 | 2.8 | 2.7 | 2.0 | 2.4 | 3.8 | 2.2 | 2.2 | 2.4 | 3.7 | 2.2 | ||
| Holiday | 3.2 | 3.4 | 3.3 | 3.2 | 3.1 | 2.1 | 2.7 | 4.3 | 2.2 | 2.2 | 2.5 | 4.3 | 2.2 | ||
| Business | 2.0 | 1.7 | 2.0 | 1.6 | 1.8 | 1.5 | 2.0 | 1.3 | 1.6 | 1.6 | 2.0 | 1.7 | 1.8 | ||
| Visiting Friends/Relatives | 2.5 | 2.4 | 2.5 | 2.4 | 2.4 | 2.1 | 2.1 | 3.0 | 2.2 | 2.3 | 2.1 | 2.7 | 2.3 | ||
| Other1 | 2.8 | 2.5 | 2.9 | 2.6 | 2.5 | 2.1 | 2.6 | 3.1 | 2.2 | 2.0 | 2.6 | 2.8 | 2.2 | ||
| 1 Other includes Education & Training, Sporting Events, Work/Looking for work, Health & Medical, Religious, Shopping and other reasons not elsewhere specified. | |||||||||||||||
| Table 2a Domestic travel by Irish Residents - Number of Trips, Number of Nights, Expenditure & | |||||
| Average Length of Stay by Reason for Journey, 2012 - 2016 | |||||
| '000 | |||||
| 2012 | 2013 | 2014 | 2015 | 2016 | |
| Total Domestic - Trips | 8,291 | 8,413 | 8,991 | 9,125 | 9,282 |
| Holiday | 4,036 | 4,073 | 4,436 | 4,658 | 4,830 |
| Business | 350 | 364 | 453 | 407 | 425 |
| Visiting Friends/Relatives | 2,765 | 2,988 | 2,918 | 2,921 | 3,032 |
| Education & Training | 155 | 142 | 128 | 167 | 153 |
| Sporting Events | 295 | 269 | 396 | 331 | 290 |
| Work/Looking for work | 130 | 84 | 101 | 80 | 83 |
| Other1 | 560 | 493 | 559 | 559 | 468 |
| Total Domestic - Nights | 23,703 | 24,195 | 26,086 | 25,267 | 25,435 |
| Holiday | 12,771 | 13,986 | 14,424 | 14,751 | 15,016 |
| Business | 693 | 616 | 904 | 672 | 752 |
| Visiting Friends/Relatives | 7,033 | 7,095 | 7,335 | 6,877 | 7,224 |
| Education & Training | 1,046 | 721 | 745 | 952 | 751 |
| Sporting Events | 567 | 495 | 755 | 630 | 561 |
| Work/Looking for work | 442 | 266 | 368 | 259 | 209 |
| Other1 | 1,149 | 1,016 | 1,556 | 1,126 | 921 |
| € million | |||||
| Total Domestic - Expenditure | 1,514.2 | 1,533.0 | 1,713.5 | 1,725.3 | 1,776.1 |
| Holiday | 876.2 | 947.2 | 992.8 | 1,070.4 | 1,123.9 |
| Business | 80.5 | 84.2 | 110.3 | 98.0 | 104.7 |
| Visiting Friends/Relatives | 289.6 | 284.8 | 327.0 | 296.5 | 294.5 |
| Education & Training | 53.4 | 46.4 | 40.6 | 60.7 | 52.6 |
| Sporting Events | 53.3 | 49.9 | 67.3 | 58.7 | 63.3 |
| Work/Looking for work | 37.9 | 16.9 | 21.0 | 17.9 | 18.1 |
| Other1 | 123.4 | 103.6 | 154.5 | 123.1 | 119.0 |
| Nights | |||||
| Average Length of Stay | 2.9 | 2.9 | 2.9 | 2.8 | 2.7 |
| Holiday | 3.2 | 3.4 | 3.3 | 3.2 | 3.1 |
| Business | 2.0 | 1.7 | 2.0 | 1.6 | 1.8 |
| Visiting Friends/Relatives | 2.5 | 2.4 | 2.5 | 2.4 | 2.4 |
| Education & Training | 6.8 | 5.1 | 5.8 | 5.7 | 4.9 |
| Sporting Events | 1.9 | 1.8 | 1.9 | 1.9 | 1.9 |
| Work/Looking for work | 3.4 | 3.2 | 3.6 | 3.2 | 2.5 |
| Other1 | 2.1 | 2.1 | 2.8 | 2.0 | 2.0 |
| 1 Other includes Health & Medical, Religious, Shopping and other reasons not elsewhere specified. | |||||
| Table 3 Domestic travel by Irish Residents - Percentage Distribution of Trips taken classified by Method of Booking and Type of | ||||||
| Booking, Quarter 4, 2015 - 2016 | ||||||
| Type of booking | ||||||
| Method of booking | Package1 % | Transport2 % | Accommodation3 % | |||
| Q4 2015 | Q4 2016 | Q4 2015 | Q4 2016 | Q4 2015 | Q4 2016 | |
| Internet | ||||||
| Direct | 40.6 | 42.4 | 6.8 | 7.1 | 33.8 | 31.7 |
| Via travel agent/tour operator | 6.1 | 23.4 | 0.1 | 0.5 | 3.8 | 4.6 |
| Non internet | ||||||
| Direct | 34.3 | 21.9 | 3.9 | 3.5 | 11.3 | 13.3 |
| Via travel agent/tour operator | 10.3 | 3.4 | 0.1 | 0.1 | 1.5 | 0.5 |
| No booking required | 0.0 | 0.0 | 88.4 | 87.9 | 48.4 | 47.8 |
| Don't know | 8.7 | 8.8 | 0.8 | 1.0 | 1.1 | 2.2 |
| Total | 100 | 100 | 100 | 100 | 100 | 100 |
| 1A package tour/holiday is where two or more services are combined and sold as a single product at a single price e.g transport and accommodation. | ||||||
| 2Transport booked separately, not part of a package. | ||||||
| 3Accommodation booked separately, not part of a package. | ||||||
| Table 4 Domestic travel by Irish Residents - Number of Trips, Number of Nights & Average Length of Stay by Type of Accommodation, Q1 2015 - Q4 2016 | |||||||||||||||
| '000 | |||||||||||||||
| 2012 | 2013 | 2014 | 2015 | 2016 | 2015 | 2016 | |||||||||
| Jan-Mar | Apr-Jun | Jul-Sep | Oct-Dec | Jan-Mar | Apr-Jun | Jul-Sep | Oct-Dec | ||||||||
| Total Domestic - Trips | 8,291 | 8,413 | 8,991 | 9,125 | 9,282 | 1,731 | 2,181 | 3,187 | 2,026 | 2,069 | 2,040 | 3,159 | 2,014 | ||
| Hotel | 3,313 | 3,382 | 3,630 | 3,704 | 3,626 | 811 | 832 | 1,156 | 904 | 937 | 774 | 994 | 920 | ||
| Self Catering/Rented House | 644 | 724 | 830 | 827 | 852 | 109 | 219 | 403 | 96 | 138 | 210 | 403 | 102 | ||
| Friends/Relatives | 2,896 | 2,956 | 2,996 | 3,011 | 3,243 | 601 | 708 | 942 | 760 | 739 | 655 | 1,071 | 778 | ||
| Other1 | 1,438 | 1,351 | 1,535 | 1,583 | 1,560 | 210 | 422 | 685 | 266 | 255 | 401 | 690 | 214 | ||
| Total Domestic - Nights | 23,703 | 24,195 | 26,086 | 25,267 | 25,435 | 3,545 | 5,308 | 12,054 | 4,360 | 4,558 | 4,883 | 11,546 | 4,448 | ||
| Hotel | 6,977 | 6,781 | 7,207 | 7,133 | 7,068 | 1,399 | 1,551 | 2,601 | 1,582 | 1,664 | 1,476 | 2,323 | 1,604 | ||
| Self Catering/Rented House | 3,237 | 3,714 | 4,240 | 3,896 | 3,773 | 336 | 849 | 2,422 | 289 | 380 | 811 | 2,151 | 432 | ||
| Friends/Relatives | 7,935 | 7,695 | 8,157 | 7,917 | 8,544 | 1,257 | 1,575 | 3,289 | 1,795 | 1,718 | 1,492 | 3,474 | 1,860 | ||
| Other1 | 5,554 | 6,005 | 6,482 | 6,321 | 6,050 | 553 | 1,333 | 3,741 | 694 | 796 | 1,104 | 3,598 | 553 | ||
| Nights | |||||||||||||||
| Average Length of Stay | 2.9 | 2.9 | 2.9 | 2.8 | 2.7 | 2.0 | 2.4 | 3.8 | 2.2 | 2.2 | 2.4 | 3.7 | 2.2 | ||
| Hotel | 2.1 | 2.0 | 2.0 | 1.9 | 1.9 | 1.7 | 1.9 | 2.2 | 1.8 | 1.8 | 1.9 | 2.3 | 1.7 | ||
| Self Catering/Rented House | 5.0 | 5.1 | 5.1 | 4.7 | 4.4 | 3.1 | 3.9 | 6.0 | 3.0 | 2.8 | 3.9 | 5.3 | 4.2 | ||
| Friends/Relatives | 2.7 | 2.6 | 2.7 | 2.6 | 2.6 | 2.1 | 2.2 | 3.5 | 2.4 | 2.3 | 2.3 | 3.2 | 2.4 | ||
| Other1 | 3.9 | 4.4 | 4.2 | 4.0 | 3.9 | 2.6 | 3.2 | 5.5 | 2.6 | 3.1 | 2.8 | 5.2 | 2.6 | ||
| 1Other includes stays in Caravan/Camping, Guesthouse/B&B, Own Holiday Home, Health Farm/Spa, Ship/Cruise and other types of accommodation not elsewhere specified. | |||||||||||||||
| Table 4a Domestic travel by Irish Residents - Number of Trips, Number of Nights | |||||
| & Average Length of Stay by Type of Accommodation, 2012 - 2016 | |||||
| '000 | |||||
| 2012 | 2013 | 2014 | 2015 | 2016 | |
| Total Domestic - Trips | 8,291 | 8,413 | 8,991 | 9,125 | 9,282 |
| Guesthouse/B&B | 367 | 330 | 425 | 475 | 411 |
| Own Holiday Home | 477 | 407 | 444 | 544 | 485 |
| Hotel | 3,313 | 3,382 | 3,630 | 3,704 | 3,626 |
| Self Catering/Rented House | 644 | 724 | 830 | 827 | 852 |
| Friends/Relatives | 2,896 | 2,956 | 2,996 | 3,011 | 3,243 |
| Other1 | 594 | 615 | 666 | 564 | 665 |
| Total Domestic - Nights | 23,703 | 24,195 | 26,086 | 25,267 | 25,435 |
| Guesthouse/B&B | 934 | 845 | 1,100 | 1,007 | 975 |
| Own Holiday Home | 1,787 | 2,246 | 2,018 | 2,942 | 2,186 |
| Hotel | 6,977 | 6,781 | 7,207 | 7,133 | 7,068 |
| Self Catering/Rented House | 3,237 | 3,714 | 4,240 | 3,896 | 3,773 |
| Friends/Relatives | 7,935 | 7,695 | 8,157 | 7,917 | 8,544 |
| Other1 | 2,833 | 2,913 | 3,364 | 2,372 | 2,889 |
| Nights | |||||
| Average Length of Stay | 2.9 | 2.9 | 2.9 | 2.8 | 2.7 |
| Guesthouse/B&B | 2.5 | 2.6 | 2.6 | 2.1 | 2.4 |
| Own Holiday Home | 3.8 | 5.5 | 4.5 | 5.4 | 4.5 |
| Hotel | 2.1 | 2.0 | 2.0 | 1.9 | 1.9 |
| Self Catering/Rented House | 5.0 | 5.1 | 5.1 | 4.7 | 4.4 |
| Friends/Relatives | 2.7 | 2.6 | 2.7 | 2.6 | 2.6 |
| Other1 | 4.8 | 4.7 | 5.1 | 4.2 | 4.3 |
| 1Other includes stays in Health Farm/Spa, Ship/Cruise, Caravan/Camping and other types of accommodation not elsewhere specified. | |||||
| Table 5 Outbound travel by Irish Residents - Number of Trips, Number of Nights, Expenditure & Average Length of Stay, Q1 2015 - Q4 2016 | |||||||||||||||
| '000 | |||||||||||||||
| 2012 | 2013 | 2014 | 2015 | 2016 | 2015 | 2016 | |||||||||
| Jan-Mar | Apr-Jun | Jul-Sep | Oct-Dec | Jan-Mar | Apr-Jun | Jul-Sep | Oct-Dec | ||||||||
| Total Outbound - Trips | 6,623 | 6,575 | 6,677 | 7,094 | 7,646 | 1,350 | 1,926 | 2,218 | 1,600 | 1,523 | 2,002 | 2,323 | 1,798 | ||
| Total Outbound - Nights | 53,112 | 51,985 | 53,652 | 53,515 | 56,753 | 9,440 | 13,262 | 21,135 | 9,678 | 10,842 | 14,053 | 21,386 | 10,472 | ||
| € million | |||||||||||||||
| Total Outbound - Expenditure | 5,342.5 | 5,384.2 | 5,590.2 | 6,022.1 | 6,539.4 | 1,040.7 | 1,510.1 | 2,146.7 | 1,324.6 | 1,224.2 | 1,582.0 | 2,273.7 | 1,459.4 | ||
| Nights | |||||||||||||||
| Average Length of Stay | 8.0 | 7.9 | 8.0 | 7.5 | 7.4 | 7.0 | 6.9 | 9.5 | 6.0 | 7.1 | 7.0 | 9.2 | 5.8 | ||
| Table 6 Outbound travel by Irish Residents - Number of Trips, Number of Nights and Expenditure by Country/Region Visited, Q1 2015 - Q4 2016 | |||||||||||||||
| '000 | |||||||||||||||
| 2012 | 2013 | 2014 | 2015 | 2016 | 2015 | 2016 | |||||||||
| Jan-Mar | Apr-Jun | Jul-Sep | Oct-Dec | Jan-Mar | Apr-Jun | Jul-Sep | Oct-Dec | ||||||||
| Total Outbound - Trips | 6,623 | 6,575 | 6,677 | 7,094 | 7,646 | 1,350 | 1,926 | 2,218 | 1,600 | 1,523 | 2,002 | 2,323 | 1,798 | ||
| France | 630 | 538 | 586 | 632 | 611 | 97 | 200 | 259 | 76 | 132 | 164 | 215 | 100 | ||
| Germany | 163 | 164 | 220 | 203 | 230 | 29 | 44 | 56 | 73 | 48 | 59 | 51 | 72 | ||
| Italy | 348 | 284 | 274 | 418 | 362 | 64 | 130 | 152 | 72 | 77 | 91 | 141 | 53 | ||
| Portugal | 351 | 322 | 370 | 313 | 481 | 10 | 110 | 143 | 50 | 34 | 178 | 184 | 86 | ||
| Spain | 1,339 | 1,367 | 1,290 | 1,552 | 1,593 | 195 | 505 | 587 | 264 | 233 | 516 | 575 | 269 | ||
| United Kingdom (GB & NI) | 2,237 | 2,407 | 2,355 | 2,269 | 2,460 | 575 | 516 | 556 | 623 | 607 | 518 | 633 | 702 | ||
| Of which : Great Britain | 1,784 | 2,011 | 1,965 | 1,933 | 2,004 | 493 | 457 | 470 | 513 | 515 | 432 | 526 | 532 | ||
| Northern Ireland | 453 | 396 | 390 | 336 | 456 | 82 | 59 | 85 | 111 | 93 | 86 | 107 | 170 | ||
| Other Europe1 | 772 | 724 | 781 | 955 | 1,004 | 188 | 249 | 276 | 242 | 222 | 269 | 283 | 231 | ||
| North America | 388 | 404 | 453 | 422 | 490 | 99 | 95 | 118 | 110 | 89 | 105 | 152 | 144 | ||
| Asia & Middle East | 177 | 133 | 173 | 165 | 223 | 57 | 31 | 31 | 47 | 33 | 50 | 56 | 84 | ||
| All other areas | 216 | 232 | 174 | 164 | 192 | 37 | 45 | 39 | 43 | 48 | 53 | 34 | 57 | ||
| Total Outbound - Nights | 53,112 | 51,985 | 53,652 | 53,515 | 56,753 | 9,440 | 13,262 | 21,135 | 9,678 | 10,842 | 14,053 | 21,386 | 10,472 | ||
| France | 5,825 | 5,176 | 5,129 | 5,565 | 5,361 | 569 | 1,605 | 3,015 | 376 | 795 | 1,181 | 2,897 | 489 | ||
| Germany | 925 | 731 | 1,298 | 1,214 | 1,134 | 164 | 306 | 346 | 398 | 250 | 273 | 306 | 305 | ||
| Italy | 2,846 | 2,179 | 2,315 | 3,097 | 2,933 | 348 | 757 | 1,491 | 501 | 572 | 681 | 1,390 | 290 | ||
| Portugal | 3,375 | 2,871 | 3,337 | 2,746 | 3,928 | 105 | 779 | 1,575 | 286 | 257 | 1,226 | 1,787 | 659 | ||
| Spain | 12,497 | 12,690 | 12,872 | 14,034 | 14,690 | 1,824 | 4,085 | 6,013 | 2,112 | 2,356 | 4,388 | 5,692 | 2,254 | ||
| United Kingdom (GB & NI) | 9,239 | 9,531 | 9,763 | 8,826 | 9,028 | 1,988 | 1,988 | 2,877 | 1,973 | 2,669 | 1,651 | 2,637 | 2,071 | ||
| Of which : Great Britain | 7,991 | 8,528 | 8,675 | 7,975 | 8,021 | 1,815 | 1,846 | 2,551 | 1,763 | 2,424 | 1,461 | 2,425 | 1,710 | ||
| Northern Ireland | 1,248 | 1,003 | 1,088 | 850 | 1,007 | 172 | 142 | 326 | 210 | 245 | 189 | 212 | 360 | ||
| Other Europe1 | 5,628 | 5,566 | 6,983 | 6,346 | 6,402 | 1,186 | 1,305 | 2,478 | 1,377 | 1,396 | 1,711 | 2,312 | 983 | ||
| North America | 5,838 | 5,691 | 6,295 | 5,877 | 6,226 | 1,258 | 1,215 | 2,167 | 1,237 | 1,012 | 1,199 | 2,602 | 1,414 | ||
| Asia & Middle East | 2,977 | 2,467 | 2,492 | 2,811 | 3,332 | 1,175 | 445 | 484 | 707 | 513 | 720 | 1,025 | 1,073 | ||
| All other areas | 3,962 | 5,083 | 3,168 | 3,000 | 3,720 | 823 | 778 | 688 | 710 | 1,022 | 1,025 | 739 | 934 | ||
| € million | |||||||||||||||
| Total Outbound - Expenditure | 5,342.5 | 5,384.2 | 5,590.2 | 6,022.1 | 6,539.4 | 1,040.7 | 1,510.1 | 2,146.7 | 1,324.6 | 1,224.2 | 1,582.0 | 2,273.7 | 1,459.4 | ||
| France | 495.6 | 433.2 | 473.3 | 486.0 | 446.1 | 73.4 | 147.3 | 218.3 | 47.0 | 87.5 | 114.5 | 194.9 | 49.2 | ||
| Germany | 111.5 | 99.3 | 138.5 | 126.5 | 160.0 | 16.6 | 21.9 | 44.9 | 43.1 | 37.2 | 37.5 | 41.7 | 43.6 | ||
| Italy | 311.8 | 256.1 | 254.7 | 374.7 | 359.2 | 44.5 | 96.0 | 161.6 | 72.6 | 63.6 | 80.4 | 186.5 | 28.8 | ||
| Portugal | 299.5 | 246.5 | 302.7 | 269.3 | 385.3 | 10.9 | 77.4 | 149.1 | 31.9 | 21.5 | 129.8 | 176.4 | 57.6 | ||
| Spain | 1,093.0 | 1,101.4 | 1,141.3 | 1,317.7 | 1,433.3 | 149.9 | 349.2 | 591.2 | 227.4 | 201.2 | 398.8 | 624.6 | 208.7 | ||
| United Kingdom (GB & NI) | 871.8 | 924.0 | 973.1 | 1,030.3 | 993.3 | 249.6 | 220.8 | 266.6 | 293.3 | 240.9 | 184.5 | 290.2 | 277.7 | ||
| Of which : Great Britain | 789.0 | 864.9 | 897.2 | 946.5 | 907.9 | 229.8 | 204.7 | 240.9 | 271.1 | 226.8 | 169.3 | 267.1 | 244.6 | ||
| Northern Ireland | 82.7 | 59.1 | 75.9 | 83.8 | 85.5 | 19.8 | 16.1 | 25.7 | 22.2 | 14.1 | 15.2 | 23.1 | 33.1 | ||
| Other Europe1 | 545.4 | 568.6 | 704.2 | 739.4 | 783.5 | 122.2 | 208.2 | 260.1 | 148.9 | 179.5 | 195.2 | 259.9 | 149.0 | ||
| North America | 787.0 | 819.0 | 890.2 | 925.7 | 1,045.5 | 191.9 | 218.4 | 292.8 | 222.5 | 184.8 | 252.3 | 321.0 | 287.4 | ||
| Asia & Middle East | 346.2 | 371.6 | 347.0 | 368.5 | 476.2 | 106.1 | 71.5 | 61.4 | 129.4 | 97.8 | 85.4 | 96.0 | 196.9 | ||
| All other areas | 480.6 | 564.4 | 365.2 | 383.9 | 456.9 | 75.4 | 99.3 | 100.5 | 108.6 | 110.3 | 103.4 | 82.5 | 160.6 | ||
| 1All other EU member states and all other European countries. | |||||||||||||||
| Table 6a Outbound travel by Irish Residents - Number of Trips, Number of Nights & Average Length of Stay by Region Visited, Q1 2015 - Q4 2016 | |||||||||||||||
| '000 | |||||||||||||||
| 2012 | 2013 | 2014 | 2015 | 2016 | 2015 | 2016 | |||||||||
| Jan-Mar | Apr-Jun | Jul-Sep | Oct-Dec | Jan-Mar | Apr-Jun | Jul-Sep | Oct-Dec | ||||||||
| Total Outbound - Trips | 6,623 | 6,575 | 6,677 | 7,094 | 7,646 | 1,350 | 1,926 | 2,218 | 1,600 | 1,523 | 2,002 | 2,323 | 1,798 | ||
| EU1 | 5,647 | 5,614 | 5,735 | 6,161 | 6,600 | 1,120 | 1,706 | 1,993 | 1,342 | 1,326 | 1,758 | 2,037 | 1,479 | ||
| Other Europe2 | 194 | 191 | 142 | 181 | 141 | 39 | 48 | 36 | 57 | 27 | 36 | 44 | 34 | ||
| North America | 388 | 404 | 453 | 422 | 490 | 99 | 95 | 118 | 110 | 89 | 105 | 152 | 144 | ||
| Other | 394 | 365 | 347 | 329 | 415 | 93 | 76 | 70 | 90 | 81 | 103 | 90 | 141 | ||
| Total Outbound - Nights | 53,112 | 51,985 | 53,652 | 53,515 | 56,753 | 9,440 | 13,262 | 21,135 | 9,678 | 10,842 | 14,053 | 21,386 | 10,472 | ||
| EU1 | 38,988 | 37,103 | 40,237 | 40,564 | 42,504 | 5,938 | 10,542 | 17,525 | 6,560 | 8,077 | 10,871 | 16,687 | 6,868 | ||
| Other Europe2 | 1,348 | 1,641 | 1,460 | 1,263 | 972 | 247 | 282 | 270 | 464 | 218 | 238 | 334 | 182 | ||
| North America | 5,838 | 5,691 | 6,295 | 5,877 | 6,226 | 1,258 | 1,215 | 2,167 | 1,237 | 1,012 | 1,199 | 2,602 | 1,414 | ||
| Other | 6,939 | 7,550 | 5,660 | 5,811 | 7,052 | 1,998 | 1,224 | 1,172 | 1,417 | 1,536 | 1,745 | 1,763 | 2,007 | ||
| Nights | |||||||||||||||
| Average Length of Stay | 8.0 | 7.9 | 8.0 | 7.5 | 7.4 | 7.0 | 6.9 | 9.5 | 6.0 | 7.1 | 7.0 | 9.2 | 5.8 | ||
| EU1 | 6.9 | 6.6 | 7.0 | 6.6 | 6.4 | 5.3 | 6.2 | 8.8 | 4.9 | 6.1 | 6.2 | 8.2 | 4.6 | ||
| Other Europe2 | 7.0 | 8.6 | 10.3 | 7.0 | 6.9 | 6.4 | 5.8 | 7.4 | 8.1 | 8.1 | 6.6 | 7.5 | 5.4 | ||
| North America | 15.0 | 14.1 | 13.9 | 13.9 | 12.7 | 12.7 | 12.7 | 18.4 | 11.2 | 11.3 | 11.4 | 17.2 | 9.8 | ||
| Other | 17.6 | 20.7 | 16.3 | 17.7 | 17.0 | 21.4 | 16.2 | 16.7 | 15.8 | 18.9 | 16.9 | 19.7 | 14.2 | ||
| 1From 1st July 2013, EU includes Croatia. | |||||||||||||||
| 2Other Europe includes Croatia until the 30th June 2013. | |||||||||||||||
| Table 6b Outbound travel by Irish Residents - Number of Trips, Number of Nights, | |||||
| Expenditure & Average Length of Stay by Region Visited, 2012 - 2016 | |||||
| '000 | |||||
| 2012 | 2013 | 2014 | 2015 | 2016 | |
| Total Outbound - Trips | 6,623 | 6,575 | 6,677 | 7,094 | 7,646 |
| EU1 | 5,647 | 5,614 | 5,735 | 6,161 | 6,600 |
| Other Europe2 | 194 | 191 | 142 | 181 | 141 |
| North America | 388 | 404 | 453 | 422 | 490 |
| Central, South & Other Americas | 74 | 39 | 32 | 40 | 56 |
| Asia & Middle East | 177 | 133 | 173 | 165 | 223 |
| Africa | 66 | 78 | 87 | 80 | 66 |
| Australia, New Zealand & Oceania | 76 | 115 | 56 | 44 | 70 |
| Total Outbound - Nights | 53,112 | 51,985 | 53,652 | 53,515 | 56,753 |
| EU1 | 38,988 | 37,103 | 40,237 | 40,564 | 42,504 |
| Other Europe2 | 1,348 | 1,641 | 1,460 | 1,263 | 972 |
| North America | 5,838 | 5,691 | 6,295 | 5,877 | 6,226 |
| Central, South & Other Americas | 1,050 | 492 | 526 | 629 | 886 |
| Asia & Middle East | 2,977 | 2,467 | 2,492 | 2,811 | 3,332 |
| Africa | 1,029 | 950 | 1,386 | 1,244 | 1,282 |
| Australia, New Zealand & Oceania | 1,883 | 3,642 | 1,256 | 1,127 | 1,552 |
| € million | |||||
| Total Outbound - Expenditure | 5,342.5 | 5,384.2 | 5,590.2 | 6,022.1 | 6,539.4 |
| EU1 | 3,590.5 | 3,456.2 | 3,831.3 | 4,185.9 | 4,438.7 |
| Other Europe2 | 138.1 | 173.1 | 156.4 | 158.1 | 122.2 |
| North America | 787.0 | 819.0 | 890.2 | 925.7 | 1,045.5 |
| Central, South & Other Americas | 142.1 | 77.0 | 88.6 | 96.1 | 153.0 |
| Asia & Middle East | 346.2 | 371.6 | 347.0 | 368.5 | 476.2 |
| Africa | 120.0 | 111.4 | 142.3 | 168.4 | 117.6 |
| Australia, New Zealand & Oceania | 218.5 | 376.0 | 134.2 | 119.4 | 186.3 |
| Nights | |||||
| Average Length of Stay | 8.0 | 7.9 | 8.0 | 7.5 | 7.4 |
| EU1 | 6.9 | 6.6 | 7.0 | 6.6 | 6.4 |
| Other Europe2 | 7.0 | 8.6 | 10.3 | 7.0 | 6.9 |
| North America | 15.0 | 14.1 | 13.9 | 13.9 | 12.7 |
| Central, South & Other Americas | 14.1 | 12.6 | 16.5 | 15.8 | 15.7 |
| Asia & Middle East | 16.8 | 18.6 | 14.4 | 17.0 | 14.9 |
| Africa | 15.5 | 12.1 | 16.0 | 15.5 | 19.5 |
| Australia, New Zealand & Oceania | 24.8 | 31.7 | 22.6 | 25.7 | 22.3 |
| 1From 1st July 2013, EU includes Croatia. | |||||
| 2Other Europe includes Croatia until the 30th June 2013. | |||||
| Table 7 Outbound travel by Irish Residents - Number of Trips, Number of Nights, Expenditure & Average Length of Stay by Reason for Journey, Q1 2015 - Q4 2016 | |||||||||||||||
| '000 | |||||||||||||||
| 2012 | 2013 | 2014 | 2015 | 2016 | 2015 | 2016 | |||||||||
| Jan-Mar | Apr-Jun | Jul-Sep | Oct-Dec | Jan-Mar | Apr-Jun | Jul-Sep | Oct-Dec | ||||||||
| Total Outbound - Trips | 6,623 | 6,575 | 6,677 | 7,094 | 7,646 | 1,350 | 1,926 | 2,218 | 1,600 | 1,523 | 2,002 | 2,323 | 1,798 | ||
| Holiday | 3,817 | 3,659 | 3,675 | 4,219 | 4,250 | 674 | 1,191 | 1,579 | 776 | 727 | 1,161 | 1,528 | 834 | ||
| Business | 584 | 652 | 729 | 767 | 901 | 200 | 210 | 144 | 213 | 239 | 233 | 149 | 280 | ||
| Visiting Friends/Relatives | 1,472 | 1,624 | 1,620 | 1,430 | 1,751 | 318 | 357 | 336 | 419 | 378 | 405 | 493 | 475 | ||
| Other1 | 750 | 639 | 652 | 678 | 744 | 159 | 168 | 159 | 192 | 179 | 203 | 151 | 210 | ||
| Total Outbound - Nights | 53,112 | 51,985 | 53,652 | 53,515 | 56,753 | 9,440 | 13,262 | 21,135 | 9,678 | 10,842 | 14,053 | 21,386 | 10,472 | ||
| Holiday | 34,462 | 31,726 | 33,095 | 35,276 | 35,125 | 4,839 | 9,143 | 16,021 | 5,273 | 5,810 | 9,119 | 14,756 | 5,440 | ||
| Business | 2,199 | 2,394 | 2,980 | 2,905 | 4,075 | 753 | 801 | 563 | 788 | 1,251 | 929 | 658 | 1,237 | ||
| Visiting Friends/Relatives | 10,502 | 12,141 | 12,763 | 10,298 | 11,931 | 2,746 | 2,227 | 2,874 | 2,452 | 2,569 | 2,590 | 4,078 | 2,694 | ||
| Other1 | 5,950 | 5,725 | 4,814 | 5,037 | 5,622 | 1,103 | 1,092 | 1,678 | 1,164 | 1,212 | 1,416 | 1,894 | 1,101 | ||
| € million | |||||||||||||||
| Total Outbound - Expenditure | 5,342.5 | 5,384.2 | 5,590.2 | 6,022.1 | 6,539.4 | 1,040.7 | 1,510.1 | 2,146.7 | 1,324.6 | 1,224.2 | 1,582.0 | 2,273.7 | 1,459.4 | ||
| Holiday | 3,371.6 | 3,192.8 | 3,391.1 | 3,836.3 | 3,938.1 | 543.0 | 981.0 | 1,597.6 | 714.6 | 630.8 | 938.1 | 1,604.0 | 765.1 | ||
| Business | 631.4 | 812.4 | 812.6 | 880.6 | 1,099.6 | 222.9 | 222.7 | 169.4 | 265.6 | 289.5 | 281.2 | 182.4 | 346.5 | ||
| Visiting Friends/Relatives | 800.9 | 888.0 | 912.1 | 759.7 | 898.6 | 168.1 | 170.5 | 225.5 | 195.6 | 169.0 | 209.9 | 309.9 | 209.7 | ||
| Other1 | 538.6 | 491.0 | 474.3 | 545.5 | 603.1 | 106.7 | 135.8 | 154.2 | 148.9 | 134.9 | 152.8 | 177.3 | 138.1 | ||
| Nights | |||||||||||||||
| Average Length of Stay | 8.0 | 7.9 | 8.0 | 7.5 | 7.4 | 7.0 | 6.9 | 9.5 | 6.0 | 7.1 | 7.0 | 9.2 | 5.8 | ||
| Holiday | 9.0 | 8.7 | 9.0 | 8.4 | 8.3 | 7.2 | 7.7 | 10.1 | 6.8 | 8.0 | 7.9 | 9.7 | 6.5 | ||
| Business | 3.8 | 3.7 | 4.1 | 3.8 | 4.5 | 3.8 | 3.8 | 3.9 | 3.7 | 5.2 | 4.0 | 4.4 | 4.4 | ||
| Visiting Friends/Relatives | 7.1 | 7.5 | 7.9 | 7.2 | 6.8 | 8.6 | 6.2 | 8.6 | 5.8 | 6.8 | 6.4 | 8.3 | 5.7 | ||
| Other1 | 7.9 | 9.0 | 7.4 | 7.4 | 7.6 | 7.0 | 6.5 | 10.6 | 6.1 | 6.8 | 7.0 | 12.5 | 5.2 | ||
| 1Other includes Education & Training, Sporting Events, Work/Looking for work, Health & Medical, Religious, Shopping and other reasons not elsewhere specified. | |||||||||||||||
| Table 7a Outbound travel by Irish Residents - Number of Trips, Number of Nights, Expenditure | |||||
| & Average Length of Stay by Reason for Journey, 2012 - 2016 | |||||
| '000 | |||||
| 2012 | 2013 | 2014 | 2015 | 2016 | |
| Total Outbound - Trips | 6,623 | 6,575 | 6,677 | 7,094 | 7,646 |
| Holiday | 3,817 | 3,659 | 3,675 | 4,219 | 4,250 |
| Business | 584 | 652 | 729 | 767 | 901 |
| Visiting Friends/Relatives | 1,472 | 1,624 | 1,620 | 1,430 | 1,751 |
| Education & Training | 102 | 85 | 85 | 88 | 95 |
| Sporting Events | 300 | 222 | 255 | 291 | 262 |
| Work/Looking for work | 120 | 135 | 115 | 104 | 105 |
| Other1 | 227 | 197 | 198 | 194 | 282 |
| Total Outbound - Nights | 53,112 | 51,985 | 53,652 | 53,515 | 56,753 |
| Holiday | 34,462 | 31,726 | 33,095 | 35,276 | 35,125 |
| Business | 2,199 | 2,394 | 2,980 | 2,905 | 4,075 |
| Visiting Friends/Relatives | 10,502 | 12,141 | 12,763 | 10,298 | 11,931 |
| Education & Training | 1,136 | 1,001 | 1,024 | 931 | 1,075 |
| Sporting Events | 1,081 | 932 | 772 | 920 | 1,147 |
| Work/Looking for work | 2,078 | 2,436 | 1,722 | 1,651 | 1,608 |
| Other1 | 1,655 | 1,356 | 1,296 | 1,535 | 1,792 |
| € million | |||||
| Total Outbound - Expenditure | 5,342.5 | 5,384.2 | 5,590.2 | 6,022.1 | 6,539.4 |
| Holiday | 3,371.6 | 3,192.8 | 3,391.1 | 3,836.3 | 3,938.1 |
| Business | 631.4 | 812.4 | 812.6 | 880.6 | 1,099.6 |
| Visiting Friends/Relatives | 800.9 | 888.0 | 912.1 | 759.7 | 898.6 |
| Education & Training | 78.7 | 90.1 | 72.3 | 71.0 | 86.1 |
| Sporting Events | 151.3 | 126.3 | 124.0 | 168.1 | 175.7 |
| Work/Looking for work | 131.1 | 122.1 | 114.1 | 154.6 | 135.0 |
| Other1 | 177.4 | 152.5 | 163.9 | 151.9 | 206.2 |
| Nights | |||||
| Average Length of Stay | 8.0 | 7.9 | 8.0 | 7.5 | 7.4 |
| Holiday | 9.0 | 8.7 | 9.0 | 8.4 | 8.3 |
| Business | 3.8 | 3.7 | 4.1 | 3.8 | 4.5 |
| Visiting Friends/Relatives | 7.1 | 7.5 | 7.9 | 7.2 | 6.8 |
| Education & Training | 11.2 | 11.8 | 12.0 | 10.5 | 11.3 |
| Sporting Events | 3.6 | 4.2 | 3.0 | 3.2 | 4.4 |
| Work/Looking for work | 17.2 | 18.0 | 15.0 | 15.8 | 15.4 |
| Other1 | 7.3 | 6.9 | 6.5 | 7.9 | 6.3 |
| 1Other includes Health & Medical, Religious, Shopping and other reasons not elsewhere specified. | |||||
| Table 8 Outbound travel by Irish Residents - Percentage Distribution of Trips taken classified by | ||||||
| Method of Booking and Type of Booking, Quarter 4, 2015 - 2016 | ||||||
| Type of booking | ||||||
| Package1 % | Transport2 % | Accommodation3 % | ||||
| Q4 2015 | Q4 2016 | Q4 2015 | Q4 2016 | Q4 2015 | Q4 2016 | |
| Method of booking | ||||||
| Internet | ||||||
| Direct | 12.7 | 12.3 | 81.9 | 79.1 | 48.3 | 50.3 |
| Via travel agent/tour operator | 47.4 | 65.1 | 5.3 | 5.6 | 4.9 | 9.9 |
| Non internet | ||||||
| Direct | 2.5 | 3.7 | 1.7 | 1.6 | 4.8 | 3.8 |
| Via travel agent/tour operator | 32.3 | 18.5 | 1.0 | 1.6 | 0.8 | 1.7 |
| No booking required | 0.0 | 0.0 | 7.8 | 10.2 | 38.9 | 32.4 |
| Don't know | 5.1 | 0.3 | 2.3 | 2.0 | 2.2 | 2.0 |
| Total | 100 | 100 | 100 | 100 | 100 | 100 |
| 1A package tour/holiday is where two or more services are combined and sold as a single product at a single | ||||||
| price e.g transport and accommodation. | ||||||
| 2Transport booked separately, not part of a package. | ||||||
| 3Accommodation booked separately, not part of a package. | ||||||
| Table 9 Outbound travel by Irish Residents - Number of Trips, Number of Nights & Average Length of Stay by Type of Accommodation, Q1 2015 - Q4 2016 | |||||||||||||||
| '000 | |||||||||||||||
| 2012 | 2013 | 2014 | 2015 | 2016 | 2015 | 2016 | |||||||||
| Jan-Mar | Apr-Jun | Jul-Sep | Oct-Dec | Jan-Mar | Apr-Jun | Jul-Sep | Oct-Dec | ||||||||
| Total Outbound - Trips | 6,623 | 6,575 | 6,677 | 7,094 | 7,646 | 1,350 | 1,926 | 2,218 | 1,600 | 1,523 | 2,002 | 2,323 | 1,798 | ||
| Hotel | 2,690 | 2,873 | 3,095 | 3,367 | 3,455 | 710 | 960 | 875 | 821 | 718 | 926 | 845 | 966 | ||
| Self Catering/Rented House | 1,364 | 1,182 | 1,051 | 1,211 | 1,522 | 170 | 305 | 561 | 176 | 260 | 424 | 595 | 243 | ||
| Friends/Relatives | 1,661 | 1,717 | 1,650 | 1,680 | 1,845 | 389 | 374 | 426 | 492 | 428 | 421 | 538 | 458 | ||
| Other1 | 907 | 803 | 882 | 836 | 825 | 82 | 287 | 356 | 112 | 117 | 232 | 345 | 131 | ||
| Total Outbound - Nights | 53,112 | 51,985 | 53,652 | 53,515 | 56,753 | 9,440 | 13,262 | 21,135 | 9,678 | 10,842 | 14,053 | 21,386 | 10,472 | ||
| Hotel | 14,492 | 15,416 | 18,078 | 18,192 | 18,962 | 3,169 | 5,223 | 6,174 | 3,625 | 3,833 | 5,055 | 5,582 | 4,493 | ||
| Self Catering/Rented House | 14,081 | 13,705 | 11,720 | 12,151 | 14,798 | 2,061 | 2,396 | 6,156 | 1,537 | 2,501 | 3,624 | 6,664 | 2,009 | ||
| Friends/Relatives | 14,344 | 13,875 | 14,160 | 14,341 | 13,908 | 3,154 | 3,083 | 4,609 | 3,496 | 3,053 | 3,028 | 4,934 | 2,893 | ||
| Other1 | 10,195 | 8,989 | 9,695 | 8,832 | 9,086 | 1,057 | 2,560 | 4,196 | 1,020 | 1,456 | 2,346 | 4,206 | 1,077 | ||
| Nights | |||||||||||||||
| Average Length of Stay | 8.0 | 7.9 | 8.0 | 7.5 | 7.4 | 7.0 | 6.9 | 9.5 | 6.0 | 7.1 | 7.0 | 9.2 | 5.8 | ||
| Hotel | 5.4 | 5.4 | 5.8 | 5.4 | 5.5 | 4.5 | 5.4 | 7.1 | 4.4 | 5.3 | 5.5 | 6.6 | 4.6 | ||
| Self Catering/Rented House | 10.3 | 11.6 | 11.1 | 10.0 | 9.7 | 12.1 | 7.9 | 11.0 | 8.8 | 9.6 | 8.5 | 11.2 | 8.3 | ||
| Friends/Relatives | 8.6 | 8.1 | 8.6 | 8.5 | 7.5 | 8.1 | 8.2 | 10.8 | 7.1 | 7.1 | 7.2 | 9.2 | 6.3 | ||
| Other1 | 11.2 | 11.2 | 11.0 | 10.6 | 11.0 | 12.9 | 8.9 | 11.8 | 9.1 | 12.5 | 10.1 | 12.2 | 8.2 | ||
| 1Other includes stays in Caravan/Camping, Guesthouse/B&B, Own Holiday Home, Health Farm/Spa, Ship/Cruise and other types of accommodation not elsewhere specified. | |||||||||||||||
| Table 9a Outbound travel by Irish Residents - Number of Trips, Number of Nights & Average Length | |||||
| of Stay by Type of Accommodation, 2012 - 2016 | |||||
| '000 | |||||
| 2012 | 2013 | 2014 | 2015 | 2016 | |
| Total Outbound - Trips | 6,623 | 6,575 | 6,677 | 7,094 | 7,646 |
| Guesthouse/B&B | 234 | 171 | 213 | 144 | 194 |
| Own Holiday Home | 148 | 181 | 123 | 109 | 152 |
| Hotel | 2,690 | 2,873 | 3,095 | 3,367 | 3,455 |
| Self Catering/Rented House | 1,364 | 1,182 | 1,051 | 1,211 | 1,522 |
| Friends/Relatives | 1,661 | 1,717 | 1,650 | 1,680 | 1,845 |
| Other1 | 525 | 451 | 545 | 583 | 479 |
| Total Outbound - Nights | 53,112 | 51,985 | 53,652 | 53,515 | 56,753 |
| Guesthouse/B&B | 1,931 | 1,022 | 1,376 | 955 | 1,351 |
| Own Holiday Home | 2,571 | 2,722 | 1,698 | 1,390 | 2,311 |
| Hotel | 14,492 | 15,416 | 18,078 | 18,192 | 18,962 |
| Self Catering/Rented House | 14,081 | 13,705 | 11,720 | 12,151 | 14,798 |
| Friends/Relatives | 14,344 | 13,875 | 14,160 | 14,341 | 13,908 |
| Other1 | 5,692 | 5,245 | 6,621 | 6,486 | 5,423 |
| Nights | |||||
| Average Length of Stay | 8.0 | 7.9 | 8.0 | 7.5 | 7.4 |
| Guesthouse/B&B | 8.2 | 6.0 | 6.4 | 6.6 | 7.0 |
| Own Holiday Home | 17.3 | 15.0 | 13.8 | 12.7 | 15.2 |
| Hotel | 5.4 | 5.4 | 5.8 | 5.4 | 5.5 |
| Self Catering/Rented House | 10.3 | 11.6 | 11.1 | 10.0 | 9.7 |
| Friends/Relatives | 8.6 | 8.1 | 8.6 | 8.5 | 7.5 |
| Other1 | 10.8 | 11.6 | 12.1 | 11.1 | 11.3 |
| 1Other includes stays in Health Farm/Spa, Ship/Cruise, Caravan/Camping and other types of accommodation not elsewhere specified. | |||||
Annual/Quarterly.
Domestic and Outbound travel patterns which involve overnight stays of all residents of the Republic of Ireland.
All private households.
The purpose of the Household Travel Survey (HTS) is to measure domestic and outbound travel patterns involving overnight stays and associated details (expenditure, purpose of trip, type of accommodation used etc.) of Irish residents. The survey is one of several Central Statistics Office (CSO) tourism surveys conducted to comply with the requirements of Council Directive 95/57/EC of 23 November 1995 concerning the collection of statistical information in the field of tourism for data to the end of 2011 and Regulation (EU) No 692/2011 of the European Parliament and of the Council of 6 July 2011 concerning European statistics on tourism and repealing Council Directive 95/57/EC in respect of data from the beginning of 2012.
Information is collected via postal survey of private households on a monthly basis by the Central Statistics Office.
The HTS is a random stratified sample. Each month, over 4,600 households (or approximately 0.3% of all private households) are randomly selected from the 2015 Electoral Register, where the selection is stratified by District Electoral Division.
The sample size for some subcategories/breakdowns can be small and therefore caution should be taken when analysing this data.
Domestic Travel
From Quarter 1 2012 onwards, survey data for domestic travel is weighted to agree with population estimates broken down by sex, age group and region (NUTS 3). These population estimates are provided by the Quarterly National Household Survey (QNHS). These weightings are then applied to survey results.
Outbound Travel
From Quarter 1 2012 onwards, survey data for outbound travel are weighted to agree with population estimates broken down by sex, age group and region (NUTS 3). These population estimates are provided by the Quarterly National Household Survey (QNHS). These weightings are then applied to survey results. The results for outbound travel are subsequently further weighted to agree with the Tourism & Travel results.
Revisions to data
There have been revisions to domestic and outbound travel data from Quarter 1 2012 onwards as a result of the change to the weighting methodology. Revised data are published in Quarter 1 2016 release. A summary of the effect of these revisions is shown in the enclosed table.
|
Table : Household Travel Survey - summary effect of revisions of data due to changed methodology | ||||
|---|---|---|---|---|
| 2012 | 2013 | 2014 | 2015 | |
| Total Domestic - Trips '000 (data pre revision) | 7,031 | 7,111 | 7,354 | 7,529 |
| Total Domestic - Trips '000 (data revised) | 8,291 | 8,413 | 8,991 | 9,125 |
| % Difference | 17.9% | 18.3% | 22.3% | 21.2% |
| Total Domestic - Nights '000 (data pre revision) | 20,120 | 20,649 | 21,204 | 20,931 |
| Total Domestic - Nights '000 (data revised) | 23,703 | 24,195 | 26,086 | 25,267 |
| % Difference | 17.8% | 17.2% | 23.0% | 20.7% |
| Domestic - Expenditure €m (data pre revision) | 1,345.4 | 1,373.2 | 1,464.0 | 1,529.9 |
| Domestic - Expenditure €m (data revised) | 1,514.2 | 1,533.0 | 1,713.5 | 1,725.3 |
| % Difference | 12.5% | 11.6% | 17.0% | 12.8% |
| Total Outbound - Trips '000 (data pre revision) | 6,600 | 6,579 | 6,676 | 7,077 |
| Total Outbound - Trips '000 (data revised) | 6,623 | 6,575 | 6,677 | 7,094 |
| % Difference | 0.3% | -0.1% | 0.0% | 0.2% |
| Total Outbound - Nights '000 (data pre revision) | 53,046 | 52,078 | 53,635 | 53,477 |
| Total Outbound - Nights '000 (data revised) | 53,112 | 51,985 | 53,652 | 53,515 |
| % Difference | 0.1% | -0.2% | 0.0% | 0.1% |
| Outbound - Expenditure €m (data pre revision) | 5,345.2 | 5,392.5 | 5,598.2 | 6,016.8 |
| Outbound - Expenditure €m (data revised) | 5,342.5 | 5,384.2 | 5,590.2 | 6,022.1 |
| % Difference | -0.1% | -0.2% | -0.1% | 0.1% |
Break in series
Arising from these changes, discontinuities in all of the series relating to outbound and domestic travel have occurred. Therefore, these results are not directly comparable with the results prior to Quarter 1 2012.
It should be noted that there are some differences between the Household Travel Survey and Tourism and Travel Survey:
Tourism
Means the activity of visitors taking a trip to a main destination outside their usual environment, for less than a year, for any main purpose, including business, leisure or other personal purpose, other than to be employed by a resident entity in the place visited.
Usual Environment
The usual environment of an individual is defined as the geographical area (though not necessarily a contiguous one) within which an individual conducts his/her regular life routines. Places that are frequently visited are part of a person’s usual environment even though they may be located at a considerable distance (or in another country) from the place of residence.
For the purposes of this release, trips taken on a weekly or more frequent basis are considered to be within a respondent’s usual environment and are thus excluded from estimates for tourism trips. The one exception being that of holiday homes which although may be frequently visited, are considered outside the usual environment according to the UNWTO 2008 International Recommendations on Tourism Statistics (IRTS).
Trip
A trip refers to the travel by a person from the time of departure from his/her usual residence until he/she returns: it thus refers to a round trip. A trip is made up of visits to different places.
Domestic Tourism
Domestic tourism is defined as the activities of residents of the Republic of Ireland travelling to and staying in places only within the Republic of Ireland but outside their usual environment.
The following categories are excluded from the definition of domestic travel:
Outbound Tourism
Outbound tourism is defined as the activities of residents of the Republic of Ireland travelling to and staying in places outside the Republic of Ireland and outside their usual environment. From 2012 onwards expenditure on outbound travel includes expenditure on car imports of approximately €200 million per annum.
The following categories are excluded from outbound travel:
Overnight Visitor
An overnight visitor is a visitor who stays at least one night in collective or private accommodation in the place, county or country visited.
Tourism Expenditure (to the end of 2011)
Total consumption expenditure is any expenditure made by a visitor or on behalf of a visitor during their trip and stay at their destination.
Tourism expenditure includes purchases of consumer goods and services inherent in travel and stay (eg. travel to, from and at destination, accommodation costs, food and drink, excursions), purchases of durable goods for personal use, souvenirs and gifts for family and friends.
The following outlays or acquisitions are excluded:
Tourism Expenditure (from 2012 onwards)
Total consumption expenditure is any expenditure made by a visitor or on behalf of a visitor during their trip and stay at their destination.
Tourism expenditure includes purchases of consumer goods and services inherent in travel and stay (eg. travel to, from and at destination, accommodation costs, food and drink, excursions), purchases of durable goods for personal use, souvenirs and gifts for family and friends.
Expenditure on valuables such as paintings, works of art, jewellery and on durable consumer goods such as cars, boats, mobile homes and caravans are also included.
The following outlays or acquisitions are excluded:
Rounding
Individual figures have been rounded independently and the sum of the component items therefore may not necessarily add to the totals shown.
NUTS Regions
The regional classifications in this release are based on the NUTS (Nomenclature of Territorial Units) classification used by Eurostat. The NUTS 3 regions correspond to the eight Regional Authorities established under the Local Government Act, 1991 and Regional Authorities Establishment Order, 1993, which came into operation on 1 January 1994. The NUTS 2 regions, which were proposed by Government and agreed by Eurostat in 1999, are groupings of the NUTS 3 regions. The composition of the regions is set out below.
|
Border, Midland and Western NUTS 2 Region |
Southern and Eastern NUTS 2 Region |
||
| Border | Cavan | Dublin | Dublin City |
| Donegal | Dun Laoghaire-Rathdown | ||
| Leitrim | Fingal | ||
| Louth | South Dublin | ||
| Monaghan | |||
| Sligo | Mid-East | Kildare | |
| Meath | |||
| Midland | Laois | Wicklow | |
| Longford | |||
| Offaly | Mid-West | Clare | |
| Westmeath | Limerick City | ||
| Limerick | |||
| West | Galway City | North Tipperary | |
| Galway | |||
| Mayo | South-East | Carlow | |
| Roscommon | Kilkenny | ||
| South Tipperary | |||
| Waterford City | |||
| Waterford | |||
| Wexford | |||
| South-West | Cork City | ||
| Cork | |||
| Kerry | |||
| EU includes the following countries: | ||
| Austria | France | Netherlands |
| Belgium | Germany | Poland |
| Bulgaria | Greece | Portugal |
| Croatia (from 1/7/2013) | Hungary | Romania |
| Cyprus | Italy | Slovakia |
| Czech Republic | Latvia | Slovenia |
| Denmark | Lithuania | Spain |
| Estonia | Luxembourg | Sweden |
| Finland | Malta | United Kingdom |
| Other Europe includes the following countries: | ||
| Aland Islands | Iceland | Norway |
| Albania | Isle of Man | Russian Federation |
| Andorra | Jersey | San Marino |
| Belarus | Liechtenstein | Serbia |
| Bosnia and Herzegovina | Macedonia, the former Yugoslav Republic of | Switzerland |
| Faroe Islands | Moldova, Republic of | Turkey |
| Gibraltar | Monaco | Ukraine |
| Guernsey | Montenegro | Vatican City |
| North America includes the following countries: | ||
| Canada | ||
| United States | ||
| Central, South and Other Americas includes the following countries: | ||
| Anguilla | Dominican Republic | Nicaragua |
| Antigua and Barbuda | Ecuador | Panama |
| Argentina | El Salvador | Paraguay |
| Aruba | Falkland Islands (Malvinas) | Peru |
| Bahamas | French Guiana | Puerto Rico |
| Barbados | Greenland | Saint Kitts and Nevis |
| Belize | Grenada | Saint Lucia |
| Bermuda | Guadeloupe | Saint Pierre and Miquelon |
| Bolivia | Guatemala | Saint Vincent & the Grenadines |
| Brazil | Guyana | Suriname |
| Cayman Islands | Haiti | Trinidad and Tobago |
| Chile | Honduras | Turks and Caicos Islands |
| Colombia | Jamaica | Uruguay |
| Costa Rica | Martinique | Venezuela |
| Cuba | Mexico | Virgin Islands, British |
| Dominica | Montserrat | Virgin Islands, US |
| Asia and Middle East includes the following countries: | ||
| Afghanistan | Japan | Palestinian Territory, Occupied |
| Armenia | Jordan | Philippines |
| Azerbaijan | Kazakhstan | Qatar |
| Bahrain | Korea, Democratic People's Republic of | Saudi Arabia |
| Bangladesh | Korea, Republic of | Singapore |
| Bhutan | Kuwait | Sri Lanka |
| British Indian Ocean Territory | Kyrgyzstan | Syrian Arab Republic |
| Brunei Darussalam | Lao People's Democratic Republic | Taiwan, Province of China |
| Cambodia | Lebanon | Tajikistan |
| China | Macao | Thailand |
| Georgia | Malaysia | Timor Leste |
| Hong Kong | Maldives | Turkmenistan |
| India | Mongolia | United Arab Emirates |
| Indonesia | Myanmar | Uzbekistan |
| Iran, Islamic Republic of | Nepal | Vietnam |
| Iraq | Oman | Yemen |
| Israel | Pakistan | |
| Africa includes the following countries: | ||
| Algeria | Gambia | Rwanda |
| Angola | Ghana | Saint Helena |
| Benin | Guinea | Sao Tome and Principe |
| Botswana | Guinea-Bissau | Senegal |
| Burkina Faso | Kenya | Seychelles |
| Burundi | Lesotho | Sierra Leone |
| Cameroon | Liberia | Somalia |
| Cape Verde | Libya | South Africa |
| Central African Republic | Madagascar | South Sudan |
| Chad | Malawi | Sudan |
| Comoros | Mali | Swaziland |
| Congo | Mauritania | Tanzania, United Republic of |
| Congo, the Democratic Republic of the | Mauritius | Togo |
| Cote d’Ivoire | Mayotte | Tunisia |
| Djibouti | Morocco | Uganda |
| Egypt | Mozambique | Western Sahara |
| Equatorial Guinea | Namibia | Zambia |
| Eritrea | Niger | Zimbabwe |
| Ethiopia | Nigeria | |
| Gabon | Reunion | |
| Australia, New Zealand and Oceania includes the following countries: | ||
| American Samoa | Kiribati | Samoa |
| Antarctica | Marshall Islands | Solomon Islands |
| Australia | Micronesia, Federated States of | South Georgia & the South Sandwich Islands |
| Bouvet Island | Nauru | Svalbard and Jan Mayen |
| Christmas Island | New Caledonia | Tokelau |
| Cocos (Keeling) Islands | New Zealand | Tonga |
| Cook Islands | Niue | Tuvalu |
| Fiji | Norfolk Island | United States Minor Outlying Islands |
| French Polynesia | Northern Mariana Islands | Vanuatu |
| French Southern Territories | Palau | Wallis and Futuna |
| Guam | Papua New Guinea | |
| Heard Island & McDonald Islands | Pitcairn | |
 Hide Background Notes
Scan the QR code below to view this release online or go to
http://www.cso.ie/en/releasesandpublications/er/hts/householdtravelsurveyquarter4andyear2016/
 Show Table 1 Domestic travel by Irish Residents - Number of Trips, Number of Nights, Expenditure & Average Length of Stay, Q1 2015 - Q4 2016
 Hide Table 1 Domestic travel by Irish Residents - Number of Trips, Number of Nights, Expenditure & Average Length of Stay, Q1 2015 - Q4 2016