
| GVA at constant (2012) basic prices for sectors dominated by Foreign-owned MNEs and Other sectors | |||||
| 2012 | 2013 | ||||
| Amount €m | Amount €m | % change | |||
| Foreign-owned MNE dominated | 42,178 | 38,595 | -8.5 | ||
| Other | 115,304 | 118,540 | 2.8 | ||
| Total | 157,481 | 157,135 | -0.2 | ||
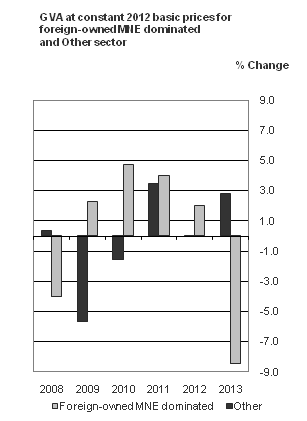
Gross Value Added (GVA) at constant 2012 basic prices for sectors where foreign-owned multinational enterprises are dominant declined by 8.5 per cent between 2012 and 2013. This was principally due to a combination of increased payments for royalties by Software & Communications entities and the impact of the pharma patent cliff. Consequently GVA for the foreign-owned MNE dominated sector returned during the period to a level previously seen between 2009 and 2010.
The other non-MNE sectors of the economy grew by 2.8 per cent in 2013, resulting in an overall decline of 0.2 per cent. Of the larger non-MNE sectors, growth was positive in Real Estate activities (+6.6 per cent), the combined AgriFood sector, (+10.1 per cent) and Construction (+11.8 per cent).Viewed over the period from 2008, the share of total GVA at constant prices accounted for by the foreign-owned MNE dominated sectors rose steadily from 23.6 per cent in 2008 to a peak of 26.8% in 2012, falling back to 24.6% in 2013.
|
The composition of the sectors dominated by foreign-owned multinational enterprises is given overleaf in terms of constituent Nace Rev 2 codes and their corresponding shares in 2013. For data at the more detailed 37 sectoral breakdown level, please refer to Tables 31 and 32 of the National Income & Expenditure 2013 publication issued in October 2014 (National Income and Expenditure 2013 (PDF 664KB) ). For information on chain linking see pages v, xviii, 41-42 and 55 of NIE 2013. |
| Table 1 Gross Value Added at Current Basic Prices | € million | |||||
| 2008 | 2009 | 2010 | 2011 | 2012 | 2013 | |
| Foreign-owned MNE dominated | 34,997 | 37,454 | 38,671 | 42,826 | 42,178 | 39,844 |
| Other | 132,566 | 115,412 | 111,064 | 113,366 | 115,304 | 118,947 |
| Total | 167,563 | 152,866 | 149,735 | 156,192 | 157,481 | 158,792 |
| Annual Percentage Changes | ||||||
| Foreign-owned MNE dominated | 1.1% | 7.0% | 3.2% | 10.7% | -1.5% | -5.5% |
| Other | -4.8% | -12.9% | -3.8% | 2.1% | 1.7% | 3.2% |
| Total | -3.6% | -8.8% | -2.0% | 4.3% | 0.8% | 0.8% |
| Table 2 Gross Value Added at Constant Basic Prices (Chain-linked annually and referenced to year 2012) | € million | |||||
| 2008 | 2009 | 2010 | 2011 | 2012 | 2013 | |
| Foreign-owned MNE dominated | 37,085 | 37,943 | 39,749 | 41,349 | 42,178 | 38,595 |
| Other | 119,876 | 113,104 | 111,346 | 115,249 | 115,304 | 118,540 |
| Total | 157,352 | 151,080 | 151,070 | 156,567 | 157,481 | 157,135 |
| Annual Percentage Changes | ||||||
| Foreign-owned MNE dominated | -4.0% | 2.3% | 4.8% | 4.0% | 2.0% | -8.5% |
| Other | 0.4% | -5.6% | -1.6% | 3.5% | 0.0% | 2.8% |
| Total | -0.5% | -4.0% | -0.0% | 3.6% | 0.6% | -0.2% |
 Show Table 3 Composition of Foreign-owned multinational enterprise dominated sector and Other sector
| Table 3 Composition of Foreign-owned multinational enterprise dominated sector and Other sector* | |||||||||||||||
| Description | Nace code | Percentage of 2013 GVA at constant basic prices | |||||||||||||
| Chemicals and chemical products, basic pharmaceutical products and pharmaceutical preparations | 20-21 | 11.2% | |||||||||||||
| Software and communications sectors | 58-63 | 9.6% | |||||||||||||
| Other NACE sectors dominated by Foreign-owned MNEs | 18.2, 26, 27 and 32.5 | 3.9% | |||||||||||||
| (Reproduction of recorded media, Computer, electronic and optical products, Electrical equipment, Medical and dental instruments and supplies) | |||||||||||||||
| Foreign-owned MNE dominated Total | 24.6% | ||||||||||||||
| “Other” Sector | 75.4% | ||||||||||||||
| The "Other" Sector includes all Nace sectors excluding those | |||||||||||||||
| listed as part of the Foreign-owned MNE dominated sector above | |||||||||||||||
| * Foreign owned Multinational Enterprise (MNE) dominated sectors occur where MNE turnover on average exceeds 85% of the sector total. | |||||||||||||||
Background Notes
Gross Value Added at Constant Basic Prices Nace Rev 2
This release provides gross value added at current basic prices and constant basic prices (chain linked and referenced to 2012) for the economy divided into two sectors, namely
(a) the economic sectors dominated by Foreign-owned Multi National Enterprises and
(b) all other remaining sectors.
It also provides data concerning the composition of the Foreign-owned multinational dominated sector.
The sectoral data underlying the aggregates in the release are the same as those used for National Income & Expenditure (NIE 2013) Tables 4, which gives a breakdown of the economy by five principal economic sectors (1. Agriculture, Forestry & Fishing, 2. Industry, 3. Distribution, Transport Software & Communications, 4. Public administration & defence, and 5. Other Services) and NIE Table 32 which illustrates a 37 sector breakdown of the Irish economy. The valuation used in Table 32 is “constant basic prices”. The valuation is at “constant factor cost” in Table 4.
National accounts are compiled in the EU according to the European System of National and Regional Accounts (ESA) framework. In 2014, the new ESA 2010 framework has replaced the ESA 95 version and all EU member states were required to adopt ESA 2010 by September 2014. ESA 2010 is the European version of the current UN mandated international standards for national accounts statistics, the System of National Accounts (SNA) 2008. The results for all years in this release are published on an ESA 2010 basis.
Nace classification
In compliance with EU regulations the contents of the sectors in this release conform to the Nace Rev. 2 system which corresponds with the UN International Standard Industrial Classification (ISIC Rev 4).
In table 3, the following is the correspondence with the relevant NIE and Nace Rev. 2 sectors:
|
NIE Sectors |
Nace 2 Sections |
Foreign-owned |
Other
(Nace codes) |
|
Agriculture, forestry and fishing |
Section A |
|
01-03 |
|
Industry |
Sections B to F |
18.2, 26, 27 and 32.5 |
05-18.1, |
|
Distribution, transport, software & communications |
Sections G to J |
58-63 |
45-56 |
|
Public Administration and Defence |
Section O |
|
84 |
|
Other Services |
Sections K to N and P to U |
|
64-82 and |
For further information on the Nace Rev. 2 classification of industrial activity, visit the CSO website:
http://www.cso.ie/en/surveysandmethodology/classifications/classificationofindustrialactivity.
 Hide Background Notes
Scan the QR code below to view this release online or go to
http://www.cso.ie/en/releasesandpublications/er/gvafm/grossvalueaddedforforeign-ownedmultinationalenterprisesandothersectorsannualresultsfor2013/
 Hide Table 1 Gross Value Added at Current Basic Prices