
| Percentage change in recorded offences, 2013 to 2014 and 2010 to 2014 | |||
| Recorded percentage change | |||
| ICCS offence group | 2013-2014 | 2010-2014 | |
| 01 | Homicide offences | -4 | -10 |
| 02 | Sexual offences | +3 | -18 |
| 03 | Attempts or threats to murder, assaults, harassments and related offences | +5 | -17 |
| 04 | Dangerous or negligent acts | +11 | +33 |
| 05 | Kidnapping and related offences | +2 | -5 |
| 06 | Robbery, extortion and hijacking offences | -5 | -18 |
| 07 | Burglary and related offences | +5 | +6 |
| 08 | Theft and related offences | -1 | +1 |
| 09 | Fraud, deception and related offences | +8 | -7 |
| 10 | Controlled drug offences | +4 | -20 |
| 11 | Weapons and explosives offences | -10 | -40 |
| 12 | Damage to property and to the environment | -5 | -30 |
| 13 | Public order and other social code offences | -10 | -41 |
| 14 | Road and traffic offences (NEC) | -3 | -43 |
| 15 | Offences against Government, justice procedures and organisation of crime | +7 | -13 |
| 16 | Offences not elsewhere classified | -3 | -24 |
This release provides an overview of recorded crime, as well as detections and outcomes of criminal proceedings for crimes reported to An Garda Siochana during 2014, based on administrative data received in 2016. The number of crimes recorded in 2014 in most Irish Crime Classification System (ICCS) groups had fallen compared with 2010, and half had fallen compared with 2013.
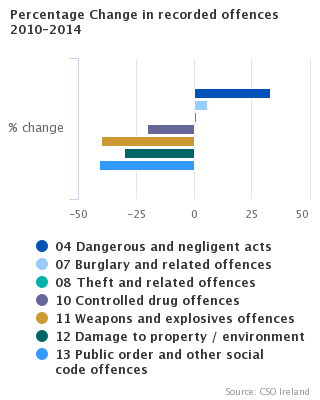
Compared with 2010 Group 04 Dangerous or negligent acts offences, comprising mostly Speeding and Dangerous Driving offences showed the highest increase (up 33%), however several groups including Group 10 Controlled drug offences, Group 11 Weapons and explosives offences, Group 12 Damage to property and the environment, and Group 13 Public order and other social code offences had decreased by more than 20% relative to 2010. Other serious crime groups such as Homicide offences (-10%) and Sexual offences (-18%) had also decreased, while there were increases in Group 07 Burglary and related offences (+6%) and Group 08 Theft and related offences (+1%).
The proportion of recorded crimes which are detected varies considerably from group to group depending on the type of crime, see Table 1. The detection rate for Group 01 Homicide offences in 2014 was 79%, down 6% on offences reported in 2013. Detection rates for Group 07 Burglary and related offences (18%), Group 09 Fraud, deception and related offences (38%) and Group 02 Sexual offences (47%) in 2014 were also lower when compared with previous years. Detection rates for certain high volume crime types such as Group 08 Theft and related offences, Group 12 Damage to property and related offences and Group 13 Public order and other social code offences were unchanged from 2013 figures at 33%, 22% and 93% respectively.
|
The CSO resumed the publication of Recorded Crime Statistics in June 2015, following a comprehensive review of the quality of Garda Síochana crime data and on foot of the Garda Inspectorate report on Crime Investigation (11th November 2014). The latest CSO review of the quality of PULSE data published on 28th September 2016 (link below). When interpreting Recorded Crime Statistics the CSO advises that the findings of these reviews should be taken into account. http://www.cso.ie/en/media/csoie/releasespublications/documents/crimejustice/2016/reviewofcrime.pdf |
Table 2 provides a full breakdown of the number of crimes recorded and detected by 3-digit ICCS classification for years 2010 to 2014. Table 3 summarises the outcomes of crime offences reported to An Garda Siochana in 2014 providing total figures by 3-digit ICCS classification for the numbers of crimes detected, those with relevant criminal proceedings, as well as the outcomes of commenced criminal proceedings. Table 4 provides a breakdown by age and gender of convictions for crimes reported in 2014. Table 5 provides a regional and divisional breakdown of recorded crimes and detections including a rate for recorded crimes per 100,000 population (except for Groups 01 and 05).
| Table 1 Detection rates by ICCS group, 2010-2014 | |||||||||||
| % | |||||||||||
| ICCS offence group | Detection Rate | ||||||||||
| 2010 | 2011 | 2012 | 2013 | 2014 | |||||||
| 01 | Homicide offences | 83 | 88 | 82 | 85 | 79 | |||||
| 02 | Sexual offences | 65 | 63 | 59 | 54 | 47 | |||||
| 03 | Attempts/Threats to murder, assaults, harassments | ||||||||||
| and related offences | 61 | 61 | 60 | 62 | 58 | ||||||
| 04 | Dangerous or negligent acts | 100 | 100 | 100 | 100 | 100 | |||||
| 05 | Kidnapping and related offences | 60 | 64 | 61 | 67 | 47 | |||||
| 06 | Robbery, extortion and hijacking offences | 53 | 49 | 46 | 41 | 40 | |||||
| 07 | Burglary and related offences | 25 | 23 | 22 | 20 | 18 | |||||
| 08 | Theft and related offences | 38 | 36 | 35 | 33 | 33 | |||||
| 09 | Fraud, deception and related offences | 54 | 47 | 44 | 42 | 38 | |||||
| 10 | Controlled drug offences | 99 | 98 | 98 | 99 | 99 | |||||
| 11 | Weapons and explosives offences | 89 | 88 | 89 | 90 | 91 | |||||
| 12 | Damage to property and to the environment | 23 | 23 | 22 | 22 | 22 | |||||
| 13 | Public order and other social code offences | 94 | 94 | 93 | 93 | 93 | |||||
| 14 | Road and traffic offences (NEC) | 99 | 99 | 99 | 99 | 99 | |||||
| 15 | Offences against Government, justice procedures and organistation of crime | ||||||||||
| 99 | 98 | 99 | 99 | 99 | |||||||
| 16 | Offences not elsewhere classified | 60 | 49 | 50 | 45 | 43 | |||||
| Table 2 Number of crime incidents recorded and detected, 2010-2014 | ||||||||||||
| 2010 | 2011 | 2012 | 2013 | 2014 | ||||||||
| Recorded | Detected | Recorded | Detected | Recorded | Detected | Recorded | Detected | Recorded | Detected | |||
| 01 | Homicide offences | 90 | 75 | 69 | 61 | 79 | 65 | 84 | 71 | 81 | 64 | |
| 011 | Murder/Manslaughter/Infanticide | 62 | 47 | 48 | 41 | 59 | 45 | 56 | 43 | 56 | 39 | |
| 012 | Dangerous driving leading to death | 28 | 28 | 21 | 20 | 20 | 20 | 28 | 28 | 25 | 25 | |
| 02 | Sexual offences | 2,493 | 1,615 | 2,036 | 1,291 | 2,089 | 1,238 | 1,976 | 1,059 | 2,044 | 964 | |
| 021 | Rape and sexual assault | 2,324 | 1,524 | 1,871 | 1,205 | 1,949 | 1,171 | 1,850 | 993 | 1,894 | 878 | |
| 022 | Other sexual offences | 169 | 91 | 165 | 86 | 140 | 67 | 126 | 66 | 150 | 86 | |
| 03 | Attempts/Threats to murder, assaults, harassments and related offences | |||||||||||
| 18,213 | 11,036 | 17,150 | 10,396 | 15,697 | 9,481 | 14,359 | 8,920 | 15,133 | 8,775 | |||
| 031 | Attempts/Threats to murder | 374 | 218 | 400 | 214 | 279 | 170 | 347 | 214 | 430 | 237 | |
| 032 | Assaults | 15,254 | 10,142 | 14,673 | 9,617 | 13,502 | 8,803 | 12,512 | 8,252 | 13,226 | 8,122 | |
| 033 | Harassment and related offences | 2,585 | 676 | 2,077 | 565 | 1,916 | 508 | 1,500 | 454 | 1,477 | 416 | |
| 04 | Dangerous or negligent acts | 205,455 | 204,609 | 303,975 | 303,262 | 271,074 | 270,144 | 247,022 | 246,148 | 274,071 | 273,278 | |
| 041 | Dangerous or negligent operation of a vehicle | 204,666 | 204,053 | 303,463 | 302,868 | 270,559 | 269,788 | 246,556 | 245,849 | 273,601 | 272,970 | |
| 042 | Other dangerous or negligent acts | 789 | 556 | 512 | 394 | 515 | 356 | 466 | 299 | 470 | 308 | |
| 05 | Kidnapping and related offences | 134 | 81 | 115 | 74 | 98 | 60 | 124 | 83 | 127 | 60 | |
| 051 | False imprisonment, abduction | 134 | 81 | 115 | 74 | 98 | 60 | 124 | 83 | 127 | 60 | |
| 06 | Robbery, Extortion and Hijacking Offences | 3,233 | 1,719 | 2,953 | 1,438 | 2,811 | 1,290 | 2,797 | 1,148 | 2,650 | 1,061 | |
| 061 | Robbery | 3,087 | 1,635 | 2,829 | 1,374 | 2,676 | 1,216 | 2,706 | 1,105 | 2,530 | 1,000 | |
| 062 | Extortion offences | 24 | 16 | 24 | 12 | 38 | 26 | 25 | 13 | 22 | 8 | |
| 063 | Hijacking offences | 122 | 68 | 100 | 52 | 97 | 48 | 66 | 30 | 98 | 53 | |
| 07 | Burglary and related offences | 26,091 | 6,523 | 28,193 | 6,440 | 28,433 | 6,138 | 26,281 | 5,368 | 27,653 | 4,883 | |
| 071 | Burglary | 26,091 | 6,523 | 28,193 | 6,440 | 28,433 | 6,138 | 26,281 | 5,368 | 27,653 | 4,883 | |
| 08 | Theft and related offences | 76,649 | 29,043 | 76,665 | 27,677 | 76,121 | 26,400 | 78,433 | 26,266 | 77,629 | 25,506 | |
| 081 | Theft/Taking of vehicle and related offences | 11,620 | 2,224 | 10,475 | 2,085 | 8,479 | 1,547 | 7,360 | 1,261 | 7,763 | 1,346 | |
| 082 | Theft (not vehicle) | 63,485 | 25,280 | 64,670 | 24,080 | 66,051 | 23,268 | 69,469 | 23,405 | 68,476 | 22,782 | |
| 083 | Handling stolen property | 1,544 | 1,539 | 1,520 | 1,512 | 1,591 | 1,585 | 1,604 | 1,600 | 1,390 | 1,378 | |
| 09 | Fraud, deception and related offences | 5,565 | 3,006 | 5,570 | 2,637 | 5,779 | 2,558 | 4,795 | 2,036 | 5,155 | 1,951 | |
| 091 | Fraud, forgery and false instrument offences | 4,743 | 2,528 | 4,938 | 2,263 | 5,111 | 2,234 | 4,396 | 1,819 | 4,559 | 1,697 | |
| 092 | Other fraud | 154 | 132 | 132 | 123 | 128 | 110 | 105 | 78 | 115 | 76 | |
| 093 | Counterfeiting currency and related offences | 666 | 344 | 494 | 246 | 538 | 212 | 288 | 135 | 481 | 178 | |
| 094 | Corruption | 2 | 2 | 6 | 5 | 2 | 2 | 6 | 4 | - | - | |
| 10 | Controlled drug offences | 19,798 | 19,519 | 17,573 | 17,277 | 16,382 | 16,122 | 15,326 | 15,127 | 15,872 | 15,680 | |
| 101 | Importation/Manufacture of drugs | 561 | 554 | 619 | 609 | 543 | 536 | 435 | 421 | 374 | 368 | |
| 102 | Possession of drugs | 18,488 | 18,228 | 16,425 | 16,144 | 15,257 | 15,012 | 14,402 | 14,225 | 14,819 | 14,636 | |
| 103 | Other drug offences | 749 | 737 | 529 | 524 | 582 | 574 | 489 | 481 | 679 | 676 | |
| 11 | Weapons and explosives offences | 4,116 | 3,676 | 3,484 | 3,071 | 3,042 | 2,693 | 2,741 | 2,464 | 2,477 | 2,247 | |
| 111 | Explosives, chemical weapons offences | 41 | 24 | 80 | 18 | 90 | 31 | 59 | 18 | 50 | 16 | |
| 112 | Firearms offences | 586 | 427 | 447 | 320 | 389 | 256 | 355 | 223 | 333 | 223 | |
| 113 | Offensive weapons offences (NEC) | 3,029 | 2,967 | 2,615 | 2,537 | 2,296 | 2,244 | 2,181 | 2,132 | 1,981 | 1,939 | |
| 114 | Fireworks offences | 460 | 258 | 342 | 196 | 267 | 162 | 146 | 91 | 113 | 69 | |
| 12 | Damage to property and to the environment | 38,824 | 9,011 | 35,158 | 7,975 | 32,151 | 7,022 | 28,709 | 6,432 | 27,343 | 6,028 | |
| 121 | Criminal damage | 38,587 | 8,887 | 34,926 | 7,881 | 31,863 | 6,941 | 28,492 | 6,360 | 27,095 | 5,943 | |
| 122 | Environmental damage | 237 | 124 | 232 | 94 | 288 | 81 | 217 | 72 | 248 | 85 | |
| 13 | Public order and other social code offences | 54,858 | 51,559 | 48,963 | 45,948 | 43,798 | 40,913 | 36,401 | 34,000 | 32,612 | 30,258 | |
| 131 | Disorderly conduct | 47,302 | 46,044 | 42,082 | 41,023 | 37,328 | 36,314 | 30,816 | 29,980 | 26,803 | 25,961 | |
| 132 | Trespass offences | 3,806 | 2,606 | 3,559 | 2,256 | 3,323 | 1,977 | 2,942 | 1,830 | 2,815 | 1,695 | |
| 133 | Liquor licensing offences | 2,766 | 2,178 | 2,314 | 1,829 | 1,902 | 1,571 | 1,378 | 1,142 | 1,272 | 1,085 | |
| 134 | Prostitution offences | 184 | 165 | 218 | 202 | 142 | 122 | 119 | 106 | 129 | 116 | |
| 135 | Regulated Betting/Money, collection/trading offences | 423 | 316 | 297 | 253 | 297 | 256 | 320 | 267 | 291 | 255 | |
| 136 | Social code offences (NEC) | 377 | 250 | 493 | 385 | 806 | 673 | 826 | 675 | 1,302 | 1,146 | |
| 14 | Road and traffic offences (NEC) | 259,893 | 256,875 | 217,208 | 214,616 | 195,169 | 193,348 | 153,212 | 151,681 | 149,247 | 148,072 | |
| 141 | Driving licence/Insurance offences | 24,638 | 24,491 | 20,409 | 20,273 | 17,840 | 17,692 | 14,539 | 14,473 | 14,464 | 14,406 | |
| 142 | Tax/Registration offences | 67,351 | 67,190 | 62,185 | 62,088 | 56,690 | 56,649 | 38,728 | 38,701 | 32,448 | 32,427 | |
| 143 | Roadworthiness/Regulatory offences | 157,791 | 156,487 | 124,305 | 123,391 | 112,439 | 111,820 | 91,979 | 91,482 | 95,398 | 95,018 | |
| 144 | Road transport/Public service vehicles offences | 10,113 | 8,707 | 10,309 | 8,864 | 8,200 | 7,187 | 7,966 | 7,025 | 6,937 | 6,221 | |
| 15 | Offences against Government, justice procedures and organisation of crime | |||||||||||
| 11,201 | 11,036 | 10,022 | 9,836 | 9,435 | 9,313 | 9,167 | 9,066 | 9,773 | 9,659 | |||
| 151 | Offences against Government and its agents | 336 | 256 | 448 | 342 | 280 | 214 | 278 | 223 | 326 | 257 | |
| 152 | Organisation of crime and conspiracy to commit crime | 18 | 16 | 22 | 18 | 6 | 5 | 4 | 2 | 4 | 2 | |
| 153 | Perverting the course of justice | 99 | 56 | 89 | 47 | 100 | 64 | 62 | 34 | 54 | 37 | |
| 154 | Offences while in custody and related offences | 485 | 455 | 362 | 336 | 273 | 260 | 167 | 159 | 158 | 148 | |
| 155 | Breach of justice/court order | 10,263 | 10,253 | 9,101 | 9,093 | 8,776 | 8,770 | 8,656 | 8,648 | 9,231 | 9,215 | |
| 16 | Offences not elsewhere classified | 3,475 | 2,090 | 2,990 | 1,458 | 3,060 | 1,538 | 2,724 | 1,231 | 2,641 | 1,127 | |
| 161 | Importation/Control/Welfare of animals offences | 2,069 | 790 | 2,171 | 719 | 2,103 | 660 | 2,081 | 649 | 2,131 | 676 | |
| 162 | Fisheries/Maritime offences | 26 | 25 | 28 | 24 | 28 | 27 | 35 | 31 | 22 | 22 | |
| 163 | Use of data, electronic counterfeit and broadcasting | 69 | 30 | 44 | 15 | 51 | 18 | 48 | 16 | 30 | 6 | |
| 164 | Miscellaneous offences | 1,311 | 1,245 | 747 | 700 | 878 | 833 | 560 | 535 | 458 | 423 | |
| Table 3 Number of crime incidents recorded, detected, with relevant proceedings and court outcomes, 2014 | ||||||||||
| ICCS offence group | With | Court | Pending | |||||||
| relevant | proceedings | (incl. appeals | Non- | |||||||
| Recorded | Detected | proceedings | commenced | Conviction1 | allowed) | conviction | ||||
| 01 | Homicide offences | 81 | 64 | 55 | 55 | 20 | 30 | 5 | ||
| 011 | Murder/Manslaughter/Infanticide | 56 | 39 | 32 | 32 | 7 | 22 | 3 | ||
| 012 | Dangerous driving leading to death | 25 | 25 | 23 | 23 | 13 | 8 | 2 | ||
| 02 | Sexual offences | 2,044 | 964 | 403 | 395 | 86 | 289 | 20 | ||
| 021 | Rape and sexual assault | 1,894 | 878 | 346 | 338 | 80 | 239 | 19 | ||
| 022 | Other sexual offences | 150 | 86 | 57 | 57 | 6 | 50 | 1 | ||
| 03 | Attempts/Threats to murder, assaults, harassments and related offences | |||||||||
| 15,133 | 8,775 | 4,098 | 4,000 | 1,216 | 955 | 1,829 | ||||
| 031 | Attempts/Threats to murder | 430 | 237 | 108 | 106 | 43 | 37 | 26 | ||
| 032 | Assaults | 13,226 | 8,122 | 3,844 | 3,753 | 1,136 | 853 | 1,764 | ||
| 033 | Harassment and related offences | 1,477 | 416 | 146 | 141 | 37 | 65 | 39 | ||
| 04 | Dangerous or negligent acts | 274,071 | 273,278 | 46,188 | 41,538 | 13,634 | 994 | 26,910 | ||
| 041 | Dangerous or negligent operation of a vehicle | 273,601 | 272,970 | 46,052 | 41,406 | 13,593 | 928 | 26,885 | ||
| 042 | Other dangerous or negligent acts | 470 | 308 | 136 | 132 | 41 | 66 | 25 | ||
| 05 | Kidnapping and related offences | 127 | 60 | 18 | 17 | 4 | 9 | 4 | ||
| 051 | False imprisonment, abduction | 127 | 60 | 18 | 17 | 4 | 9 | 4 | ||
| 06 | Robbery, extortion and hijacking offences | 2,650 | 1,061 | 727 | 722 | 402 | 242 | 78 | ||
| 061 | Robbery | 2,530 | 1,000 | 691 | 687 | 381 | 233 | 73 | ||
| 062 | Extortion offences | 22 | 8 | 3 | 3 | 2 | - | 1 | ||
| 063 | Hijacking offences | 98 | 53 | 33 | 32 | 19 | 9 | 4 | ||
| 07 | Burglary and related offences | 27,653 | 4,883 | 3,369 | 3,294 | 2,002 | 620 | 672 | ||
| 071 | Burglary | 27,653 | 4,883 | 3,369 | 3,294 | 2,002 | 620 | 672 | ||
| 08 | Theft and related offences | 77,629 | 25,506 | 15,016 | 14,708 | 7,557 | 2,499 | 4,652 | ||
| 081 | Theft/Taking of vehicle and related offences | 7,763 | 1,346 | 853 | 830 | 445 | 122 | 263 | ||
| 082 | Theft (not vehicle) | 68,476 | 22,782 | 13,272 | 13,009 | 6,714 | 2,214 | 4,081 | ||
| 083 | Handling stolen property | 1,390 | 1,378 | 891 | 869 | 398 | 163 | 308 | ||
| 09 | Fraud, deception and related offences | 5,155 | 1,951 | 1,182 | 1,161 | 533 | 293 | 335 | ||
| 091 | Fraud, forgery and false instrument offences | 4,559 | 1,697 | 1,065 | 1,045 | 461 | 276 | 308 | ||
| 092 | Other fraud | 115 | 76 | 15 | 15 | 8 | 4 | 3 | ||
| 093 | Counterfeiting currency and related offences | 481 | 178 | 102 | 101 | 64 | 13 | 24 | ||
| 094 | Corruption | - | - | - | - | - | - | - | ||
| 10 | Controlled drug offences | 15,872 | 15,680 | 10,859 | 10,445 | 3,626 | 1,263 | 5,556 | ||
| 101 | Importation/Manufacture of drugs | 374 | 368 | 278 | 277 | 145 | 61 | 71 | ||
| 102 | Possession of drugs | 14,819 | 14,636 | 10,081 | 9,683 | 3,269 | 1,142 | 5,272 | ||
| 103 | Other drug offences | 679 | 676 | 500 | 485 | 212 | 60 | 213 | ||
| 11 | Weapons and explosives offences | 2,477 | 2,247 | 1,480 | 1,444 | 727 | 231 | 486 | ||
| 111 | Explosives, chemical weapons offences | 50 | 16 | 8 | 8 | 6 | 1 | 1 | ||
| 112 | Firearms offences | 333 | 223 | 127 | 125 | 54 | 33 | 38 | ||
| 113 | Offensive weapons offences (NEC) | 1,981 | 1,939 | 1,337 | 1,303 | 664 | 196 | 443 | ||
| 114 | Fireworks offences | 113 | 69 | 8 | 8 | 3 | 1 | 4 | ||
| 12 | Damage to property and to the environment | 27,343 | 6,028 | 3,066 | 2,976 | 1,246 | 547 | 1,183 | ||
| 121 | Criminal damage | 27,095 | 5,943 | 3,036 | 2,946 | 1,229 | 546 | 1,171 | ||
| 122 | Environmental damage | 248 | 85 | 30 | 30 | 17 | 1 | 12 | ||
| 13 | Public order and other social code offences | 32,612 | 30,258 | 14,710 | 14,243 | 7,635 | 1,341 | 5,267 | ||
| 131 | Disorderly conduct | 26,803 | 25,961 | 12,941 | 12,519 | 6,837 | 1,141 | 4,541 | ||
| 132 | Trespass offences | 2,815 | 1,695 | 967 | 941 | 422 | 119 | 400 | ||
| 133 | Liquor licensing offences | 1,272 | 1,085 | 369 | 364 | 182 | 6 | 176 | ||
| 134 | Prostitution offences | 129 | 116 | 36 | 34 | 8 | 6 | 20 | ||
| 135 | Regulated betting/Money, collection/trading offences | 291 | 255 | 94 | 93 | 39 | 8 | 46 | ||
| 136 | Social code offences (NEC) | 1,302 | 1,146 | 303 | 292 | 147 | 61 | 84 | ||
| 14 | Road and traffic offences (NEC) | 149,247 | 148,072 | 64,793 | 62,504 | 24,561 | 1,223 | 36,720 | ||
| 141 | Driving licence/insurance offences | 14,464 | 14,406 | 10,806 | 10,482 | 3,770 | 251 | 6,461 | ||
| 142 | Tax/Registration offences | 32,448 | 32,427 | 11,099 | 10,324 | 3,937 | 22 | 6,365 | ||
| 143 | Roadworthiness/Regulatory offences | 95,398 | 95,018 | 41,461 | 40,294 | 16,419 | 916 | 22,959 | ||
| 144 | Road transport/public service vehicles offences | 6,937 | 6,221 | 1,427 | 1,404 | 435 | 34 | 935 | ||
| 15 | Offences against Government, justice procedures and organisation of crime | |||||||||
| 9,773 | 9,659 | 4,870 | 4,776 | 2,442 | 592 | 1,742 | ||||
| 151 | Offences against Government and its agents | 326 | 257 | 149 | 139 | 30 | 17 | 92 | ||
| 152 | Organisation of crime and conspiracy to commit crime | 4 | 2 | - | - | - | - | - | ||
| 153 | Perverting the course of justice | 54 | 37 | 11 | 11 | 9 | - | 2 | ||
| 154 | Offences while in custody and related offences | 158 | 148 | 76 | 70 | 55 | 3 | 12 | ||
| 155 | Breach of justice/court order | 9,231 | 9,215 | 4,634 | 4,556 | 2,348 | 572 | 1,636 | ||
| 16 | Offences not elsewhere classified | 2,641 | 1,127 | 356 | 352 | 147 | 54 | 151 | ||
| 161 | Importation/Control/Welfare of animals offences | 2,131 | 676 | 254 | 250 | 109 | 32 | 109 | ||
| 162 | Fisheries/Maritime offences | 22 | 22 | 8 | 8 | 7 | - | 1 | ||
| 163 | Use of data, electronic counterfeit and broadcasting | 30 | 6 | 3 | 3 | 2 | - | 1 | ||
| 164 | Miscellaneous offences | 458 | 423 | 91 | 91 | 29 | 22 | 40 | ||
| 1 Includes Conviction, Proved and order made without conviction, Probation of Offenders Act. | ||||||||||
| Table 4 Persons convicted1 of relevant offences for crime incidents recorded in 2014 | ||||||||||||||||||||||
| Total | Male | Total | Female | Total | All Persons | |||||||||||||||||
| Males | Under 18 | 18-24 | 25-44 | 45+ | Unavailable | Females | Under 18 | 18-24 | 25-44 | 45+ | Unavailable | Persons | Under 18 | 18-24 | 25-44 | 45+ | Unavailable | |||||
| 01 | Homicide offences | 19 | - | 5 | 12 | 2 | - | 3 | - | - | 3 | - | - | 22 | - | 5 | 15 | 2 | - | |||
| 02 | Sexual offences | 86 | 2 | 6 | 25 | 53 | - | - | - | - | - | - | - | 86 | 2 | 6 | 25 | 53 | - | |||
| 03 | Attempts/Threats to murder, assaults, harassments and related offences | 1,149 | 82 | 398 | 531 | 138 | - | 144 | 12 | 37 | 77 | 18 | - | 1,293 | 94 | 435 | 608 | 156 | - | |||
| 04 | Dangerous or negligent acts | 10,259 | 50 | 1,475 | 3,614 | 1,505 | 3,615 | 3,243 | 1 | 200 | 819 | 377 | 1,846 | 13,502 | 51 | 1,675 | 4,433 | 1,882 | 5,461 | |||
| 05 | Kidnapping and related offences | 4 | - | 1 | 3 | - | - | 1 | - | 1 | - | - | - | 5 | - | 2 | 3 | - | - | |||
| 06 | Robbery, extortion and hijacking offences | 450 | 96 | 147 | 197 | 10 | - | 21 | - | 10 | 11 | - | - | 471 | 96 | 157 | 208 | 10 | - | |||
| 07 | Burglary and related offences | 2,058 | 208 | 608 | 1,119 | 122 | 1 | 129 | 1 | 30 | 90 | 8 | - | 2,187 | 209 | 638 | 1,209 | 130 | 1 | |||
| 08 | Theft and related offences | 5,648 | 427 | 1,629 | 3,106 | 479 | 7 | 2,360 | 45 | 473 | 1,603 | 238 | 1 | 8,008 | 472 | 2,102 | 4,709 | 717 | 8 | |||
| 09 | Fraud, deception and related offences | 496 | 2 | 141 | 254 | 99 | - | 83 | 2 | 20 | 48 | 13 | - | 579 | 4 | 161 | 302 | 112 | - | |||
| 10 | Controlled drug offences | 3,446 | 63 | 1,327 | 1,874 | 182 | - | 269 | - | 78 | 168 | 23 | - | 3,715 | 63 | 1,405 | 2,042 | 205 | - | |||
| 11 | Weapons and explosives offences | 695 | 41 | 279 | 327 | 47 | 1 | 42 | 2 | 9 | 28 | 3 | - | 737 | 43 | 288 | 355 | 50 | 1 | |||
| 12 | Damage to property and to the environment | 1,277 | 229 | 426 | 515 | 107 | - | 67 | 3 | 18 | 36 | 10 | - | 1,344 | 232 | 444 | 551 | 117 | - | |||
| 13 | Public order and other social code offences | 7,103 | 239 | 2,327 | 3,511 | 1,023 | 3 | 929 | 18 | 196 | 556 | 159 | - | 8,032 | 257 | 2,523 | 4,067 | 1,182 | 3 | |||
| 14 | Road and traffic offences (NEC) | 18,747 | 96 | 4,584 | 9,507 | 2,880 | 1,680 | 5,714 | 3 | 934 | 3,178 | 729 | 870 | 24,461 | 99 | 5,518 | 12,685 | 3,609 | 2,550 | |||
| 15 | Offences against Government, justice procedures and organisation of crime | 2,039 | 47 | 633 | 1,123 | 232 | 4 | 404 | 1 | 91 | 283 | 29 | - | 2,443 | 48 | 724 | 1,406 | 261 | 4 | |||
| 16 | Offences not elsewhere classified | 126 | - | 32 | 62 | 32 | - | 28 | - | - | 18 | 10 | - | 154 | - | 32 | 80 | 42 | - | |||
| 1 Includes Conviction, Proved and order made without conviction, Probation of Offenders Act. | ||||||||||||||||||||||
| Table 5 Crime incidents recorded by Garda Division, incidents per 100,000 population, incidents detected and detection rate, 2014 | ||||||||
| Group 02 Sexual Offences | Recorded | Per 100,000 population | Detected | Detection rate (%) | ||||
| State | 2,044 | 44.3 | 964 | 47.2 | ||||
| Northern Region | 213 | 40.9 | 110 | 51.6 | ||||
| Cavan/Monaghan | 45 | 33.5 | 31 | 68.9 | ||||
| Donegal | 80 | 49.4 | 34 | 42.5 | ||||
| Sligo/Leitrim | 35 | 35.6 | 20 | 57.1 | ||||
| Louth | 53 | 41.9 | 25 | 47.2 | ||||
| Western Region | 212 | 35.9 | 101 | 47.6 | ||||
| Clare | 46 | 41.9 | 33 | 71.7 | ||||
| Mayo | 35 | 26.5 | 13 | 37.1 | ||||
| Galway | 92 | 36.5 | 43 | 46.7 | ||||
| Roscommon/Longford | 39 | 40.4 | 12 | 30.8 | ||||
| Southern Region | 333 | 38.2 | 166 | 49.8 | ||||
| Cork City | 106 | 46.1 | 45 | 42.5 | ||||
| Cork North | 59 | 37.8 | 30 | 50.8 | ||||
| Cork West | 39 | 27.6 | 23 | 59.0 | ||||
| Kerry | 59 | 41.5 | 28 | 47.5 | ||||
| Limerick | 70 | 34.7 | 40 | 57.1 | ||||
| Eastern Region | 348 | 44.9 | 181 | 52.0 | ||||
| Laois/Offaly | 59 | 38.7 | 40 | 67.8 | ||||
| Meath | 75 | 41.2 | 27 | 36.0 | ||||
| Wicklow | 66 | 47.9 | 33 | 50.0 | ||||
| Westmeath | 30 | 32.6 | 21 | 70.0 | ||||
| Kildare | 118 | 55.9 | 60 | 50.8 | ||||
| South Eastern Region | 280 | 48.9 | 145 | 51.8 | ||||
| Tipperary | 63 | 39.6 | 33 | 52.4 | ||||
| Wexford | 69 | 47.2 | 28 | 40.6 | ||||
| Kilkenny/Carlow | 76 | 51.2 | 35 | 46.1 | ||||
| Waterford | 72 | 60.5 | 49 | 68.1 | ||||
| Dublin Metropolitan Region | 658 | 51.5 | 261 | 39.7 | ||||
| South Central DMR | 84 | 67.3 | 40 | 47.6 | ||||
| North Central DMR | 75 | 86.1 | 22 | 29.3 | ||||
| Northern DMR | 208 | 62.5 | 79 | 38.0 | ||||
| Southern DMR | 88 | 36.5 | 44 | 50.0 | ||||
| Eastern DMR | 63 | 32.9 | 19 | 30.2 | ||||
| Western DMR | 140 | 46.5 | 57 | 40.7 | ||||
| Group 03 Attempts or Threats to Murder, Assaults, Harassment and Related Offences | Recorded | Per 100,000 population | Detected | Detection rate (%) | ||||
| State | 15,133 | 328.3 | 8,775 | 58.0 | ||||
| Northern Region | 2,048 | 393.1 | 1,342 | 65.5 | ||||
| Cavan/Monaghan | 484 | 360.3 | 442 | 91.3 | ||||
| Donegal | 739 | 456.4 | 462 | 62.5 | ||||
| Sligo/Leitrim | 306 | 311.1 | 152 | 49.7 | ||||
| Louth | 519 | 410.5 | 286 | 55.1 | ||||
| Western Region | 1,804 | 305.6 | 1,087 | 60.3 | ||||
| Clare | 303 | 276.1 | 268 | 88.4 | ||||
| Mayo | 378 | 286.7 | 180 | 47.6 | ||||
| Galway | 739 | 293.2 | 436 | 59.0 | ||||
| Roscommon/Longford | 384 | 397.4 | 203 | 52.9 | ||||
| Southern Region | 2,850 | 327.1 | 1,940 | 68.1 | ||||
| Cork City | 1,037 | 451.0 | 615 | 59.3 | ||||
| Cork North | 422 | 270.5 | 289 | 68.5 | ||||
| Cork West | 320 | 226.5 | 219 | 68.4 | ||||
| Kerry | 426 | 299.5 | 338 | 79.3 | ||||
| Limerick | 645 | 319.4 | 479 | 74.3 | ||||
| Eastern Region | 2,216 | 285.8 | 1,381 | 62.3 | ||||
| Laois/Offaly | 491 | 322.0 | 399 | 81.3 | ||||
| Meath | 413 | 226.8 | 248 | 60.0 | ||||
| Wicklow | 481 | 349.1 | 267 | 55.5 | ||||
| Westmeath | 299 | 324.6 | 193 | 64.5 | ||||
| Kildare | 532 | 252.2 | 274 | 51.5 | ||||
| South Eastern Region | 1,689 | 294.9 | 1,161 | 68.7 | ||||
| Tipperary | 377 | 237.0 | 304 | 80.6 | ||||
| Wexford | 371 | 253.7 | 229 | 61.7 | ||||
| Kilkenny/Carlow | 454 | 306.1 | 297 | 65.4 | ||||
| Waterford | 487 | 409.2 | 331 | 68.0 | ||||
| Dublin Metropolitan Region | 4,526 | 353.9 | 1,864 | 41.2 | ||||
| South Central DMR | 932 | 746.4 | 372 | 39.9 | ||||
| North Central DMR | 797 | 915.1 | 339 | 42.5 | ||||
| Northern DMR | 809 | 243.1 | 287 | 35.5 | ||||
| Southern DMR | 716 | 296.8 | 329 | 45.9 | ||||
| Eastern DMR | 422 | 220.2 | 171 | 40.5 | ||||
| Western DMR | 852 | 282.9 | 366 | 43.0 | ||||
| Group 04 Dangerous or Negligent Acts | Recorded | Per 100,000 population | Detected | Detection rate (%) | ||||
| State | 274,071 | 5,945.7 | 273,278 | 99.7 | ||||
| Northern Region | 29,930 | 5,744.2 | 29,736 | 99.4 | ||||
| Cavan/Monaghan | 8,929 | 6,646.5 | 8,893 | 99.6 | ||||
| Donegal | 6,362 | 3,929.2 | 6,270 | 98.6 | ||||
| Sligo/Leitrim | 8,147 | 8,282.9 | 8,130 | 99.8 | ||||
| Louth | 6,492 | 5,134.9 | 6,443 | 99.2 | ||||
| Western Region | 37,809 | 6,404.9 | 37,739 | 99.8 | ||||
| Clare | 7,648 | 6,968.6 | 7,635 | 99.8 | ||||
| Mayo | 4,185 | 3,174.0 | 4,170 | 99.6 | ||||
| Galway | 18,401 | 7,299.7 | 18,372 | 99.8 | ||||
| Roscommon/Longford | 7,575 | 7,838.9 | 7,562 | 99.8 | ||||
| Southern Region | 53,767 | 6,170.4 | 53,643 | 99.8 | ||||
| Cork City | 9,903 | 4,307.4 | 9,876 | 99.7 | ||||
| Cork North | 12,343 | 7,912.9 | 12,320 | 99.8 | ||||
| Cork West | 6,422 | 4,545.2 | 6,404 | 99.7 | ||||
| Kerry | 6,597 | 4,638.7 | 6,578 | 99.7 | ||||
| Limerick | 18,502 | 9,160.8 | 18,465 | 99.8 | ||||
| Eastern Region | 52,208 | 6,733.2 | 52,115 | 99.8 | ||||
| Laois/Offaly | 7,956 | 5,217.9 | 7,936 | 99.7 | ||||
| Meath | 6,997 | 3,843.2 | 6,986 | 99.8 | ||||
| Wicklow | 9,038 | 6,559.0 | 9,019 | 99.8 | ||||
| Westmeath | 10,455 | 11,351.8 | 10,443 | 99.9 | ||||
| Kildare | 17,762 | 8,419.9 | 17,731 | 99.8 | ||||
| South Eastern Region | 39,810 | 6,951.8 | 39,758 | 99.9 | ||||
| Tipperary | 10,104 | 6,352.3 | 10,087 | 99.8 | ||||
| Wexford | 9,431 | 6,448.3 | 9,417 | 99.9 | ||||
| Kilkenny/Carlow | 11,947 | 8,054.8 | 11,942 | 100.0 | ||||
| Waterford | 8,328 | 6,997.2 | 8,312 | 99.8 | ||||
| Dublin Metropolitan Region | 60,547 | 4,734.6 | 60,287 | 99.6 | ||||
| South Central DMR | 9,405 | 7,532.3 | 9,380 | 99.7 | ||||
| North Central DMR | 4,295 | 4,931.6 | 4,268 | 99.4 | ||||
| Northern DMR | 12,397 | 3,725.7 | 12,341 | 99.5 | ||||
| Southern DMR | 4,345 | 1,800.9 | 4,310 | 99.2 | ||||
| Eastern DMR | 9,659 | 5,039.8 | 9,639 | 99.8 | ||||
| Western DMR | 20,446 | 6,788.3 | 20,349 | 99.5 | ||||
| Group 06 Robbery, Extortion and Hijacking Offences | Recorded | Per 100,000 population | Detected | Detection rate (%) | ||||
| State | 2,650 | 57.5 | 1,061 | 40.0 | ||||
| Northern Region | 104 | 20.0 | 41 | 39.4 | ||||
| Cavan/Monaghan | 12 | 8.9 | 8 | 66.7 | ||||
| Donegal | 19 | 11.7 | 8 | 42.1 | ||||
| Sligo/Leitrim | 8 | 8.1 | 2 | 25.0 | ||||
| Louth | 65 | 51.4 | 23 | 35.4 | ||||
| Western Region | 90 | 15.2 | 58 | 64.4 | ||||
| Clare | 30 | 27.3 | 25 | 83.3 | ||||
| Mayo | 15 | 11.4 | 6 | 40.0 | ||||
| Galway | 34 | 13.5 | 20 | 58.8 | ||||
| Roscommon/Longford | 11 | 11.4 | 7 | 63.6 | ||||
| Southern Region | 223 | 25.6 | 138 | 61.9 | ||||
| Cork City | 124 | 53.9 | 75 | 60.5 | ||||
| Cork North | 9 | 5.8 | 7 | 77.8 | ||||
| Cork West | 2 | 1.4 | 1 | 50.0 | ||||
| Kerry | 9 | 6.3 | 8 | 88.9 | ||||
| Limerick | 79 | 39.1 | 47 | 59.5 | ||||
| Eastern Region | 214 | 27.6 | 110 | 51.4 | ||||
| Laois/Offaly | 26 | 17.1 | 15 | 57.7 | ||||
| Meath | 55 | 30.2 | 26 | 47.3 | ||||
| Wicklow | 44 | 31.9 | 26 | 59.1 | ||||
| Westmeath | 32 | 34.7 | 19 | 59.4 | ||||
| Kildare | 57 | 27.0 | 24 | 42.1 | ||||
| South Eastern Region | 128 | 22.4 | 80 | 62.5 | ||||
| Tipperary | 21 | 13.2 | 16 | 76.2 | ||||
| Wexford | 40 | 27.3 | 23 | 57.5 | ||||
| Kilkenny/Carlow | 31 | 20.9 | 19 | 61.3 | ||||
| Waterford | 36 | 30.2 | 22 | 61.1 | ||||
| Dublin Metropolitan Region | 1,891 | 147.9 | 634 | 33.5 | ||||
| South Central DMR | 395 | 316.3 | 163 | 41.3 | ||||
| North Central DMR | 342 | 392.7 | 127 | 37.1 | ||||
| Northern DMR | 268 | 80.5 | 79 | 29.5 | ||||
| Southern DMR | 315 | 130.6 | 90 | 28.6 | ||||
| Eastern DMR | 123 | 64.2 | 55 | 44.7 | ||||
| Western DMR | 448 | 148.7 | 120 | 26.8 | ||||
| Group 07 Burglary and Related Offences | Recorded | Per 100,000 population | Detected | Detection rate (%) | ||||
| State | 27,653 | 599.9 | 4,883 | 17.7 | ||||
| Northern Region | 2,200 | 422.2 | 425 | 19.3 | ||||
| Cavan/Monaghan | 354 | 263.5 | 107 | 30.2 | ||||
| Donegal | 406 | 250.7 | 65 | 16.0 | ||||
| Sligo/Leitrim | 370 | 376.2 | 70 | 18.9 | ||||
| Louth | 1,070 | 846.3 | 183 | 17.1 | ||||
| Western Region | 2,091 | 354.2 | 438 | 20.9 | ||||
| Clare | 353 | 321.6 | 87 | 24.6 | ||||
| Mayo | 323 | 245.0 | 50 | 15.5 | ||||
| Galway | 992 | 393.5 | 209 | 21.1 | ||||
| Roscommon/Longford | 423 | 437.7 | 92 | 21.7 | ||||
| Southern Region | 2,772 | 318.1 | 777 | 28.0 | ||||
| Cork City | 697 | 303.2 | 235 | 33.7 | ||||
| Cork North | 352 | 225.7 | 63 | 17.9 | ||||
| Cork West | 270 | 191.1 | 60 | 22.2 | ||||
| Kerry | 360 | 253.1 | 122 | 33.9 | ||||
| Limerick | 1,093 | 541.2 | 297 | 27.2 | ||||
| Eastern Region | 4,970 | 641.0 | 712 | 14.3 | ||||
| Laois/Offaly | 1,085 | 711.6 | 216 | 19.9 | ||||
| Meath | 951 | 522.4 | 113 | 11.9 | ||||
| Wicklow | 926 | 672.0 | 105 | 11.3 | ||||
| Westmeath | 578 | 627.6 | 146 | 25.3 | ||||
| Kildare | 1,430 | 677.9 | 132 | 9.2 | ||||
| South Eastern Region | 3,402 | 594.1 | 672 | 19.8 | ||||
| Tipperary | 637 | 400.5 | 166 | 26.1 | ||||
| Wexford | 1,001 | 684.4 | 129 | 12.9 | ||||
| Kilkenny/Carlow | 927 | 625.0 | 180 | 19.4 | ||||
| Waterford | 837 | 703.2 | 197 | 23.5 | ||||
| Dublin Metropolitan Region | 12,218 | 955.4 | 1,859 | 15.2 | ||||
| South Central DMR | 1,766 | 1,414.4 | 476 | 27.0 | ||||
| North Central DMR | 1,112 | 1,276.8 | 342 | 30.8 | ||||
| Northern DMR | 2,521 | 757.6 | 269 | 10.7 | ||||
| Southern DMR | 2,491 | 1,032.5 | 286 | 11.5 | ||||
| Eastern DMR | 1,861 | 971.0 | 205 | 11.0 | ||||
| Western DMR | 2,467 | 819.1 | 281 | 11.4 | ||||
| Group 08 Theft and Related Offences | Recorded | Per 100,000 population | Detected | Detection rate (%) | ||||
| State | 77,629 | 1,684.1 | 25,506 | 32.9 | ||||
| Northern Region | 5,032 | 965.7 | 1,826 | 36.3 | ||||
| Cavan/Monaghan | 1,100 | 818.8 | 498 | 45.3 | ||||
| Donegal | 1,011 | 624.4 | 426 | 42.1 | ||||
| Sligo/Leitrim | 796 | 809.3 | 307 | 38.6 | ||||
| Louth | 2,125 | 1,680.8 | 595 | 28.0 | ||||
| Western Region | 4,753 | 805.2 | 1,904 | 40.1 | ||||
| Clare | 940 | 856.5 | 453 | 48.2 | ||||
| Mayo | 842 | 638.6 | 320 | 38.0 | ||||
| Galway | 2,263 | 897.7 | 875 | 38.7 | ||||
| Roscommon/Longford | 708 | 732.7 | 256 | 36.2 | ||||
| Southern Region | 11,001 | 1,262.5 | 5,002 | 45.5 | ||||
| Cork City | 3,792 | 1,649.4 | 1,841 | 48.5 | ||||
| Cork North | 1,121 | 718.7 | 486 | 43.4 | ||||
| Cork West | 797 | 564.1 | 334 | 41.9 | ||||
| Kerry | 1,185 | 833.2 | 726 | 61.3 | ||||
| Limerick | 4,106 | 2,033.0 | 1,615 | 39.3 | ||||
| Eastern Region | 10,885 | 1,403.8 | 3,155 | 29.0 | ||||
| Laois/Offaly | 2,045 | 1,341.2 | 626 | 30.6 | ||||
| Meath | 2,442 | 1,341.3 | 665 | 27.2 | ||||
| Wicklow | 2,244 | 1,628.5 | 622 | 27.7 | ||||
| Westmeath | 1,186 | 1,287.7 | 474 | 40.0 | ||||
| Kildare | 2,968 | 1,406.9 | 768 | 25.9 | ||||
| South Eastern Region | 6,759 | 1,180.3 | 2,858 | 42.3 | ||||
| Tipperary | 1,430 | 899.0 | 659 | 46.1 | ||||
| Wexford | 1,631 | 1,115.2 | 590 | 36.2 | ||||
| Kilkenny/Carlow | 1,826 | 1,231.1 | 691 | 37.8 | ||||
| Waterford | 1,872 | 1,572.9 | 918 | 49.0 | ||||
| Dublin Metropolitan Region | 39,199 | 3,065.2 | 10,761 | 27.5 | ||||
| South Central DMR | 9,390 | 7,520.3 | 2,197 | 23.4 | ||||
| North Central DMR | 7,651 | 8,785.0 | 3,110 | 40.6 | ||||
| Northern DMR | 6,179 | 1,857.0 | 1,527 | 24.7 | ||||
| Southern DMR | 4,652 | 1,928.1 | 1,096 | 23.6 | ||||
| Eastern DMR | 3,692 | 1,926.4 | 937 | 25.4 | ||||
| Western DMR | 7,635 | 2,534.9 | 1,894 | 24.8 | ||||
| Group 09 Fraud, Deception and Related Offences | Recorded | Per 100,000 population | Detected | Detection rate (%) | ||||
| State | 5,155 | 111.8 | 1,951 | 37.8 | ||||
| Northern Region | 415 | 79.6 | 171 | 41.2 | ||||
| Cavan/Monaghan | 99 | 73.7 | 65 | 65.7 | ||||
| Donegal | 93 | 57.4 | 29 | 31.2 | ||||
| Sligo/Leitrim | 81 | 82.4 | 23 | 28.4 | ||||
| Louth | 142 | 112.3 | 54 | 38.0 | ||||
| Western Region | 569 | 96.4 | 274 | 48.2 | ||||
| Clare | 56 | 51.0 | 32 | 57.1 | ||||
| Mayo | 85 | 64.5 | 33 | 38.8 | ||||
| Galway | 316 | 125.4 | 164 | 51.9 | ||||
| Roscommon/Longford | 112 | 115.9 | 45 | 40.2 | ||||
| Southern Region | 719 | 82.5 | 374 | 52.0 | ||||
| Cork City | 235 | 102.2 | 109 | 46.4 | ||||
| Cork North | 124 | 79.5 | 97 | 78.2 | ||||
| Cork West | 89 | 63.0 | 47 | 52.8 | ||||
| Kerry | 91 | 64.0 | 50 | 54.9 | ||||
| Limerick | 180 | 89.1 | 71 | 39.4 | ||||
| Eastern Region | 692 | 89.2 | 230 | 33.2 | ||||
| Laois/Offaly | 125 | 82.0 | 42 | 33.6 | ||||
| Meath | 126 | 69.2 | 36 | 28.6 | ||||
| Wicklow | 150 | 108.9 | 44 | 29.3 | ||||
| Westmeath | 100 | 108.6 | 44 | 44.0 | ||||
| Kildare | 191 | 90.5 | 64 | 33.5 | ||||
| South Eastern Region | 369 | 64.4 | 171 | 46.3 | ||||
| Tipperary | 90 | 56.6 | 56 | 62.2 | ||||
| Wexford | 96 | 65.6 | 37 | 38.5 | ||||
| Kilkenny/Carlow | 90 | 60.7 | 41 | 45.6 | ||||
| Waterford | 93 | 78.1 | 37 | 39.8 | ||||
| Dublin Metropolitan Region | 2,391 | 187.0 | 731 | 30.6 | ||||
| South Central DMR | 505 | 404.4 | 141 | 27.9 | ||||
| North Central DMR | 368 | 422.5 | 116 | 31.5 | ||||
| Northern DMR | 472 | 141.8 | 126 | 26.7 | ||||
| Southern DMR | 280 | 116.1 | 81 | 28.9 | ||||
| Eastern DMR | 261 | 136.2 | 63 | 24.1 | ||||
| Western DMR | 505 | 167.7 | 204 | 40.4 | ||||
| Group 10 Controlled Drug Offences | Recorded | Per 100,000 population | Detected | Detection rate (%) | ||||
| State | 15,872 | 344.3 | 15,680 | 98.8 | ||||
| Northern Region | 871 | 167.2 | 857 | 98.4 | ||||
| Cavan/Monaghan | 202 | 150.4 | 199 | 98.5 | ||||
| Donegal | 211 | 130.3 | 205 | 97.2 | ||||
| Sligo/Leitrim | 173 | 175.9 | 171 | 98.8 | ||||
| Louth | 285 | 225.4 | 282 | 98.9 | ||||
| Western Region | 1,330 | 225.3 | 1,305 | 98.1 | ||||
| Clare | 403 | 367.2 | 400 | 99.3 | ||||
| Mayo | 142 | 107.7 | 130 | 91.5 | ||||
| Galway | 572 | 226.9 | 567 | 99.1 | ||||
| Roscommon/Longford | 213 | 220.4 | 208 | 97.7 | ||||
| Southern Region | 2,745 | 315.0 | 2,731 | 99.5 | ||||
| Cork City | 924 | 401.9 | 921 | 99.7 | ||||
| Cork North | 449 | 287.8 | 446 | 99.3 | ||||
| Cork West | 266 | 188.3 | 264 | 99.2 | ||||
| Kerry | 472 | 331.9 | 469 | 99.4 | ||||
| Limerick | 634 | 313.9 | 631 | 99.5 | ||||
| Eastern Region | 2,124 | 273.9 | 2,102 | 99.0 | ||||
| Laois/Offaly | 663 | 434.8 | 659 | 99.4 | ||||
| Meath | 216 | 118.6 | 213 | 98.6 | ||||
| Wicklow | 535 | 388.3 | 532 | 99.4 | ||||
| Westmeath | 353 | 383.3 | 348 | 98.6 | ||||
| Kildare | 357 | 169.2 | 350 | 98.0 | ||||
| South Eastern Region | 1,664 | 290.6 | 1,654 | 99.4 | ||||
| Tipperary | 572 | 359.6 | 571 | 99.8 | ||||
| Wexford | 250 | 170.9 | 248 | 99.2 | ||||
| Kilkenny/Carlow | 406 | 273.7 | 403 | 99.3 | ||||
| Waterford | 436 | 366.3 | 432 | 99.1 | ||||
| Dublin Metropolitan Region | 7,138 | 558.2 | 7,031 | 98.5 | ||||
| South Central DMR | 920 | 736.8 | 914 | 99.3 | ||||
| North Central DMR | 1,896 | 2,177.0 | 1,883 | 99.3 | ||||
| Northern DMR | 1,177 | 353.7 | 1,143 | 97.1 | ||||
| Southern DMR | 1,111 | 460.5 | 1,088 | 97.9 | ||||
| Eastern DMR | 272 | 141.9 | 271 | 99.6 | ||||
| Western DMR | 1,762 | 585.0 | 1,732 | 98.3 | ||||
| Group 11 Weapons and Explosive Offences | Recorded | Per 100,000 population | Detected | Detection rate (%) | ||||
| State | 2,477 | 53.7 | 2,247 | 90.7 | ||||
| Northern Region | 231 | 44.3 | 205 | 88.7 | ||||
| Cavan/Monaghan | 56 | 41.7 | 53 | 94.6 | ||||
| Donegal | 42 | 25.9 | 37 | 88.1 | ||||
| Sligo/Leitrim | 56 | 56.9 | 48 | 85.7 | ||||
| Louth | 77 | 60.9 | 67 | 87.0 | ||||
| Western Region | 176 | 29.8 | 163 | 92.6 | ||||
| Clare | 53 | 48.3 | 52 | 98.1 | ||||
| Mayo | 27 | 20.5 | 23 | 85.2 | ||||
| Galway | 66 | 26.2 | 62 | 93.9 | ||||
| Roscommon/Longford | 30 | 31.0 | 26 | 86.7 | ||||
| Southern Region | 433 | 49.7 | 406 | 93.8 | ||||
| Cork City | 136 | 59.2 | 128 | 94.1 | ||||
| Cork North | 33 | 21.2 | 33 | 100.0 | ||||
| Cork West | 19 | 13.4 | 18 | 94.7 | ||||
| Kerry | 61 | 42.9 | 60 | 98.4 | ||||
| Limerick | 184 | 91.1 | 167 | 90.8 | ||||
| Eastern Region | 278 | 35.9 | 250 | 89.9 | ||||
| Laois/Offaly | 56 | 36.7 | 51 | 91.1 | ||||
| Meath | 52 | 28.6 | 45 | 86.5 | ||||
| Wicklow | 65 | 47.2 | 60 | 92.3 | ||||
| Westmeath | 53 | 57.5 | 49 | 92.5 | ||||
| Kildare | 52 | 24.6 | 45 | 86.5 | ||||
| South Eastern Region | 229 | 40.0 | 215 | 93.9 | ||||
| Tipperary | 59 | 37.1 | 55 | 93.2 | ||||
| Wexford | 43 | 29.4 | 36 | 83.7 | ||||
| Kilkenny/Carlow | 60 | 40.5 | 60 | 100.0 | ||||
| Waterford | 67 | 56.3 | 64 | 95.5 | ||||
| Dublin Metropolitan Region | 1,130 | 88.4 | 1,008 | 89.2 | ||||
| South Central DMR | 225 | 180.2 | 213 | 94.7 | ||||
| North Central DMR | 214 | 245.7 | 204 | 95.3 | ||||
| Northern DMR | 167 | 50.2 | 128 | 76.6 | ||||
| Southern DMR | 196 | 81.2 | 163 | 83.2 | ||||
| Eastern DMR | 68 | 35.5 | 62 | 91.2 | ||||
| Western DMR | 260 | 86.3 | 238 | 91.5 | ||||
| Group 12 Damage to Property and to the Environment | Recorded | Per 100,000 population | Detected | Detection rate (%) | ||||
| State | 27,343 | 593.2 | 6,028 | 22.0 | ||||
| Northern Region | 2,751 | 528.0 | 756 | 27.5 | ||||
| Cavan/Monaghan | 516 | 384.1 | 236 | 45.7 | ||||
| Donegal | 672 | 415.0 | 232 | 34.5 | ||||
| Sligo/Leitrim | 515 | 523.6 | 91 | 17.7 | ||||
| Louth | 1,048 | 828.9 | 197 | 18.8 | ||||
| Western Region | 2,149 | 364.0 | 621 | 28.9 | ||||
| Clare | 392 | 357.2 | 140 | 35.7 | ||||
| Mayo | 462 | 350.4 | 100 | 21.6 | ||||
| Galway | 904 | 358.6 | 278 | 30.8 | ||||
| Roscommon/Longford | 391 | 404.6 | 103 | 26.3 | ||||
| Southern Region | 4,414 | 506.6 | 1,168 | 26.5 | ||||
| Cork City | 1,632 | 709.8 | 363 | 22.2 | ||||
| Cork North | 523 | 335.3 | 155 | 29.6 | ||||
| Cork West | 386 | 273.2 | 140 | 36.3 | ||||
| Kerry | 371 | 260.9 | 147 | 39.6 | ||||
| Limerick | 1,502 | 743.7 | 363 | 24.2 | ||||
| Eastern Region | 3,944 | 508.6 | 940 | 23.8 | ||||
| Laois/Offaly | 777 | 509.6 | 223 | 28.7 | ||||
| Meath | 723 | 397.1 | 190 | 26.3 | ||||
| Wicklow | 878 | 637.2 | 220 | 25.1 | ||||
| Westmeath | 557 | 604.8 | 130 | 23.3 | ||||
| Kildare | 1,009 | 478.3 | 177 | 17.5 | ||||
| South Eastern Region | 2,698 | 471.1 | 676 | 25.1 | ||||
| Tipperary | 532 | 334.5 | 168 | 31.6 | ||||
| Wexford | 758 | 518.3 | 127 | 16.8 | ||||
| Kilkenny/Carlow | 643 | 433.5 | 183 | 28.5 | ||||
| Waterford | 765 | 642.8 | 198 | 25.9 | ||||
| Dublin Metropolitan Region | 11,387 | 890.4 | 1,867 | 16.4 | ||||
| South Central DMR | 1,433 | 1,147.7 | 320 | 22.3 | ||||
| North Central DMR | 1,521 | 1,746.4 | 323 | 21.2 | ||||
| Northern DMR | 2,233 | 671.1 | 332 | 14.9 | ||||
| Southern DMR | 2,101 | 870.8 | 327 | 15.6 | ||||
| Eastern DMR | 1,217 | 635.0 | 180 | 14.8 | ||||
| Western DMR | 2,882 | 956.9 | 385 | 13.4 | ||||
| Group 13 Public Order and Other Social Code Offences | Recorded | Per 100,000 population | Detected | Detection rate (%) | ||||
| State | 32,612 | 707.5 | 30,258 | 92.8 | ||||
| Northern Region | 3,578 | 686.7 | 3,313 | 92.6 | ||||
| Cavan/Monaghan | 980 | 729.5 | 949 | 96.8 | ||||
| Donegal | 1,174 | 725.1 | 1,086 | 92.5 | ||||
| Sligo/Leitrim | 650 | 660.8 | 591 | 90.9 | ||||
| Louth | 774 | 612.2 | 687 | 88.8 | ||||
| Western Region | 3,953 | 669.6 | 3,720 | 94.1 | ||||
| Clare | 799 | 728.0 | 764 | 95.6 | ||||
| Mayo | 775 | 587.8 | 713 | 92.0 | ||||
| Galway | 1,910 | 757.7 | 1,824 | 95.5 | ||||
| Roscommon/Longford | 469 | 485.3 | 419 | 89.3 | ||||
| Southern Region | 7,720 | 886.0 | 7,404 | 95.9 | ||||
| Cork City | 2,637 | 1,147.0 | 2,534 | 96.1 | ||||
| Cork North | 940 | 602.6 | 914 | 97.2 | ||||
| Cork West | 712 | 503.9 | 689 | 96.8 | ||||
| Kerry | 1,522 | 1,070.2 | 1,489 | 97.8 | ||||
| Limerick | 1,909 | 945.2 | 1,778 | 93.1 | ||||
| Eastern Region | 3,718 | 479.5 | 3,368 | 90.6 | ||||
| Laois/Offaly | 744 | 487.9 | 692 | 93.0 | ||||
| Meath | 672 | 369.1 | 599 | 89.1 | ||||
| Wicklow | 931 | 675.6 | 826 | 88.7 | ||||
| Westmeath | 643 | 698.2 | 607 | 94.4 | ||||
| Kildare | 728 | 345.1 | 644 | 88.5 | ||||
| South Eastern Region | 4,096 | 715.3 | 3,785 | 92.4 | ||||
| Tipperary | 1,006 | 632.5 | 944 | 93.8 | ||||
| Wexford | 613 | 419.1 | 504 | 82.2 | ||||
| Kilkenny/Carlow | 1,490 | 1,004.6 | 1,414 | 94.9 | ||||
| Waterford | 987 | 829.3 | 923 | 93.5 | ||||
| Dublin Metropolitan Region | 9,547 | 746.5 | 8,668 | 90.8 | ||||
| South Central DMR | 2,956 | 2,367.4 | 2,753 | 93.1 | ||||
| North Central DMR | 1,803 | 2,070.2 | 1,703 | 94.5 | ||||
| Northern DMR | 1,265 | 380.2 | 1,083 | 85.6 | ||||
| Southern DMR | 1,184 | 490.7 | 1,065 | 89.9 | ||||
| Eastern DMR | 813 | 424.2 | 683 | 84.0 | ||||
| Western DMR | 1,526 | 506.6 | 1,381 | 90.5 | ||||
| Group 14 Road and Traffic Offences (NEC) | Recorded | Per 100,000 population | Detected | Detection rate (%) | ||||
| State | 149,247 | 3,237.7 | 148,072 | 99.2 | ||||
| Northern Region | 10,643 | 2,042.6 | 10,540 | 99.0 | ||||
| Cavan/Monaghan | 3,112 | 2,316.5 | 3,093 | 99.4 | ||||
| Donegal | 3,272 | 2,020.8 | 3,221 | 98.4 | ||||
| Sligo/Leitrim | 1,751 | 1,780.2 | 1,737 | 99.2 | ||||
| Louth | 2,508 | 1,983.7 | 2,489 | 99.2 | ||||
| Western Region | 20,492 | 3,471.4 | 20,367 | 99.4 | ||||
| Clare | 6,540 | 5,959.0 | 6,498 | 99.4 | ||||
| Mayo | 1,984 | 1,504.7 | 1,973 | 99.4 | ||||
| Galway | 8,882 | 3,523.5 | 8,833 | 99.4 | ||||
| Roscommon/Longford | 3,086 | 3,193.5 | 3,063 | 99.3 | ||||
| Southern Region | 36,711 | 4,213.0 | 36,301 | 98.9 | ||||
| Cork City | 11,578 | 5,035.9 | 11,495 | 99.3 | ||||
| Cork North | 6,742 | 4,322.2 | 6,668 | 98.9 | ||||
| Cork West | 4,248 | 3,006.5 | 4,181 | 98.4 | ||||
| Kerry | 3,565 | 2,506.7 | 3,537 | 99.2 | ||||
| Limerick | 10,578 | 5,237.4 | 10,420 | 98.5 | ||||
| Eastern Region | 18,385 | 2,371.1 | 18,264 | 99.3 | ||||
| Laois/Offaly | 3,774 | 2,475.1 | 3,752 | 99.4 | ||||
| Meath | 2,504 | 1,375.4 | 2,469 | 98.6 | ||||
| Wicklow | 3,867 | 2,806.3 | 3,844 | 99.4 | ||||
| Westmeath | 3,422 | 3,715.5 | 3,411 | 99.7 | ||||
| Kildare | 4,818 | 2,283.9 | 4,788 | 99.4 | ||||
| South Eastern Region | 15,983 | 2,791.0 | 15,806 | 98.9 | ||||
| Tipperary | 3,056 | 1,921.3 | 3,018 | 98.8 | ||||
| Wexford | 3,115 | 2,129.8 | 3,033 | 97.4 | ||||
| Kilkenny/Carlow | 5,459 | 3,680.5 | 5,433 | 99.5 | ||||
| Waterford | 4,353 | 3,657.4 | 4,322 | 99.3 | ||||
| Dublin Metropolitan Region | 47,033 | 3,677.8 | 46,794 | 99.5 | ||||
| South Central DMR | 8,775 | 7,027.7 | 8,741 | 99.6 | ||||
| North Central DMR | 6,792 | 7,798.7 | 6,759 | 99.5 | ||||
| Northern DMR | 8,921 | 2,681.0 | 8,857 | 99.3 | ||||
| Southern DMR | 5,892 | 2,442.1 | 5,860 | 99.5 | ||||
| Eastern DMR | 5,909 | 3,083.2 | 5,894 | 99.7 | ||||
| Western DMR | 10,744 | 3,567.1 | 10,683 | 99.4 | ||||
| Group 15 Offences against Government, Justice Procedures and Organisation of Crime | Recorded | Per 100,000 population | Detected | Detection rate (%) | ||||
| State | 9,773 | 212.0 | 9,659 | 98.8 | ||||
| Northern Region | 546 | 104.8 | 540 | 98.9 | ||||
| Cavan/Monaghan | 138 | 102.7 | 137 | 99.3 | ||||
| Donegal | 117 | 72.3 | 115 | 98.3 | ||||
| Sligo/Leitrim | 128 | 130.1 | 128 | 100.0 | ||||
| Louth | 163 | 128.9 | 160 | 98.2 | ||||
| Western Region | 680 | 115.2 | 667 | 98.1 | ||||
| Clare | 205 | 186.8 | 200 | 97.6 | ||||
| Mayo | 64 | 48.5 | 60 | 93.8 | ||||
| Galway | 298 | 118.2 | 297 | 99.7 | ||||
| Roscommon/Longford | 113 | 116.9 | 110 | 97.3 | ||||
| Southern Region | 1,879 | 215.6 | 1,851 | 98.5 | ||||
| Cork City | 469 | 204.0 | 460 | 98.1 | ||||
| Cork North | 127 | 81.4 | 126 | 99.2 | ||||
| Cork West | 109 | 77.1 | 109 | 100.0 | ||||
| Kerry | 191 | 134.3 | 188 | 98.4 | ||||
| Limerick | 983 | 486.7 | 968 | 98.5 | ||||
| Eastern Region | 1,005 | 129.6 | 978 | 97.3 | ||||
| Laois/Offaly | 180 | 118.1 | 176 | 97.8 | ||||
| Meath | 186 | 102.2 | 181 | 97.3 | ||||
| Wicklow | 248 | 180.0 | 235 | 94.8 | ||||
| Westmeath | 177 | 192.2 | 175 | 98.9 | ||||
| Kildare | 214 | 101.4 | 211 | 98.6 | ||||
| South Eastern Region | 629 | 109.8 | 623 | 99.0 | ||||
| Tipperary | 139 | 87.4 | 137 | 98.6 | ||||
| Wexford | 181 | 123.8 | 181 | 100.0 | ||||
| Kilkenny/Carlow | 164 | 110.6 | 162 | 98.8 | ||||
| Waterford | 145 | 121.8 | 143 | 98.6 | ||||
| Dublin Metropolitan Region | 5,034 | 393.6 | 5,000 | 99.3 | ||||
| South Central DMR | 159 | 127.3 | 157 | 98.7 | ||||
| North Central DMR | 3,231 | 3,709.9 | 3,227 | 99.9 | ||||
| Northern DMR | 341 | 102.5 | 329 | 96.5 | ||||
| Southern DMR | 367 | 152.1 | 359 | 97.8 | ||||
| Eastern DMR | 275 | 143.5 | 274 | 99.6 | ||||
| Western DMR | 661 | 219.5 | 654 | 98.9 | ||||
| Group 16 Offences Not Elsewhere Classified | Recorded | Per 100,000 population | Detected | Detection rate (%) | ||||
| State | 2,641 | 57.3 | 1,127 | 42.7 | ||||
| Northern Region | 305 | 58.5 | 108 | 35.4 | ||||
| Cavan/Monaghan | 72 | 53.6 | 28 | 38.9 | ||||
| Donegal | 101 | 62.4 | 41 | 40.6 | ||||
| Sligo/Leitrim | 89 | 90.5 | 24 | 27.0 | ||||
| Louth | 43 | 34.0 | 15 | 34.9 | ||||
| Western Region | 532 | 90.1 | 185 | 34.8 | ||||
| Clare | 75 | 68.3 | 46 | 61.3 | ||||
| Mayo | 112 | 84.9 | 41 | 36.6 | ||||
| Galway | 252 | 100.0 | 68 | 27.0 | ||||
| Roscommon/Longford | 93 | 96.2 | 30 | 32.3 | ||||
| Southern Region | 626 | 71.8 | 248 | 39.6 | ||||
| Cork City | 124 | 53.9 | 67 | 54.0 | ||||
| Cork North | 85 | 54.5 | 45 | 52.9 | ||||
| Cork West | 95 | 67.2 | 55 | 57.9 | ||||
| Kerry | 49 | 34.5 | 27 | 55.1 | ||||
| Limerick | 273 | 135.2 | 54 | 19.8 | ||||
| Eastern Region | 402 | 51.8 | 163 | 40.5 | ||||
| Laois/Offaly | 80 | 52.5 | 24 | 30.0 | ||||
| Meath | 58 | 31.9 | 21 | 36.2 | ||||
| Wicklow | 151 | 109.6 | 83 | 55.0 | ||||
| Westmeath | 33 | 35.8 | 11 | 33.3 | ||||
| Kildare | 80 | 37.9 | 24 | 30.0 | ||||
| South Eastern Region | 383 | 66.9 | 163 | 42.6 | ||||
| Tipperary | 99 | 62.2 | 36 | 36.4 | ||||
| Wexford | 127 | 86.8 | 53 | 41.7 | ||||
| Kilkenny/Carlow | 82 | 55.3 | 39 | 47.6 | ||||
| Waterford | 75 | 63.0 | 35 | 46.7 | ||||
| Dublin Metropolitan Region | 393 | 30.7 | 260 | 66.2 | ||||
| South Central DMR | 46 | 36.8 | 35 | 76.1 | ||||
| North Central DMR | 62 | 71.2 | 56 | 90.3 | ||||
| Northern DMR | 137 | 41.2 | 88 | 64.2 | ||||
| Southern DMR | 57 | 23.6 | 32 | 56.1 | ||||
| Eastern DMR | 21 | 11.0 | 7 | 33.3 | ||||
| Western DMR | 70 | 23.2 | 42 | 60.0 | ||||
Garda Recorded Crime Statistics 2010-2014 is the ninth annual CSO statistical report on crime in Ireland.
The release is based on administrative data recorded on An Garda Siochana’s PULSE (Police Using Leading Systems Effectively) and FCPS (Fixed Charge Penalty System) systems as extracted in summer 2016, and relates to crime and fixed charge notice offences reported to An Garda Siochana between 01 Jan 2010 and 31 Dec 2014.
The release contains detail on the volume of crime incidents in each group of the Irish Crime Classification System (ICCS). The report contains detail on the number of recorded crime incidents which are recorded as having been detected, those with relevant criminal proceedings and court outcomes, and statistics on the ages and genders of individuals who have been convicted for crimes reported in 2014.
The current release focuses on crime incidents reported only up until the end of 2014 to allow a reasonable period for investigations to reach conclusion as well as for criminal proceedings to be initiated and reach conclusion. All such statistics are provisional and will change as more incidents and court proceedings reach conclusion.
Regular up-to-date statistics on recorded crime offences only is provided in the CSO’s quarterly Recorded Crime release.
Information in this release refers only to crime incidents known to An Garda Síochána and recorded as such. Not all crimes are reported to An Garda Síochána. The CSO provides additional information on estimating non-recorded crime through its Crime and Victimisation surveys.
Technical notes
Recorded Offences
Offences reported or which become known to members of An Garda Síochána are recorded when, on the balance of probability, a Garda determines that a criminal offence defined by law has taken place, and there is no credible evidence to the contrary.
If it is subsequently determined that a criminal offence did not take place, the criminal offence recorded is invalidated and is not counted in the statistics. If a person makes a report and subsequently withdraws it by stating that the criminal act did not take place, then this too is invalidated unless there is evidence to suggest that, by reasonable probability, the offence has taken place.
For criminal offences where victim confirmation is required (e.g. assault, fraud), a criminal offence is recorded only where the victim confirms the offence or where there is evidence to suggest that by reasonable probability it occurred.
Another important feature of a recorded offence is that it is based on the date reported to, or that it became known to, the Gardaí. This has major implications for some offence types. Notable amongst these are sexual offences, as it has often been the case that such offences have been reported to An Garda Síochána many years (sometimes decades) after the event(s). Thus a sexual assault, which occurred in 1960, would be included in the statistics for 2006 if it was first reported in that year.
Detected Offences
Detailed guidelines exist within An Garda Síochána to determine whether a crime incident may be flagged as ‘detected’.
The main criteria for classifying an offence as ‘detected’ is when criminal proceedings have been commenced for at least one person for the offence.
However, there are a number of scenarios where an offence will be considered detected even though criminal proceedings may not be initiated. For these reasons, the number of detected offences exceeds the number of offences with relevant convictions for some offence groups.
For example:
- Approval may have been granted for a child to be dealt by An Garda Síochána under the Juvenile Diversion Programme, as provided for in the Children’s Act 2001, rather than face formal court proceedings.
- An offender may have died before proceedings could be initiated.
- An essential witness may be permanently unable or unwilling to co-operate with court proceedings.
Relevant Proceedings
The decision to initiate criminal proceedings on the basis of a recorded offence is the most notionally straightforward conclusion to the life-cycle of an offence. However, the relationship between recorded offences and court outcomes is not straightforward. Sometimes the charged offence may never have been recorded as an offence on the PULSE system. It can (and does) happen that, at the time of a decision whether to charge, the evidence is such that a different offence is charged to the one originally recorded. Sometimes the offence charged is more serious than the original recorded offence and sometimes it is less serious. Therefore the relationship between the recorded offence and the subsequent proceeding is affected, and this proceeding may not be relevant to the original offence. The concept of ‘relevant proceedings’ has been introduced to link the specific primary offence to a relevant court outcome. Decisions have been taken by the CSO as to which proceedings are relevant to the original ‘counting’ offence. See http://www.cso.ie/en/surveysandmethodology/crime/ for a sample table of ICCS crime types and relevant proceedings types.
Convictions
There can be a significant passage of time between a crime incident and any subsequent court outcome. The length of this passage of time is highly dependent on the offence type in question. More serious offences can take longer to investigate and prosecute, whereas many minor offences can be dealt with summarily by the courts. Therefore, it is not surprising that, for some ICCS groups in particular, data on court outcomes is subject to revision each year. For this reason, each table with convictions data includes the number of cases which are pending including those with appeals allowed, to give a more complete picture of the progression of 2014 offences through the system. This data should be considered a snapshot of the court proceedings at a point in time (i.e. mid 2016) rather than a final picture of all proceedings brought in relation to crime incidents reported in 2014. When a conviction is returned for a particular offence this typically means that an offender has been convicted of that particular offence and some subsequent order has been made. However, convictions (for the purposes of this report) also include cases where the case against an offender is deemed proven but the judge makes an order without a formal conviction, and cases where the Probation of Offenders Act is applied.
Persons with Relevant Convictions
The fourth table provides a profile by age and sex of persons with relevant convictions. It is important to note that there is not a one-to-one relationship between the number of offences with relevant proceedings and convictions (Table 3), and the number of persons convicted (Table 4). For example, it is possible that two people could be convicted of a homicide offence. Table 3 would show a single homicide offence, recorded and detected, with one relevant proceeding and conviction. However, Table 4 would then provide the age and sex of the two convicted offenders. Consequently the total number of convictions would be slightly different to the total number of persons convicted.
Rates per population
The fifth table contains a breakdown of crime types by Garda administrative area. In addition to containing the absolute numbers of offences recorded and detected, this table presents the rate for each recorded offence type per 100,000 of population, for each region and Division. This is simply achieved by dividing the number of offences recorded by the estimated population for the area, and multiplying by 100,000. This provides a common basis for comparing the prevalence of offences across administrative areas of different population size.
Additional technical notes
Classification of Offences
A criminal offence is classified at the time it is entered on the PULSE system. In the vast majority of cases, this happens very soon after the crime incident becomes known to a member of An Garda Síochána. Following investigation some offences are reclassified from one type of crime to another. A crime incident can also be marked as invalid (but not deleted) if it transpires that a criminal offence did not occur. Conversely, an incident, not initially thought to be criminal in nature, can subsequently be reclassified as a criminal incident on foot of further information.
Court outcomes - Homicide
In general, offences are not reclassified on PULSE on foot of a court outcome. An exception to this rule involves offences classified under Homicide Offences (ICCS 01). It can often be the case that a charge of murder is brought and a verdict of manslaughter is returned. In such a case, the original offence is reclassified to reflect the court outcome (It is for this reason that Murder/Manslaughter offences should be treated together in any trend analysis).
Assaults – resulting in death
An assault is generally recorded as such close to the time of the assault incident. However, if the victim subsequently dies as a consequence, and after the assault has been recorded, this will always result in reclassification to a Homicide Offence on PULSE.
Recording Offences - Counting Rules
Crime counting rules are a complex area and have been the subject of debate over the years. However, from an information/statistical perspective, crime counting rules should be applied in accordance with established criteria.
To fully appreciate the complexity involved, it is useful to consider a criminal event which consists of more than one offence. For instance, a burglary and an assault offence can occur within one event. Furthermore, there could be offences of trespass, criminal damage and arson also occurring as part of the same event. For this event, the homicide would be recorded, as well as some other offences. It would be unreasonable to suppose that all offences should be recorded (especially if there was more than one victim, see below), as some would be considered to be trivial in the context of the homicide. So in this case, for practical purposes and on reasonable grounds, not all offences would be recorded. The question then is what is recorded and how does this give comparable data?
There are a number of key counting rules that are applied to the recording of offences. They are the Primary Offence and the One Offence Counts per Victim rules.
Primary Offence Rule
This is achieved by flagging, within PULSE, one offence which should “count” for that event. This practice promotes consistency. Counting only the primary incident is thus a good way of ensuring that there is consistent treatment of criminal events and consistency is paramount when it comes to comparison of data across geographic boundaries or over time. Without the primary offence rule, there would be no basis to compare these data over any boundaries be they geographic or time-based.
The offence with the severest potential penalty is generally flagged as the primary offence. However, offences against the person take precedence over offences against property when the offences have similar penalties.
One Offence Counts per Victim
A. In general, one offence is counted per victim for any crime incident (i.e. criminal event). So, irrespective of the number of offenders it is the number of victims of an incident that dictate how many offences will be recorded.
For example, a sexual event with one offender and two victims counts as two offences. Conversely, an event with two offenders and one victim counts as one offence (or crime incident) in the recorded crime statistics. In this latter case it is useful to remember that this one crime incident is the one that counts, regardless of how many offenders are prosecuted or subsequently convicted.
There are two exceptions to the one offence counts per victim rule.
A first exception to the rule is a series of incidents involving credit/debit card/cheque card fraud. The critical issue in determining the number of offences recorded is who bears the financial loss of the incidents. If the financial loss is ultimately sustained by an institution (for instance a bank), a single offence is recorded because it is akin to a series of incidents against one victim (see note on repeat incidents below). However, if the financial loss is incurred by a number of individuals then normal rules apply and one offence does count per victim.
The second exception is that of burglary, where there may be more than one victim (in the normal sense of the word). This occurs when, for instance, items belonging to more than one person are taken. Counting one offence per individual (person) victim would affect comparability. This is because the number of burglaries recorded would become a function of the number of people living in burgled households. This is an interesting quantity from a victimisation perspective, but not from a crime counting perspective. Therefore, the one offence per victim rule is not applied in the case of burglary, and a single offence is generally recorded. It is useful to think of the burglary as being a crime against a household for statistical reasons.
B. An extension of the One Offence Counts per Victim rule applies for repeat incidents involving the same victim and the same offender.
Again, it is useful to look at sexual offences to illustrate this point. It may be the case that there are numerous crime incidents perpetrated by the same offender against the same victim stretching back for many years (and often reported many years after the last incident). It would be unreasonable to expect the same level of detail to be recorded about every individual offence that occurred throughout the series. Moreover, some victims may not, for a variety of reasons, be in a position to remember all of the incidents involved in the series. Therefore, applying the rule of one incident counts per victim for a series like this promotes consistency in approach for comparative purposes. That is not to say that more information cannot be provided on the numbers of such incidents. It can. It is simply a case of interpretation being subject to some extra caveats for this type of incident series, it is open to debate whether the clustered nature of the offences (in time and/or place) renders them outside the scope of normal statistical comparison).
Data from the Fixed Charge Penalty System (FCPS) is a large component of Dangerous or Negligent Operation of a Vehicle (ICCS 041) and Road and Traffic Offences (ICCS 14). There are no counting rules applied to these offences.
Issues around ‘Detection’ Status
Detailed guidelines exist within An Garda Síochána regarding whether a crime incident may be flagged as “detected”. Within the PULSE system, however, the flagging of an incident is largely independent of any other data in the system there is no action that is automatically triggered because of the entry made for detection status. It is therefore possible that an offence, which has in fact been detected, may, through omission, not be flagged as detected within the system.
However, the situation is less clear with regard to incidents which consist of more than one criminal offence and are recorded as such. This can also be the case when different events are grouped together on the system as an “investigation case”. In these situations, it is not always clear from the raw data which offences are to be considered as detected and which are not. Therefore, this complication arises because of the sophistication of PULSE as used as an operational policing tool which is its main purpose.
As stated above, information on offences detected is presented on an “as-was” basis according to their status as at mid-2016. However, the information is subject to an additional caveat it may not always be the case that it is the primary offence within an incident (the one that “counts”) that has in fact been detected. This feature of the data is known to An Garda Síochana and is receiving attention.
It may be intuitive to think of an offence occurring and being subsequently reported to the Gardaí in turn this leads to the recording of the offence which triggers an investigation. The offence will, at any future point, be regarded as either detected or not detected. However, the recording sequence for some incident types does not follow this path. For these incident types, the recording of an offence actually follows the “detection” of the offence. This is true for, inter alia, some drug offences and for offences of speeding and drink-driving. The recording of these offence types is generally a function of police activities and prioritisation of those activities.
 Hide Background Notes
Scan the QR code below to view this release online or go to
http://www.cso.ie/en/releasesandpublications/er/grcs/gardarecordedcrimestatistics2010-2014/
 Show Table 1 Detection rates by ICCS Group, 2010-2014
 Hide Table 1 Detection rates by ICCS Group, 2010-2014