
| General Government Debt, Deficit and Net Worth | ||||||
| GG Gross Debt | GG Deficit | GG Net Worth | ||||
| End of year | €m | % GDP | €m | % GDP | €m | % GDP |
| 2011 | 169,226 | 104.1 | -21,358 | -13.1 | -46,912 | -28.9 |
| 2012 | 192,458 | 117.4 | -13,511 | -8.2 | -77,352 | -47.2 |
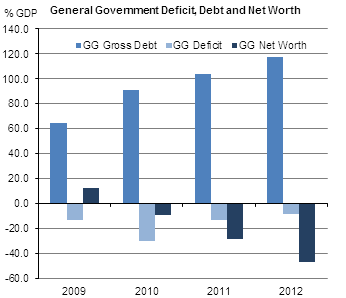
Government deficit of 8.2% of GDP in 2012
General Government experienced a deficit of €13,511 million (8.2% of GDP) in 2012 - an improvement on the 2011 deficit of €21,358 million (13.1% of GDP). Government revenue increased from €55,331 million in 2011 to €56,524 million in 2012 while there was a decline in expenditure from €76,557 million to €69,812 million over the same period (Table 1).
Taxes and social contributions formed by far the largest component of Government revenue over the period, representing just under 87% of total Government revenue in 2012. Social benefits accounted for just over 40% of Government spending in each year.
The 2012 deficit has been substantially revised since first estimates were published in April of this year mainly due to a change arising from the sale of mobile telephone licences by the State (see Changes since April results below).
| GG Gross Debt | GG Net Debt | |
| 2009 | 64.420180593213 | 38.6211826181262 |
| 2010 | 91.1872272082173 | 70.4592750020557 |
| 2011 | 104.07486906306 | 85.0405904059041 |
| 2012 | 117.397005018918 | 92.7051690273152 |
General Government Gross Debt at 117.4% of GDP in 2012
The gross debt of General Government stood at €192,458 million at the end of 2012 - up from €169,226 million at the end of 2011. The corresponding percentages of GDP were 117.4 % and 104.1%, respectively.
General Government Net Debt for 2012 amounted to €151,979 million or 92.7% of GDP. This net debt figure is obtained by deducting the value of the financial assets corresponding to those categories of financial liabilities which comprise General Government Debt from the gross debt figure (Table 2).
Government Net Worth of -47.2% of GDP in 2012
When financial assets of €73,696 million and non-financial assets of €57,865 million are taken into account, the General Government Net Worth amounted to -€77,352 million (-47.2% of GDP) at the end of 2012 (Table 2). The corresponding end 2011 net worth was -€46,912 million (-28.9% of GDP).
|
This detailed release along with the headline figures published on 14 October 2013 together comprise the second official publication by CSO of annual Government Finance Statistics results for years 2009 to 2012, following the first release in April 2013. |
Changes since April results
Treatment of sale of mobile phone licences.
For the April estimates Government revenue from the sales of mobile phone licences was recorded as having being received in 2012, reflecting the fact that the contract was entered into in 2012. CSO subsequently obtained clarification from Eurostat, that as the date of the legal allocation of the licences (as opposed to the contract date) was in the first quarter of 2013, the correct statistical treatment is to record this revenue in 2013. The effect of this change of treatment is a worsening of the 2012 deficit in the amount of €723 million. This forms the main component of the change in the reported deficit from €12,461 million in April to €13,511 million in October.
Updated data sources/processing
In many cases the April EDP estimates are based on preliminary outturn figures. Final audited accounts are available for a much greater proportion of Government bodies by the time of the October notification. Data from these accounts (where available) are used for the production of the current estimates.
In addition more detailed data sources have become available to us, in particular in relation to Local Authorities and Institutes of Technology, since the April EDP notification. On-going improvements to data processing systems are also reflected in these results, in particular in relation to taxes data and the use of Appropriation Accounts balance sheet data for Government Departments and Offices.
Change in Net Worth
Change in the reported net worth of General Government since April is mainly explained by the higher reported deficit, offset by a somewhat larger increase in the value of fixed assets and equity held by Government.
Revisions to GDP
The GDP figures used in the current publication are consistent with those published in the National Income and Expenditure 2012. This has some effect on the calculation of the percentages shown in this release when compared to the April version.
| Table 1 General Government transactions: revenue, expenditure, financing and deficit | ||||||||
| €million | ||||||||
| Description | ESA code | 2009 | 2010 | 2011 | 2012 | |||
| General Government transactions | ||||||||
| Revenue | TR | 55,963 | 55,149 | 55,331 | 56,524 | |||
| Taxes and social contributions | 47,853 | 46,314 | 47,763 | 49,104 | ||||
| Taxes | D2 + D5 + D91 | 35,854 | 34,831 | 37,624 | 39,453 | |||
| Social contributions | D61 | 11,999 | 11,484 | 10,139 | 9,651 | |||
| Sales of goods and services | P1O | 4,543 | 5,241 | 5,086 | 4,868 | |||
| Investment income | D4 | 1,982 | 2,110 | 1,997 | 2,249 | |||
| Current transfer revenue (excluding taxes) | D7 | 151 | 161 | 100 | 100 | |||
| Capital transfer revenue (excluding taxes) | D9N | 1,434 | 1,323 | 386 | 203 | |||
| Expenditure | TE | 78,128 | 103,547 | 76,557 | 69,812 | |||
| Expense | 74,712 | 100,885 | 75,175 | 69,095 | ||||
| Compensation of employees | D1 | 20,705 | 19,284 | 19,113 | 18,784 | |||
| Use of goods and services plus taxes payable | P2 + D5 + D29 | 10,223 | 9,252 | 8,771 | 8,429 | |||
| Depreciation (Consumption of fixed capital) | K1 | 2,658 | 2,647 | 2,623 | 2,423 | |||
| Interest (excluding FISIM) | D41 | 3,290 | 4,984 | 5,190 | 5,912 | |||
| Subsidies | D3 | 1,690 | 1,577 | 1,349 | 1,540 | |||
| Social benefits | D62 + D631 | 28,471 | 28,410 | 28,952 | 28,960 | |||
| Other current transfers | D7 | 2,091 | 1,874 | 1,784 | 1,798 | |||
| Capital transfers | D9 | 5,585 | 32,857 | 7,392 | 1,249 | |||
| Net operating balance | -18,748 | -45,736 | -19,844 | -12,571 | ||||
| Net acquisition of non-financial assets | P5 + NP - K1 | 3,417 | 2,662 | 1,382 | 717 | |||
| Net lending (+) / net borrowing (-) | B9 | -22,165 | -48,398 | -21,226 | -13,288 | |||
| equals | ||||||||
| Net acquisition of financial assets | 2,915 | -7,753 | 3,528 | 10,174 | ||||
| Debt instruments | F2 + F33 + F4 | 5,154 | -8,926 | -393 | 8,774 | |||
| Shares and other equity | F5 | -2,357 | 1,430 | 3,583 | 1,815 | |||
| Other financial assets | F34 + F61 + F62 + F7 | 118 | -257 | 338 | -415 | |||
| less | ||||||||
| Net incurrence of liabilities | 25,080 | 40,645 | 24,754 | 23,462 | ||||
| Debt instruments | F2 + F33 + F4 | 25,879 | 40,897 | 24,683 | 22,859 | |||
| Other liabilities | F34 + F5 + F61 + F62 + F7 | -799 | -252 | 71 | 603 | |||
| General Government Deficit | ||||||||
| Net lending / net borrowing | -22,165 | -48,398 | -21,226 | -13,288 | ||||
| Adjustment for swaps | -7 | 10 | -132 | -223 | ||||
| General Government Surplus/Deficit | -22,172 | -48,388 | -21,358 | -13,511 | ||||
| General Government Surplus/Deficit (% of GDP) | -13.7 | -30.6 | -13.1 | -8.2 | ||||
| Table 2 General Government Net Worth, Gross and Net Debt | ||||||||||
| €million | ||||||||||
| Description | ESA code | 2009 | 2010 | 2011 | 2012 | |||||
| General Government net worth | ||||||||||
| Net worth at market value, excluding pension liabilities | NW | 20,070 | -14,217 | -46,912 | -77,352 | |||||
| equals | ||||||||||
| Non-financial assets at market value | NFA | 61,020 | 58,425 | 57,148 | 57,865 | |||||
| plus | ||||||||||
| Financial net worth at market value, excluding pension liabilities | FNW | -40,950 | -72,642 | -104,060 | -135,217 | |||||
| equals | ||||||||||
| Financial assets at market value | FA | 72,489 | 65,182 | 63,009 | 73,696 | |||||
| EDP debt instruments | AF2 + AF33 + AF4 | 41,868 | 32,770 | 30,950 | 40,479 | |||||
| Shares and other equity | AF5 | 21,794 | 23,916 | 22,870 | 24,524 | |||||
| Other financial assets | AF34 + AF61 + AF62 + AF7 | 8,827 | 8,496 | 9,189 | 8,693 | |||||
| less | ||||||||||
| Liabilities at market value | 113,439 | 137,824 | 167,069 | 208,913 | ||||||
| EDP debt instruments | AF2 + AF33 + AF4 | 108,031 | 132,647 | 161,048 | 201,529 | |||||
| Other liabilities | AF34 + AF61 + AF62 + AF7 | 5,408 | 5,177 | 6,021 | 7,384 | |||||
| Memo: Estimated pension liabilities of government | 116,000 | 116,000 | 116,000 | 116,000 | ||||||
| Memo: Net worth, including pension liabilities | -95,930 | -130,217 | -162,912 | -193,352 | ||||||
| Contingent liabilities | 287,666 | 163,376 | 153,258 | 125,327 | ||||||
| Memo: Net worth, including pension liabilities and contingent liabilities | -383,596 | -293,593 | -316,170 | -318,679 | ||||||
| General Government: changes in net worth | ||||||||||
| Opening net worth | 46,979 | 20,070 | -14,217 | -46,912 | ||||||
| Change in net worth due to transactions | -18,748 | -45,736 | -19,844 | -12,571 | ||||||
| Net acquisition of non-financial assets | P5 + NP - K1 | 3,417 | 2,662 | 1,382 | 717 | |||||
| Net lending/net borrowing | B9 | -22,165 | -48,398 | -21,226 | -13,288 | |||||
| Change in net worth due to other economic flows | Kx | -8,161 | 11,449 | -12,852 | -17,869 | |||||
| Other changes in non-financial assets | -11,694 | -5,257 | -2,660 | 0 | ||||||
| Other changes in financial assets | 3,079 | 446 | -5,701 | 513 | ||||||
| Other changes in liabilities | 454 | 16,260 | -4,491 | -18,382 | ||||||
| Closing net worth | 20,070 | -14,217 | -46,912 | -77,352 | ||||||
| General Government Debt (GGDebt) | ||||||||||
| Debt instrument liabilities at market value | 108,031 | 132,647 | 161,048 | 201,529 | ||||||
| + Difference between EDP face value and market value | -3,487 | 11,517 | 8,178 | -9,071 | ||||||
| Gross General Government Debt (EDP face value) | 104,544 | 144,164 | 169,226 | 192,458 | ||||||
| less EDP debt instrument assets | -41,868 | -32,770 | -30,950 | -40,479 | ||||||
| Net General Government Debt | 62,676 | 111,394 | 138,276 | 151,979 | ||||||
| Closing Net Worth (% of GDP) | 12.4 | -9.0 | -28.9 | -47.2 | ||||||
| Gross General Government Debt (% of GDP) | 64.4 | 91.2 | 104.1 | 117.4 | ||||||
| Net General Government Debt (% of GDP) | 38.6 | 70.5 | 85.0 | 92.7 | ||||||
| Table 3 General Government: detailed classification of revenue and output | |||||||||
| €million | |||||||||
| Description | ESA code | 2009 | 2010 | 2011 | 2012 | ||||
| Total Revenue | TR | 55,963 | 55,149 | 55,331 | 56,524 | ||||
| Taxes and social contributions | 47,853 | 46,314 | 47,763 | 49,104 | |||||
| Taxes | D2 + D5 + D91 | 35,854 | 34,831 | 37,624 | 39,453 | ||||
| Indirect taxes (taxes on production and imports) | D2 | 18,196 | 17,999 | 17,606 | 17,997 | ||||
| Taxes on products | D21 | 16,143 | 15,686 | 15,246 | 15,609 | ||||
| of which Value-Added Tax | D211 | 10,161 | 9,873 | 9,562 | 10,028 | ||||
| Other taxes on production | D29 | 2,053 | 2,314 | 2,360 | 2,389 | ||||
| Direct taxes | D5 | 17,400 | 16,596 | 19,316 | 20,691 | ||||
| Taxes on income, profits and capital gains | D51 | 16,622 | 15,841 | 18,580 | 19,930 | ||||
| Other current direct taxes | D59 | 778 | 755 | 736 | 761 | ||||
| Capital taxes | D91 | 258 | 235 | 702 | 765 | ||||
| Social contributions | D61 | 11,999 | 11,484 | 10,139 | 9,651 | ||||
| Actual social contributions | D611 | 9,330 | 9,082 | 7,819 | 7,186 | ||||
| Imputed social contributions | D612 | 2,669 | 2,402 | 2,320 | 2,466 | ||||
| Sales of goods and services | P1O | 4,543 | 5,241 | 5,086 | 4,868 | ||||
| Sales of market establishments (= market output) | P11 | 907 | 877 | 905 | 949 | ||||
| Imputed sales related to production of own-use capital assets (= output for own final use) | P12 | 64 | 58 | 58 | 58 | ||||
| Incidental sales and fees of non-market establishments | P131 | 3,572 | 4,306 | 4,123 | 3,862 | ||||
| Investment income | D4 | 1,982 | 2,110 | 1,997 | 2,249 | ||||
| Interest (excluding FISIM) | D41 | 978 | 850 | 917 | 819 | ||||
| Dividends | D42 | 1,004 | 1,260 | 1,081 | 1,430 | ||||
| Current transfer revenue | D39 + D7 | 151 | 161 | 100 | 100 | ||||
| Subsidies | D39 | 0 | 0 | 0 | 0 | ||||
| Other current transfers | D7 | 151 | 161 | 100 | 100 | ||||
| Non-life insurance claims | D72 | 14 | 14 | 13 | 13 | ||||
| Other | D7N | 137 | 147 | 87 | 87 | ||||
| Capital transfer revenue | D9N | 1,434 | 1,323 | 386 | 203 | ||||
| Output | P1 | 33,848 | 31,437 | 30,787 | 29,964 | ||||
| Market output (sales of market establishments) | P11 | 907 | 877 | 905 | 949 | ||||
| Output for own final use | P12 | 64 | 58 | 58 | 58 | ||||
| Non-market output | P13 | 32,877 | 30,502 | 29,824 | 28,957 | ||||
| = Non-market compensation of employees | D1_nonmarket | 20,641 | 19,226 | 19,055 | 18,726 | ||||
| = Total compensation of employees | D1 | 20,705 | 19,284 | 19,113 | 18,784 | ||||
| - Compensation of employees of market establishments | D1_market | 0 | 0 | 0 | 0 | ||||
| - Compensation related to production of own-use capital assets | D1_own-use | -64 | -58 | -58 | -58 | ||||
| + Non-market intermediate consumption | P2_nonmarket | 9,998 | 9,028 | 8,543 | 8,202 | ||||
| = Total intermediate consumption | P2 | 10,223 | 9,251 | 8,770 | 8,428 | ||||
| - Intermediate consumption of market establishments | P2_market | -225 | -224 | -227 | -227 | ||||
| - Intermediate consumption related to production of own-use capital assets | P2_own-use | 0 | 0 | 0 | 0 | ||||
| + Non-market consumption of fixed capital | K1_nonmarket | 2,238 | 2,248 | 2,225 | 2,029 | ||||
| = Total consumption of fixed capital | K1 | 2,658 | 2,647 | 2,623 | 2,423 | ||||
| - Consumption of fixed capital by market establishments | K1_market | -420 | -399 | -397 | -394 | ||||
| - Consumption of fixed capital related to production of own-use capital assets | K1_own-use | 0 | 0 | 0 | 0 | ||||
| + Other taxes on production, payable | D29_pay | 0 | 0 | 0 | 0 | ||||
| - Other subsidies on production, receivable (D.39 R) | D39_rec | 0 | 0 | 0 | 0 | ||||
| Table 4 General Government: detailed classification of expenditure and consumption | |||||||||
| €million | |||||||||
| Description | ESA code | 2009 | 2010 | 2011 | 2012 | ||||
| Total Expenditure | TE | 78,128 | 103,547 | 76,557 | 69,812 | ||||
| Expense | 74,712 | 100,885 | 75,175 | 69,095 | |||||
| Compensation of employees | D1 | 20,705 | 19,284 | 19,113 | 18,784 | ||||
| Of which: Related to production of own-use capital assets | 64 | 58 | 58 | 58 | |||||
| Use of goods and services plus taxes payable | P2 + D5 + D29 | 10,223 | 9,252 | 8,771 | 8,429 | ||||
| Use of goods and services [Intermediate consumption] | P2 | 10,223 | 9,251 | 8,770 | 8,428 | ||||
| Of which: Intermediate consumption of market establishments | 225 | 224 | 227 | 227 | |||||
| Taxes, payable | D5 | 0 | 1 | 1 | 1 | ||||
| Depreciation (Consumption of fixed capital) | K1 | 2,658 | 2,647 | 2,623 | 2,423 | ||||
| Of which: Depreciation by market establishments | 420 | 399 | 397 | 394 | |||||
| Interest (excluding FISIM) | D41 | 3,290 | 4,984 | 5,190 | 5,912 | ||||
| Subsidies | D3 | 1,690 | 1,577 | 1,349 | 1,540 | ||||
| Product subsidies | D31 | 920 | 801 | 793 | 920 | ||||
| Other subsidies on production | D39 | 770 | 776 | 556 | 620 | ||||
| Social benefits | D62 + D631 | 28,471 | 28,410 | 28,952 | 28,960 | ||||
| Social benefits in cash | D62 | 24,505 | 24,201 | 24,760 | 24,623 | ||||
| Social benefits in kind (via market producers) | D631 | 3,966 | 4,209 | 4,193 | 4,336 | ||||
| Other current transfers | D7 | 2,091 | 1,874 | 1,784 | 1,798 | ||||
| Net non-life insurance premiums | D71 | 62 | 73 | 73 | 91 | ||||
| Current international cooperation | D74 | 557 | 529 | 529 | 523 | ||||
| Miscellaneous current transfers | D75 | 1,472 | 1,272 | 1,183 | 1,185 | ||||
| GNI-based EU own resources | D75_GNI | 1,147 | 973 | 956 | 999 | ||||
| Other miscellaneous current transfers | D75_other | 325 | 299 | 226 | 186 | ||||
| Capital transfers | D9 | 5,585 | 32,857 | 7,392 | 1,249 | ||||
| Investment grants | D92 | 1,093 | 1,203 | 426 | 614 | ||||
| Other capital transfers | D99 | 4,492 | 31,654 | 6,966 | 635 | ||||
| Net acquisition of non-financial assets | P5 + NP - K1 | 3,417 | 2,662 | 1,382 | 717 | ||||
| = Gross investment in non-financial assets | P5 + NP | 6,074 | 5,310 | 4,005 | 3,140 | ||||
| Gross fixed capital formation | P51 | 6,075 | 5,390 | 3,894 | 3,057 | ||||
| Net acquisition of stocks | P52 | -1 | -80 | 111 | 83 | ||||
| Net acquisition of unproduced assets | K2 | 0 | 0 | 0 | 0 | ||||
| - Consumption of fixed capital | K1 | -2,658 | -2,647 | -2,623 | -2,423 | ||||
| Net expenditure on current goods and services | P3 - D632 | 29,304 | 26,196 | 25,701 | 25,096 | ||||
| = Output | P1 | 33,848 | 31,437 | 30,787 | 29,964 | ||||
| - Sales of goods and services | P11+P12+P131 | -4,543 | -5,241 | -5,086 | -4,868 | ||||
| Market output (sales of market establishments) | P11 | -907 | -877 | -905 | -949 | ||||
| Output for own final use | P12 | -64 | -58 | -58 | -58 | ||||
| Incidental sales and fees of non-market establishments | P131 | -3,572 | -4,306 | -4,123 | -3,862 | ||||
| Final consumption expenditure | P3 | 33,270 | 30,405 | 29,894 | 29,432 | ||||
| = Net expenditure on current goods and services | P3 - D631 | 29,304 | 26,196 | 25,701 | 25,096 | ||||
| + Social transfers in kind via market producers | D631 | 3,966 | 4,209 | 4,193 | 4,336 | ||||
| made up of | |||||||||
| Individual consumption (= social transfers in kind) | P31 (= D63) | 22,429 | 21,319 | 21,022 | 20,875 | ||||
| Social transfers in kind (via market producers) | D631 | 3,966 | 4,209 | 4,193 | 4,336 | ||||
| Social transfers in kind (provided directly by government) | D632 | 18,463 | 17,110 | 16,829 | 16,538 | ||||
| Collective consumption (= actual final consumption of government) | P32 | 10,841 | 9,086 | 8,872 | 8,558 | ||||
| Total social transfers | D62 + D63 | 46,934 | 45,520 | 45,781 | 45,498 | ||||
| Social benefits in cash | D62 | 24,505 | 24,201 | 24,760 | 24,623 | ||||
| Social transfers in kind (= individual consumption) | D63 | 22,429 | 21,319 | 21,022 | 20,875 | ||||
| Table 5 General Government financial transactions | ||||||||||
| €million | ||||||||||
| 2009 | 2010 | 2011 | 2012 | |||||||
| Description | ESA code | |||||||||
| Net lending (+) / net borrowing (-) | B.9 | -22,165 | -48,398 | -21,226 | -13,288 | |||||
| equals | ||||||||||
| Net acquisition of financial assets | ΔA | 2,915 | -7,753 | 3,528 | 10,174 | |||||
| EDP debt instruments | F2 + F33 + F4 | 5,154 | -8,926 | -393 | 8,774 | |||||
| Currency and deposits | F2 | 909 | -11,221 | -400 | 5,735 | |||||
| Securities other than shares, excluding financial derivatives | F33 | 4,123 | 1,857 | -1,336 | 1,169 | |||||
| Short-term | F331 | 43 | -37 | -36 | 1,085 | |||||
| Long-term | F332 | 4,080 | 1,894 | -1,300 | 84 | |||||
| Loans | F4 | 122 | 438 | 1,343 | 1,870 | |||||
| Short-term loans | F41 | 0 | 0 | 885 | 1,408 | |||||
| Long-term loans | F42 | 122 | 438 | 458 | 462 | |||||
| Shares and other equity | F5 | -2,357 | 1,430 | 3,583 | 1,815 | |||||
| Other financial assets | F34 + F61 + F62 + F7 | 118 | -257 | 338 | -415 | |||||
| Financial derivatives | F34 | 16 | 254 | -271 | 0 | |||||
| Insurance: reserves and premium prepayments | F61 + F62 | 1 | 0 | 0 | -1 | |||||
| Net equity of households in life insurance reserves and in pension funds reserves | F61 | 0 | 0 | 0 | 0 | |||||
| Prepay. of ins. premiums and reserves for outstanding claims | F62 | 1 | 0 | 0 | -1 | |||||
| Other accounts receivable/payable | F7 | 101 | -511 | 609 | -414 | |||||
| less | ||||||||||
| Net incurrence of liabilities | ΔL | 25,080 | 40,645 | 24,754 | 23,462 | |||||
| EDP debt instruments | F2 + F33 + F4 | 25,879 | 40,897 | 24,683 | 22,859 | |||||
| Currency and deposits | F2 | 1,464 | 3,402 | 1,507 | 2,253 | |||||
| Securities other than shares, excluding financial derivatives | F33 | 24,441 | 6,106 | -9,049 | 396 | |||||
| Short-term | F331 | -4,887 | -13,109 | -3,383 | -1,235 | |||||
| Long-term | F332 | 29,328 | 19,215 | -5,666 | 1,631 | |||||
| Loans | F4 | -26 | 31,389 | 32,225 | 20,210 | |||||
| Short-term loans | F41 | 237 | 58 | -164 | 1,289 | |||||
| Long-term loans | F42 | -263 | 31,331 | 32,389 | 18,921 | |||||
| Other liabilities | F34 + F5 + F61 + F62 + F7 | -799 | -252 | 71 | 603 | |||||
| Financial derivatives | F34 | 0 | 0 | 3 | 0 | |||||
| Shares and other equity | F5 | 0 | 0 | 0 | 0 | |||||
| Insurance: reserves and premium prepayments | F61 + F62 | 0 | 0 | 0 | 1 | |||||
| Net equity of households in life insurance reserves and in pension funds reserves | F61 | 0 | 0 | 0 | 1 | |||||
| Prepay. of ins. premiums and reserves for outstanding claims | F62 | 0 | 0 | 0 | 0 | |||||
| Other accounts receivable/payable | F7 | -799 | -252 | 68 | 602 | |||||
| Table 6 General Government: detailed breakdown of net worth | |||||||||||
| €million | |||||||||||
| Description | ESA code | 2009 | 2010 | 2011 | 2012 | ||||||
| General Government balance sheet | |||||||||||
| Net worth at market value, excluding pension liabilities | 20,070 | -14,217 | -46,912 | -77,352 | |||||||
| equals | |||||||||||
| Non-financial assets at market value | 61,020 | 58,425 | 57,148 | 57,865 | |||||||
| plus | |||||||||||
| Financial net worth at market value, excluding pension liabilities | -40,950 | -72,642 | -104,060 | -135,217 | |||||||
| equals | |||||||||||
| Financial assets at market value | 72,489 | 65,182 | 63,009 | 73,696 | |||||||
| EDP debt instruments | F2 + F33 + F4 | 41,868 | 32,770 | 30,950 | 40,479 | ||||||
| Currency and deposits | F2 | 29,870 | 18,907 | 18,525 | 24,421 | ||||||
| Securities other than shares, excluding financial derivatives | F33 | 8,700 | 10,114 | 7,334 | 9,097 | ||||||
| Short-term | F331 | 85 | 49 | 13 | 1,046 | ||||||
| Long-term | F332 | 8,615 | 10,065 | 7,321 | 8,051 | ||||||
| Loans | F4 | 3,298 | 3,749 | 5,091 | 6,961 | ||||||
| Short-term loans | F41 | 0 | 0 | 885 | 2,293 | ||||||
| Long-term loans | F42 | 3,298 | 3,749 | 4,206 | 4,668 | ||||||
| Shares and other equity | F5 | 21,794 | 23,916 | 22,870 | 24,524 | ||||||
| Other financial assets | F34 + F61 + F62 + F7 | 8,827 | 8,496 | 9,189 | 8,693 | ||||||
| Financial derivatives | F34 | 410 | 606 | 704 | 642 | ||||||
| Insurance: reserves and premium prepayments | F61 + F62 | 1 | 1 | 1 | 0 | ||||||
| Net equity of households in life insurance reserves and in pension funds reserves | F61 | 0 | 0 | 0 | 0 | ||||||
| Prepayment of insurance premiums and reserves for outstanding claims | F62 | 1 | 1 | 1 | 0 | ||||||
| Other accounts receivable/payable | F7 | 8,416 | 7,889 | 8,484 | 8,051 | ||||||
| less | |||||||||||
| Liabilities at market value | 113,439 | 137,824 | 167,069 | 208,913 | |||||||
| EDP debt instruments | F2 + F33 + F4 | 108,031 | 132,647 | 161,048 | 201,529 | ||||||
| Currency and deposits | F2 | 10,308 | 13,711 | 15,218 | 17,472 | ||||||
| Securities other than shares, excluding financial derivatives | F33 | 94,660 | 84,048 | 79,675 | 96,557 | ||||||
| Short-term | F331 | 20,456 | 7,231 | 3,796 | 2,572 | ||||||
| Long-term | F332 | 74,204 | 76,817 | 75,879 | 93,985 | ||||||
| Loans | F4 | 3,063 | 34,888 | 66,155 | 87,500 | ||||||
| Short-term loans | F41 | 709 | 735 | 574 | 1,891 | ||||||
| Long-term loans | F42 | 2,354 | 34,153 | 65,581 | 85,609 | ||||||
| Other liabilities | F34 + F61 + F62 + F7 | 5,408 | 5,177 | 6,021 | 7,384 | ||||||
| Financial derivatives | F34 | 16 | 38 | 813 | 1,572 | ||||||
| Shares and other equity | F5 | 0 | 0 | 0 | 0 | ||||||
| Insurance: reserves and premium prepayments | F61 + F62 | 0 | 0 | 0 | 1 | ||||||
| Net equity of households in life insurance reserves and in pension funds reserves | F61 | 0 | 0 | 0 | 1 | ||||||
| Prepay. of ins. premiums and reserves for outstanding claims | F62 | 0 | 0 | 0 | 0 | ||||||
| Other accounts receivable/payable | F7 | 5,392 | 5,139 | 5,208 | 5,811 | ||||||
| Memo: Estimated pension liabilities of government | 116,000 | 116,000 | 116,000 | 116,000 | |||||||
| Memo: Net worth, including pension liabilities | -95,930 | -130,217 | -162,912 | -193,352 | |||||||
| Contingent liabilities | 287,666 | 163,376 | 153,258 | 125,327 | |||||||
| Guarantees | 282,617 | 158,327 | 148,209 | 120,278 | |||||||
| Off-balance sheet PPPs | 5,049 | 5,049 | 5,049 | 5,049 | |||||||
| Memo: Net worth, including pension liabilities and contingent liabilities | -383,596 | -293,593 | -316,170 | -318,679 | |||||||
| Change in net worth of government | |||||||||||
| Opening net worth | 46,979 | 20,070 | -14,217 | -46,912 | |||||||
| Change in net worth due to transactions | -18,748 | -45,736 | -19,844 | -12,571 | |||||||
| Net acquisition of non-financial assets | 3,417 | 2,662 | 1,382 | 717 | |||||||
| Net lending/net borrowing | -22,165 | -48,398 | -21,226 | -13,288 | |||||||
| = Net acquisition of financial assets | 2,915 | -7,753 | 3,528 | 10,174 | |||||||
| - Net incurrence of liabilities | -25,080 | -40,645 | -24,754 | -23,462 | |||||||
| Change in net worth due to other economic flows | -8,161 | 11,449 | -12,852 | -17,869 | |||||||
| Other changes in non-financial assets | -11,694 | -5,257 | -2,660 | 0 | |||||||
| Other changes in financial net worth | 3,533 | 16,706 | -10,192 | -17,869 | |||||||
| = Other changes in financial assets | 3,079 | 446 | -5,701 | 513 | |||||||
| EDP debt instruments | -65 | -172 | -1,427 | 755 | |||||||
| Shares and other equity | 3,102 | 692 | -4,629 | -161 | |||||||
| Other financial assets | 42 | -74 | 355 | -81 | |||||||
| - Other changes in liabilities | 454 | 16,260 | -4,491 | -18,382 | |||||||
| EDP debt instruments | 327 | 16,281 | -3,718 | -17,622 | |||||||
| Other liabilities | 127 | -21 | -773 | -760 | |||||||
| Closing net worth | 20,070 | -14,217 | -46,912 | -77,352 | |||||||
| Table 7 General Government Gross and Net Debt | ||||||||
| €million | ||||||||
| Description | ESA code | 2009 | 2010 | 2011 | 2012 | |||
| General Government Debt | ||||||||
| Debt instrument liabilities at market value | 108,031 | 132,647 | 161,048 | 201,529 | ||||
| + Difference between face value and market value | -3,487 | 11,517 | 8,178 | -9,071 | ||||
| Gross General Government Debt (face value) | 104,544 | 144,164 | 169,226 | 192,458 | ||||
| By category: | ||||||||
| Currency and deposits | F2 | 10,307 | 13,707 | 15,216 | 17,465 | |||
| Securities other than shares, exc. financial derivatives | F33 | 91,391 | 96,317 | 88,550 | 89,289 | |||
| Short-term | F331 | 20,443 | 7,203 | 3,777 | 2,535 | |||
| Long-term | F332 | 70,948 | 89,114 | 84,773 | 86,754 | |||
| Loans | F4 | 2,845 | 34,140 | 65,459 | 85,704 | |||
| Short-term | F41 | 707 | 735 | 574 | 1,891 | |||
| Long-term | F42 | 2,138 | 33,405 | 64,886 | 83,813 | |||
| less EDP debt instrument assets | 41,868 | 32,770 | 30,950 | 40,479 | ||||
| By category: | ||||||||
| Currency and deposits | F2 | 29,870 | 18,907 | 18,525 | 24,421 | |||
| Securities other than shares, exc. financial derivatives | F33 | 8,700 | 10,114 | 7,334 | 9,097 | |||
| Short-term | F331 | 85 | 49 | 13 | 1,046 | |||
| Long-term | F332 | 8,615 | 10,065 | 7,321 | 8,051 | |||
| Loans | F4 | 3,298 | 3,749 | 5,091 | 6,961 | |||
| Short-term | F41 | 0 | 0 | 885 | 2,293 | |||
| Long-term | F42 | 3,298 | 3,749 | 4,206 | 4,668 | |||
| Net General Government Debt (face value) | 62,676 | 111,394 | 138,276 | 151,979 | ||||
| By category: | ||||||||
| Currency and deposits | F2 | -19,563 | -5,200 | -3,309 | -6,956 | |||
| Securities other than shares, exc. financial derivatives | F33 | 82,691 | 86,203 | 81,216 | 80,192 | |||
| Short-term | F331 | 20,358 | 7,154 | 3,764 | 1,489 | |||
| Long-term | F332 | 62,333 | 79,049 | 77,452 | 78,703 | |||
| Loans | F4 | -453 | 30,391 | 60,368 | 78,743 | |||
| Short-term | F41 | 707 | 735 | -311 | -402 | |||
| Long-term | F42 | -1,160 | 29,656 | 60,680 | 79,145 | |||
| Table 8 Reconciliation of Exchequer Balance to General Government Deficit | ||||
| € million | ||||
| Description | 2009 | 2010 | 2011 | 2012 |
| Exchequer balance | -24,641 | -18,745 | -24,918 | -14,892 |
| Deduct cash inflows which do not increase financial net worth | -3 | -382 | -62 | -9 |
| Inflows from sale or redemption of financial assets | -3 | -382 | -62 | -9 |
| Incurrence of Exchequer liability to Central Bank for notes and coins in circulation | 0 | 0 | 0 | 0 |
| Exclude cash outflows which do not reduce financial net worth | 31 | 650 | 7,327 | 2,309 |
| Acquisition of financial assets | 1 | 642 | 4,810 | 2,282 |
| Repayment of promissory notes notional loan principal | 0 | 0 | 2,517 | 0 |
| Redemption of Exchequer liability to Central Bank for notes and coins in circulation | 30 | 9 | 0 | 27 |
| Impact on financial net worth of Exchequer cash transactions | -24,613 | -18,477 | -17,653 | -12,592 |
| Adjust for impact of non-cash revenue and disposals of non-financial asset (+) | -204 | -180 | 719 | -747 |
| Difference between Exchequer cash tax revenue and time-adjusted Revenue Net Receipts | -331 | -20 | 555 | -232 |
| Receipts due from EU (Agriculture grants, Cohesion Fund, ESF and ERDF) | 129 | -162 | 36 | -65 |
| Accrual of interest due on contingent capital assets assigned to banks | 0 | 0 | 128 | 0 |
| Licence sales | 0 | 0 | 0 | -450 |
| Other accrued revenue | -2 | 1 | 0 | 0 |
| Adjust for impact of non-cash expenditure (-) | 75 | -31,824 | 87 | -609 |
| Capital transfers to financial institutions financed by promissory notes | 0 | -30,850 | 0 | 0 |
| Difference between interest paid and accrued | -229 | -1,326 | -38 | -447 |
| Difference between Exchequer cash issues and accrued net spending of departments and offices | 306 | 318 | 102 | -173 |
| Other accrued expenditure | -2 | 33 | 22 | 11 |
| EDP Net lending (+) / net borrowing (-) of Exchequer | -24,743 | -50,481 | -16,847 | -13,948 |
| Net lending (+) / net borrowing (-) of extra-budgetary bodies, funds and accounts consolidated with Exchequer | 386 | 518 | -74 | 147 |
| Bank Guarantee Scheme receipts - special account | 439 | -259 | -3 | -67 |
| Capital Services Redemption Account | 0 | 600 | -600 | 0 |
| Small Savings Reserve Fund | -243 | 0 | 0 | 0 |
| Other Extra-Budgetary Funds | 19 | 11 | 374 | 296 |
| Health Service Executive | 171 | 167 | 155 | -82 |
| EDP Net lending (+) / net borrowing (-) of Budgetary Central Government | -24,357 | -49,963 | -16,921 | -13,801 |
| Net lending (+) / net borrowing (-) of other Central Government bodies | 4,678 | 2,387 | -4,396 | 367 |
| National Pensions Reserve Fund | 4,433 | 2,116 | -4,373 | 334 |
| Non-market State corporations and agencies | 218 | 269 | -6 | -21 |
| Voluntary and joint board hospitals | 28 | 2 | -17 | 54 |
| EDP Net lending (+) / net borrowing (-) of Central Government (S.1311) | -19,679 | -47,576 | -21,317 | -13,434 |
| EDP Net lending (+) / net borrowing (-) of Social Insurance Fund (S.1311) | -2,483 | -915 | -8 | 13 |
| EDP Net lending (+) / net borrowing (-) of Local Government (S.1313) | -10 | 103 | -32 | -90 |
| EDP Net lending (+) / net borrowing (-) of General Government (S.13) (=GGDeficit) | -22,172 | -48,388 | -21,358 | -13,511 |
| Table 9 Reconciliation of National Debt to General Government Debt | |||||||||
| € million | |||||||||
| Description | 2009 | 2010 | 2011 | 2012 | |||||
| Audited National Debt | 75,152 | 93,445 | 119,082 | 137,632 | |||||
| Composed of | |||||||||
| Gross National Debt | 96,968 | 109,609 | 136,774 | 161,482 | |||||
| Medium/long term debt | 71,528 | 90,775 | 120,612 | 144,524 | |||||
| Irish Government Bonds | 71,075 | 90,704 | 85,912 | 88,455 | |||||
| EU/IMF Programme Funding | 0 | 0 | 34,629 | 52,905 | |||||
| EIB and bilateral loans | 0 | 0 | 0 | 3,071 | |||||
| Miscellaneous | 453 | 71 | 71 | 93 | |||||
| Short term debt | 18,044 | 8,496 | 4,616 | 3,476 | |||||
| Commercial Paper | 16,261 | 6,972 | 2,920 | 1,299 | |||||
| Treasury Bills | 0 | 0 | 0 | 1,014 | |||||
| Borrowings from Funds under the control of the Minister for Finance | 1,783 | 1,524 | 1,696 | 786 | |||||
| Miscellaneous (Exchequer Notes, Central Treasury Notes) | 0 | 0 | 0 | 377 | |||||
| State Savings Schemes | 7,396 | 10,338 | 11,546 | 13,482 | |||||
| less | |||||||||
| Liquid assets | -21,816 | -16,164 | -17,692 | -23,850 | |||||
| Reverse deduction of liquid assets held by Exchequer | 21,816 | 16,164 | 17,692 | 23,850 | |||||
| Add EFSF prepaid margin | 0 | 0 | 530 | 530 | |||||
| Outstanding principal value of promissory notes | 0 | 30,850 | 28,333 | 25,261 | |||||
| Liability for coinage in circulation | 674 | 673 | 694 | 670 | |||||
| Accrual adjustments (Small Savings Reserve Fund) | 346 | 368 | 464 | 548 | |||||
| Adjustment from discounted to nominal value | 55 | 72 | 4 | 6 | |||||
| Gross treatment of collaterals | 0 | 11 | 170 | 1,431 | |||||
| Other adjustments (repurchase agreements and OPW contracts) | 14 | -19 | -16 | 9 | |||||
| Unconsolidated Exchequer Debt (Maastricht definition) | 98,057 | 141,564 | 166,953 | 189,937 | |||||
| of which: Liabilities to other Central Government bodies | 2,394 | 2,440 | 2,615 | 2,305 | |||||
| Exchequer contribution to Central Government debt | 95,663 | 139,124 | 164,338 | 187,632 | |||||
| of which: Liabilities to Local Government (Local Authorities and VECs) | 19 | 32 | 19 | 30 | |||||
| Exchequer contribution to General Government debt | 95,644 | 139,092 | 164,319 | 187,602 | |||||
| Housing Finance Agency (HFA) | |||||||||
| Gross debt of HFA | 4,941 | 4,512 | 4,414 | 4,501 | |||||
| of which: Liabilities to other Central Government bodies | 30 | 3,612 | 3,851 | 3,987 | |||||
| HFA contribution to Central Government debt | 4,911 | 900 | 563 | 514 | |||||
| of which: Liabilities to Local Authorities | 182 | 220 | 179 | 179 | |||||
| HFA contribution to General Government debt | 4,729 | 680 | 384 | 335 | |||||
| Other Central Government | |||||||||
| Liabilities of Post Office Savings Bank Fund to Post Office Savings Bank | 1,892 | 2,330 | 2,512 | 2,770 | |||||
| Health Service Executive and Voluntary Hospitals | 187 | 146 | 151 | 132 | |||||
| National Oil Reserves Agency | 444 | 336 | 321 | 258 | |||||
| Irish Rail | 128 | 29 | 17 | 0 | |||||
| Westlink buyout: imputed loan from National Toll Roads to National Roads Authority | 510 | 460 | 410 | 360 | |||||
| All other bodies | 36 | 32 | 79 | 105 | |||||
| Other bodies' contribution to Central and General Government debt | 3,197 | 3,333 | 3,490 | 3,625 | |||||
| Total Central Government debt | 103,771 | 143,357 | 168,391 | 191,771 | |||||
| of which: Liabilities to Local Government | 201 | 252 | 197 | 201 | |||||
| Central Government contribution to General Government debt | 103,570 | 143,105 | 168,194 | 191,570 | |||||
| Local Government - Local Authorities | |||||||||
| Borrowing from Housing Finance Agency | 4,583 | 4,449 | 4,358 | 4,439 | |||||
| Borrowing from other Central Government bodies | 104 | 109 | 61 | 30 | |||||
| Other borrowing | 954 | 1,040 | 1,050 | 889 | |||||
| Local Authorities' contribution to Local Government debt | 5,641 | 5,598 | 5,469 | 5,358 | |||||
| VECs and Institutes of Technology | 19 | 19 | 0 | 0 | |||||
| Total Local Government debt | 5,660 | 5,617 | 5,469 | 5,358 | |||||
| of which: Liabilities to Central Government | 4,686 | 4,558 | 4,437 | 4,470 | |||||
| Local Government contribution to General Government debt | 974 | 1,059 | 1,032 | 888 | |||||
| General Government Debt | 104,544 | 144,164 | 169,226 | 192,458 | |||||
Introduction
This release contains detailed annual government finance statistics for the period 2009-2012, consistent with the results from the end-September Excessive Deficit Procedure notification by Ireland in 2013. These figures are compiled in accordance with the ESA95 system of accounts, as used in all member states of the European Union. Their publication coincides with the official publication by Eurostat of deficit and debt levels for all EU member states on Monday 21 October.
This detailed release along with the headline figures published on 14 October 2013 together comprise the second official publication by CSO of annual Government Finance Statistics results for years 2009 to 2012, following the first release in April 2013.
Because audited accounts for many government bodies become available between April and October, this second release allows us to present more final data for 2012 than the provisional outturn published in April.
The data published in both the April and October releases are consistent with the General Government Deficit and Debt levels for 2009 to 2012 reported to Eurostat at end-March and end-September under the EU regulation governing the Excessive Deficit Procedure. Consequently they may not always be fully aligned with the National Income and Expenditure and related publications such as the Institutional Sector Accounts.
Reclassification of Public Universities and Fee-Paying Schools
Since the publication of Government Deficit and Debt data in April 2013, the seven public universities and certain publicly funded fee-paying secondary schools have been reclassified from the Non-profit institutions serving households (NPISH) economic sector to the Non-financial corporations economic sector. This change has been made following an analysis by the CSO that these entities are ‘market producers’ – that is, they cover a majority of their costs through their own sales of education and research services. While not affecting the overall deficit this has resulted in a number of reclassifications within the expenditure of General Government.
Specifically, the changes shift expenditure from D.7 (transfers to NPISH) to a combination of
Government Finance Statistics – Concepts and Definitions
Government Finance Statistics (GFS) form the basis for fiscal monitoring in Europe, in particular in relation to the Excessive Deficit Procedure (EDP).
European GFS, including EDP statistics are produced according to the legally binding accounting rules of the European System of Accounts 1995 (ESA95). The Manual on Government Debt and Deficit (MGDD) provides further guidance on the implementation of ESA95 in the context of GFS.
The ESA 95 regulation sets out both a methodology for the compilation of National Accounts and a programme of transmission of key economic aggregates which are a subset of the full set of accounts set out in ESA 95. In relation to GFS aggregates of interest include: general government revenue and expenditure, general government surplus/deficit, general government consolidated gross debt and their main components.
EU Member States are required to report government deficit/surplus and debt data biannually under the EDP (before 1 April and 1 October in year N) for years N-4 to N-1 calendar years as well as a forecast for the current year. The data are reported in harmonised tables, which provide a consistent framework for the presentation of this data by Member States. The tables provide a structure for linking national budgetary aggregates with government deficit and debt.
Detailed statistics on Government revenue and expenditure are also provided to Eurostat under the ESA95 transmission programme. For annual data the main tables reported are:
Table 0200 Main aggregates of general government,
Table 0900 Detailed tax receipts by sector
Table 1100 General government expenditure by function.
These data are available on the Eurostat website.
Total general government expenditure and revenue are defined according to Commission Regulation (EC) No 1500/2000 of 10 July 2000 on general government expenditure and revenue. They comprise specific categories of ESA 95.
Definition of general government and its subsectors
The general government sector of the economy, is defined in ESA95, paragraph 2.68: 'All institutional units which are other non-market producers [institutional units whose sales do not cover more than the 50% of the production costs, see ESA95 paragraph 3.26] whose output is intended for individual and collective consumption, and mainly financed by compulsory payments made by units belonging to other sectors, and/or all institutional units principally engaged in the redistribution of national income and wealth. General government comprises the sub-sectors central government (S.1311), state government (S.1312 - where applicable), local government (S.1313), and social security funds (S.1314).
As part of the GFS production process CSO is required to define the General Government and public sectors for Ireland. In this context, the public sector includes all bodies that are directly or indirectly controlled by a Government department or office, or by a local authority. General Government, in turn, includes all public sector bodies that are also mainly financed by Government bodies. The decision rules governing the classification of bodies to the public and General Government sectors are set out in detail in the Manual on Government Deficit and Debt. A detailed explanation of the application of these rules and the most up-to-date list of public sector and (including general government bodies) for Ireland are shown at http://www.cso.ie/en/surveysandmethodology/nationalaccounts/.
General Government Deficit/Surplus (GG Deficit) is the standard European measure of the fiscal balance, which is used to monitor compliance with the Stability and Growth Pact. It is the difference between the revenue and the expenditure of the general government sector. The government deficit data related to the EDP (EDP B.9) differs from the deficit according to ESA95 (B.9) in the treatment of interest relating to swaps and forward rate agreements.
Net Lending/Net Borrowing, that is, the GGDeficit excluding flows on interest swap instruments, is by definition equal to both Total Revenue less Total Expenditure, and Net Acquisition of Financial Assets less Net Incurrence of Liabilities. In order to respect this accounting identity, a technical adjustment is made to the level of transactions recorded in liability category F332 (long-term securities other than shares) to eliminate any statistical discrepancy between the two approaches to the calculation of Net Lending/Net Borrowing This adjustment has no impact on Net Worth, gross or net debt.
General Government Debt (GG Debt) is defined in the EU regulations implementing the Maastricht Treaty as the gross debt liabilities of the consolidated General Government sector, at nominal value.
‘Gross’ means that the value of any financial assets held by General Government cannot be deducted from the GGDebt. In Ireland’s case, this means that the liquid assets which are deducted from the ‘gross’ National Debt in arriving at the audited National Debt cannot be deducted from the GGDebt.
‘Debt liabilities’ are defined as the ESA categories AF.2 (Currency and deposits), AF.33 (Securities other than shares, excluding financial derivatives), and AF.4 (loans).
This definition excludes liabilities in derivatives (AF.34), equity liabilities (AF.5), pension and insurance liabilities (AF.6) and accounts payable (AF.7).
‘Consolidated’ means that any money owed by one entity within General Government to another is excluded from the total GGDebt.
‘Nominal value’ is defined in the governing regulation as face value. If debt is sold at a discount, it is the undiscounted value of the instrument, rather than the amount actually received, that is shown in the GGDebt. In other statistical contexts, ‘nominal value’ means face value plus any interest accrued but not paid; however, such interest is excluded from GGDebt by definition.
ESA 95 codes and an explanation of each are shown below for the main components of Government revenue and expenditure as well as for types of financial flows. More detailed codes and technical definitions can be seen in the ESA 95 manual available at http://circa.europa.eu/irc/dsis/nfaccount/info/data/esa95/en/esa95en.htm.
Main Components of General Government Expenditure and Revenue
P.2 Intermediate consumption – value of goods and services used in the process of production, excluding fixed assets
P.5 Gross capital formation
P.51 Gross fixed capital formation - acquisitions, less disposals, of fixed assets during a given period plus certain additions to the value of non-produced assets realised by productive activity. Fixed assets are tangible or intangible assets produced as outputs from processes of production that are themselves used repeatedly, or continuously, in processes of production for more than one year
P.52 Changes in inventories
P.53 Acquisitions less disposals of valuables
D.1 Compensation of employees – the total remuneration of government employees
D.11 Wages and salaries, in cash and in kind
D.12 Employers social contributions – actual (D.121) and imputed (D.122)
D.29 Other taxes on production (payable) all taxes that enterprises incur as a result of engaging in production, independently of the quantity or value of the goods and services produced or sold. These include taxes on use or ownership of land or buildings, taxes on use of fixed assets, taxes on total wage bill and payroll, taxes on international transactions related to production.
D.3 Subsidies (payable) - current unrequited payments which general government or the Institutions of the European Union make to resident producers, with the objective of influencing their levels of production, their prices or the remuneration of the factors of production
D.4 Property income (payable) - the income receivable by the owner of a financial asset or a tangible non-produced asset in return for providing funds to, or putting the tangible non-produced asset at the disposal of, another unit
D.41 Interest (payable) - excludes settlements under swaps and forward rate arrangements, as these are treated as financial transactions in the ESA 95
D.5 Current taxes on income, wealth, etc, (payable) - all compulsory, unrequited payments, in cash or in kind, levied periodically by general government and by the rest of the world on the income and wealth of units in the economy, and some periodic taxes which are assessed neither on income nor wealth
D.6 Social contributions - transfers to households, in cash or in kind, intended to relieve them from the financial burden of a number of risks or needs, made through collectively organised schemes, or outside such schemes by government and non-profit institutions. These include payments from general government to producers which individually benefit households and which are made in the context of social risks or needs
D.62 Social benefits in cash - social benefits and pensions paid in cash;
D.631 Social transfers in kind, via market producers - can be subdivided into those where beneficiary households actually purchase the goods and services themselves and are then reimbursed, and those where the relevant services are provided directly to the beneficiaries
D.7 Other current transfers
D.9 Capital transfers - involve the acquisition or disposal of an asset, or assets, by at least one of the parties to the transaction.
K.1 Consumption of fixed capital - the amount of fixed assets used up, during the period under consideration, as a result of normal wear and tear and foreseeable obsolescence, including a provision for losses of fixed assets as a result of accidental damage which can be insured against.
Categories of Financial Flows
F.1 Monetary gold and special drawing rights (SDRs)
F.11 Monetary gold
F.12 Special drawing rights (SDRs)
F.2 Currency and deposits
F.21 Currency
F.22 Transferable deposits
F.29 Other deposits
F.3 Securities other than shares
F.33 Securities other than shares, excluding financial derivatives (F.331 - Short-term, F.332 - Long-term )
F.34 Financial derivatives
F.4 Loans
F.41 - Short-term loans
F.42 - Long-term loans
F.5 Shares and other equity
F.51 Shares and other equity, excluding mutual funds shares (F.511 - Quoted shares, F.512 - Unquoted shares, F.513 - Other equity )
F.52 Mutual funds shares
F.6 Insurance technical reserves
F.61 Net equity of households in life insurance reserves and in pension funds reserves
F.611 - Net equity of households in life insurance reserves
F.612 - Net equity of households in pension funds reserves,
F.62 - Prepayments of insurance premiums and reserves for outstanding claims
F.7 Other accounts receivable/payable
F.71 Trade credits and advances
F.79 Other
 Hide Background Notes
Scan the QR code below to view this release online or go to
http://www.cso.ie/en/releasesandpublications/er/gfsa/governmentfinancestatisticsoctober2013/
 Show Table 1 General Government transactions: revenue, expenditure, financing and deficit
 Hide Table 1 General Government transactions: revenue, expenditure, financing and deficit