
| € million | |||
| Exports | Imports | Surplus | |
| Jan-Dec 2013 | 86,999 | 50,025 | 36,974 |
| Jan-Dec 2014 | 89,074 | 53,590 | 35,484 |
| % change | +2.4% | +7.1% | -4.0% |
| Seasonally adjusted | |||
| October 2014 | 7,549 | 4,645 | 2,904 |
| November 2014 | 7,033 | 4,755 | 2,278 |
| December 2014 | 8,797 | 4,555 | 4,242 |
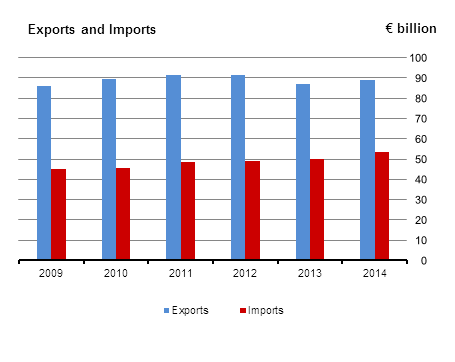
Preliminary figures for 2014 indicate an increase in the value of exports of €2,075 million (+2%) to €89,074 million from 2013. Imports increased by €3,565 million (+7%) to €53,590 million resulting in a 4% decrease in the trade surplus to €35,484 million (see Table 1).
Exports of Medical and pharmaceutical products up in 2014
• Exports of Medical and pharmaceutical products increased by €973 million (+5%) to €22,268 million in 2014 while exports of Organic chemicals decreased by €423 million (-2%) to €18,166 million.
• Chemicals and related products were 58% of the value of 2014 exports.
• In 2014, the United States (22%), Great Britain (13%), Belgium (13%) and Germany (7%) were Ireland’s main export markets, accounting for 55% of the value of exports.
Highest annual imports since 2008
• In 2014 the value of imports was €53,590 million which is the highest level of annual imports since 2008 (€57,585 million).
• Comparing 2014 with 2013, imports of Machinery and transport equipment increased by €2,142 million (+17%) to €14,483 million and Miscellaneous manufactured articles increased by €715 million (+12%) to €6,834 million.
• Machinery and transport equipment (27%) and Chemicals and related products (21%) were the main import sectors in 2014.
• In 2014, Great Britain (30%), the United States (11%), Germany (8%) and China (6%) accounted for 55% of the value of imports.
Preliminary figures for December 2014 show seasonally adjusted exports of €8,797 million, up 25% on November 2014 and seasonally adjusted imports of €4,555 million, down 4% on November 2014. The seasonally adjusted trade surplus was €4,242 million in December 2014 (see Table 2).
| For long labels below use to display on multiple lines | % |
|---|---|
| Food, live animals | 10.4653911093366 |
| Beverages, tobacco | 1.28399862563719 |
| Mineral fuels | 0.926965167896066 |
| Chemicals | 57.9212229201999 |
| Manufactured goods | 2.07880626901193 |
| Transport equipment | 11.2052523067757 |
| Miscellaneous articles | 12.6578893584048 |
| Other | 3.46047424273782 |
| Table 1 Goods Exports and Imports summary analysis | |||||||||
| Period | Value | Volume index1 | Unit value index1 | ||||||
| Exports | Imports | Trade surplus | Base year 1990=100 | ||||||
| €m | €m | €m | Exports | Imports | Exports | Imports | Terms of trade2 | ||
| 1990 | 18,204 | 15,832 | 2,372 | 100.0 | 100.0 | 100.0 | 100.0 | 100.0 | |
| 1991 | 19,070 | 16,317 | 2,753 | 105.6 | 100.8 | 99.3 | 102.3 | 97.0 | |
| 1992 | 21,260 | 16,754 | 4,506 | 121.1 | 105.6 | 96.6 | 100.2 | 96.4 | |
| 1993 | 25,179 | 18,900 | 6,279 | 133.4 | 113.0 | 103.9 | 105.4 | 98.6 | |
| 1994 | 28,891 | 21,945 | 6,946 | 153.2 | 127.9 | 103.8 | 108.1 | 96.0 | |
| 1995 | 35,330 | 26,181 | 9,149 | 184.0 | 146.3 | 105.7 | 112.7 | 93.7 | |
| 1996 | 38,609 | 28,479 | 10,130 | 202.2 | 160.9 | 105.1 | 111.4 | 94.3 | |
| 1997 | 44,868 | 32,863 | 12,004 | 232.4 | 184.8 | 106.3 | 112.0 | 94.9 | |
| 1998 | 57,322 | 39,715 | 17,607 | 289.2 | 218.3 | 109.1 | 114.6 | 95.2 | |
| 1999 | 66,956 | 44,327 | 22,629 | 336.5 | 236.5 | 109.5 | 118.0 | 92.8 | |
| 2000 | 83,889 | 55,909 | 27,980 | 401.4 | 275.2 | 115.0 | 128.0 | 89.9 | |
| 2001 | 92,690 | 57,384 | 35,306 | 422.0 | 274.2 | 120.9 | 131.8 | 91.7 | |
| 2002 | 93,675 | 55,628 | 38,047 | 435.1 | 276.6 | 118.5 | 126.7 | 93.5 | |
| 2003 | 82,076 | 47,865 | 34,212 | 418.4 | 259.7 | 108.0 | 116.1 | 93.0 | |
| 2004 | 84,410 | 51,105 | 33,304 | 446.5 | 283.6 | 104.0 | 113.5 | 91.7 | |
| 2005 | 86,732 | 57,465 | 29,267 | 456.7 | 316.3 | 104.5 | 114.4 | 91.3 | |
| 2006 | 86,772 | 60,857 | 25,915 | 458.0 | 325.2 | 104.4 | 117.7 | 88.7 | |
| 2007 | 89,226 | 63,486 | 25,741 | 481.8 | 340.9 | 101.9 | 117.3 | 86.9 | |
| 2008 | 86,394 | 57,585 | 28,810 | 484.5 | 300.5 | 98.0 | 119.7 | 81.9 | |
| 2009 | 85,804 | 45,061 | 40,742 | 468.4 | 249.2 | 98.9 | 113.9 | 86.8 | |
| 2010 | 89,703 | 45,764 | 43,940 | 485.5 | 241.3 | 101.2 | 119.2 | 84.9 | |
| 2011 | 91,228 | 48,302 | 42,925 | 507.9 | 240.8 | 99.7 | 126.4 | 78.8 | |
| 2012 | 91,688 | 49,146 | 42,542 | 479.1 | 231.9 | 105.8 | 133.7 | 79.2 | |
| 2013 | 86,999 | 50,025 | 36,974 | 460.6 | 238.8 | 103.9 | 131.6 | 78.9 | |
| 2014 | 89,074 | 53,590 | 35,484 | . . | . . | . . | . . | . . | |
| 2013 | Quarter 1 | 21,434 | 12,493 | 8,941 | 449.9 | 236.9 | 104.8 | 132.8 | 78.9 |
| Quarter 2 | 22,032 | 12,224 | 9,808 | 459.3 | 232.7 | 105.6 | 132.3 | 79.8 | |
| Quarter 3 | 21,915 | 12,039 | 9,875 | 465.1 | 229.0 | 103.8 | 132.5 | 78.4 | |
| Quarter 4 | 21,619 | 13,270 | 8,349 | 461.0 | 252.1 | 102.8 | 131.4 | 78.2 | |
| 2014 | Quarter 1 | 21,254 | 13,414 | 7,840 | 454.3 | 253.2 | 103.1 | 133.5 | 77.2 |
| Quarter 2 | 22,799 | 13,170 | 9,629 | 490.6 | 249.8 | 102.3 | 132.8 | 77.0 | |
| Quarter 3 | 22,206 | 13,018 | 9,189 | 467.5 | 246.6 | 104.5 | 133.0 | 78.6 | |
| Quarter 4 | 22,815 | 13,988 | 8,827 | 473.3 | 267.4 | 106.1 | 131.8 | 80.5 | |
| 2013 | January | 6,729 | 4,442 | 2,287 | 419.9 | 251.3 | 105.8 | 133.6 | 79.2 |
| February | 6,619 | 3,913 | 2,706 | 424.1 | 222.4 | 103.1 | 133.0 | 77.5 | |
| March | 8,086 | 4,138 | 3,948 | 505.8 | 237.1 | 105.6 | 131.9 | 80.1 | |
| April | 7,473 | 4,239 | 3,234 | 462.8 | 239.0 | 106.6 | 134.0 | 79.6 | |
| May | 7,218 | 3,949 | 3,268 | 452.1 | 228.4 | 105.4 | 130.7 | 80.7 | |
| June | 7,341 | 4,036 | 3,306 | 463.1 | 230.6 | 104.7 | 132.3 | 79.2 | |
| July | 7,601 | 4,021 | 3,580 | 482.7 | 225.1 | 104.0 | 135.0 | 77.0 | |
| August | 6,981 | 3,977 | 3,003 | 442.6 | 232.8 | 104.0 | 129.3 | 80.4 | |
| September | 7,334 | 4,042 | 3,292 | 469.9 | 229.2 | 103.4 | 133.1 | 77.7 | |
| October | 7,303 | 4,443 | 2,860 | 471.4 | 253.4 | 102.2 | 131.7 | 77.6 | |
| November | 7,734 | 4,447 | 3,288 | 492.2 | 253.8 | 103.0 | 130.8 | 78.7 | |
| December | 6,581 | 4,380 | 2,202 | 419.5 | 249.2 | 103.2 | 131.7 | 78.3 | |
| 20143 | January | 6,960 | 4,541 | 2,420 | 447.6 | 259.4 | 102.7 | 132.3 | 77.6 |
| February | 6,792 | 4,079 | 2,714 | 427.8 | 228.5 | 104.9 | 134.9 | 77.7 | |
| March | 7,501 | 4,795 | 2,706 | 487.5 | 271.8 | 101.6 | 133.3 | 76.2 | |
| April | 7,060 | 4,298 | 2,762 | 461.9 | 244.5 | 100.9 | 132.8 | 76.0 | |
| May | 7,904 | 4,486 | 3,418 | 504.1 | 254.2 | 103.6 | 133.4 | 77.6 | |
| June | 7,835 | 4,387 | 3,448 | 505.8 | 250.7 | 102.3 | 132.3 | 77.4 | |
| July | 6,868 | 4,364 | 2,504 | 440.1 | 249.2 | 103.1 | 132.3 | 77.9 | |
| August | 7,428 | 4,101 | 3,327 | 468.2 | 232.2 | 104.8 | 133.5 | 78.5 | |
| September | 7,910 | 4,552 | 3,358 | 494.2 | 258.3 | 105.7 | 133.2 | 79.4 | |
| October | 7,606 | 4,710 | 2,897 | 477.6 | 271.9 | 105.2 | 130.9 | 80.4 | |
| November | 7,465 | 4,578 | 2,887 | 464.0 | 262.8 | 106.2 | 131.6 | 80.7 | |
| December4 | 7,744 | 4,701 | 3,043 | 478.2 | 267.5 | 107.0 | 132.8 | 80.5 | |
| 1 Monthly data have been rescaled to make their average equal to the annual. | |||||||||
| 2 Export unit value index divided by Import unit value index. | |||||||||
| 3 Revised, see background notes. | |||||||||
| 4 December 2014 is based on current Intrastat response levels, see background notes. | |||||||||
| . . Indices are not yet available. | |||||||||
| Table 2 Goods Exports and Imports seasonally adjusted1 series | ||||||
| Period | Value | Volume index | ||||
| Exports | Imports | Trade surplus | Base year 2010=100 | |||
| €m | €m | €m | Exports | Imports | ||
| 2014 | Quarter 1 | 21,807 | 14,448 | 7,359 | 102.0 | 124.2 |
| Quarter 2 | 23,183 | 14,834 | 8,349 | 105.1 | 128.0 | |
| Quarter 3 | 23,369 | 16,264 | 7,105 | 104.0 | 134.1 | |
| Quarter 4 | 24,624 | 16,804 | 7,820 | 105.5 | 138.8 | |
| 2015 | Quarter 1 | 26,286 | 16,062 | 10,224 | 112.0 | 130.9 |
| Quarter 2 | 28,460 | 17,271 | 11,189 | 112.9 | 134.8 | |
| Quarter 3 | 27,211 | 17,612 | 9,599 | 113.7 | 143.5 | |
| Quarter 4 | 30,823 | 19,205 | 11,618 | 125.8 | 167.6 | |
| 2016 | Quarter 1 | 27,866 | 16,660 | 11,206 | 119.7 | 149.6 |
| Quarter 2 | 29,759 | 19,075 | 10,684 | 126.5 | 161.3 | |
| Quarter 3 | 30,221 | 19,042 | 11,178 | 125.7 | 161.2 | |
| Quarter 4 | 31,010 | 19,262 | 11,749 | 129.0 | 159.6 | |
| 2017 | Quarter 1 | 32,941 | 18,391 | 14,550 | 139.2 | 152.2 |
| Quarter 2 | 30,253 | 20,895 | 9,358 | 133.7 | 183.0 | |
| Quarter 3 | 29,270 | 18,301 | 10,969 | 135.2 | 158.8 | |
| Quarter 4 | 30,012 | 19,536 | 10,476 | 144.3 | 165.9 | |
| 2014 | January | 7,273 | 4,713 | 2,560 | 102.9 | 121.7 |
| February | 7,415 | 4,612 | 2,803 | 104.2 | 117.9 | |
| March | 7,119 | 5,123 | 1,996 | 99.0 | 133.0 | |
| April | 7,080 | 4,572 | 2,508 | 100.6 | 123.0 | |
| May | 8,171 | 5,264 | 2,907 | 109.9 | 134.6 | |
| June | 7,932 | 4,998 | 2,934 | 104.8 | 126.4 | |
| July | 6,951 | 5,591 | 1,360 | 92.7 | 140.2 | |
| August | 8,388 | 5,384 | 3,004 | 113.3 | 131.3 | |
| September | 8,030 | 5,289 | 2,741 | 105.9 | 130.7 | |
| October | 7,873 | 5,509 | 2,364 | 100.2 | 135.3 | |
| November | 7,408 | 5,799 | 1,609 | 94.1 | 144.6 | |
| December | 9,343 | 5,496 | 3,848 | 122.2 | 136.4 | |
| 2015 | January | 8,641 | 5,007 | 3,633 | 110.1 | 126.5 |
| February | 8,966 | 5,316 | 3,650 | 115.2 | 130.5 | |
| March | 8,679 | 5,739 | 2,941 | 110.6 | 135.6 | |
| April | 9,740 | 5,678 | 4,061 | 117.7 | 129.0 | |
| May | 9,376 | 5,887 | 3,489 | 107.8 | 133.7 | |
| June | 9,345 | 5,706 | 3,639 | 113.3 | 141.7 | |
| July | 9,076 | 6,102 | 2,974 | 113.6 | 147.5 | |
| August | 9,150 | 5,725 | 3,425 | 117.8 | 137.4 | |
| September | 8,986 | 5,786 | 3,200 | 109.6 | 145.7 | |
| October | 10,820 | 6,250 | 4,570 | 128.0 | 165.5 | |
| November | 9,521 | 6,108 | 3,413 | 120.4 | 158.1 | |
| December | 10,482 | 6,846 | 3,635 | 129.0 | 179.1 | |
| 2016 | January | 9,449 | 5,084 | 4,365 | 127.0 | 145.3 |
| February | 8,944 | 5,520 | 3,424 | 108.7 | 143.8 | |
| March | 9,473 | 6,056 | 3,417 | 123.3 | 159.6 | |
| April | 9,875 | 5,712 | 4,163 | 125.3 | 148.7 | |
| May | 9,643 | 6,503 | 3,140 | 124.8 | 167.8 | |
| June | 10,241 | 6,860 | 3,381 | 129.4 | 167.4 | |
| July | 9,202 | 6,188 | 3,014 | 118.3 | 156.8 | |
| August | 10,698 | 5,978 | 4,720 | 132.1 | 155.2 | |
| September | 10,321 | 6,876 | 3,444 | 126.7 | 171.6 | |
| October | 10,356 | 5,791 | 4,565 | 130.1 | 144.4 | |
| November | 10,420 | 6,848 | 3,572 | 130.0 | 171.3 | |
| December | 10,234 | 6,623 | 3,612 | 127.0 | 163.1 | |
| 2017 | January | 10,774 | 5,602 | 5,172 | 131.9 | 139.4 |
| February | 11,123 | 6,718 | 4,405 | 142.9 | 166.2 | |
| March | 11,044 | 6,071 | 4,973 | 142.9 | 151.1 | |
| April | 9,860 | 7,097 | 2,763 | 128.9 | 178.8 | |
| May | 10,546 | 7,019 | 3,527 | 137.5 | 187.7 | |
| June | 9,847 | 6,779 | 3,068 | 134.6 | 182.6 | |
| July | 9,716 | 5,639 | 4,077 | 125.6 | 146.3 | |
| August | 9,690 | 6,314 | 3,376 | 133.4 | 163.9 | |
| September | 9,863 | 6,348 | 3,515 | 146.6 | 166.2 | |
| October | 9,727 | 6,379 | 3,349 | 138.4 | 167.7 | |
| November | 9,801 | 6,523 | 3,278 | 138.4 | 163.8 | |
| December | 10,484 | 6,634 | 3,849 | 156.0 | 166.3 | |
| 1 Based on seasonal patterns up to December 2016. Accordingly all values in this table may have been revised. | ||||||
| Table 3 Goods Exports and Imports classified by commodity1 | |||||||||||
| €million | |||||||||||
| SITC (Rev 4) | Exports | Imports | |||||||||
| Dec | Dec | Jan-Dec | Jan-Dec | Dec | Dec | Jan-Dec | Jan-Dec | ||||
| 2013 | 2014 | 2013 | 2014 | 2013 | 2014 | 2013 | 2014 | ||||
| 0 | Food and live animals | 808 | 819 | 8,734 | 9,322 | 546 | 556 | 6,033 | 6,152 | ||
| 00 | Live animals other than animals of Division 03 | 81 | 49 | 432 | 398 | 57 | 68 | 217 | 249 | ||
| 01 | Meat and meat preparations | 285 | 342 | 3,005 | 3,324 | 74 | 74 | 812 | 860 | ||
| 02 | Dairy products and birds' eggs | 155 | 136 | 1,882 | 1,835 | 62 | 61 | 644 | 764 | ||
| 03 | Fish, crustaceans, molluscs and preparations thereof | 48 | 47 | 481 | 525 | 19 | 21 | 211 | 233 | ||
| 04 | Cereals and cereal preparations | 25 | 29 | 296 | 351 | 95 | 78 | 1,005 | 960 | ||
| 05 | Vegetables and fruit | 18 | 21 | 240 | 260 | 86 | 88 | 1,026 | 1,036 | ||
| 06 | Sugars, sugar preparations and honey | 5 | 8 | 116 | 107 | 24 | 29 | 387 | 367 | ||
| 07 | Coffee, tea, cocoa, spices and manufactures thereof | 22 | 25 | 376 | 349 | 35 | 39 | 417 | 446 | ||
| 08 | Feeding stuff for animals (excl. unmilled cereals) | 25 | 23 | 250 | 238 | 62 | 57 | 899 | 772 | ||
| 09 | Miscellaneous edible products and preparations | 143 | 139 | 1,657 | 1,935 | 32 | 41 | 415 | 463 | ||
| 1 | Beverages and tobacco | 92 | 103 | 1,174 | 1,144 | 77 | 76 | 823 | 833 | ||
| 11 | Beverages | 89 | 97 | 1,090 | 1,072 | 74 | 71 | 733 | 746 | ||
| 12 | Tobacco and tobacco manufactures | 4 | 6 | 84 | 71 | 4 | 5 | 90 | 87 | ||
| 2 | Crude materials, inedible, except fuels | 131 | 151 | 1,732 | 1,801 | 51 | 63 | 672 | 724 | ||
| 21 | Hides, skins and furskins, raw | 12 | 14 | 145 | 164 | 0 | 0 | 0 | 0 | ||
| 22 | Oil seeds and oleaginous fruits | 2 | 1 | 11 | 9 | 3 | 2 | 31 | 26 | ||
| 23 | Crude rubber (incl. synthetic and reclaimed) | 0 | 0 | 3 | 4 | 1 | 1 | 15 | 17 | ||
| 24 | Cork and wood | 7 | 9 | 122 | 154 | 6 | 13 | 100 | 127 | ||
| 25 | Pulp and waste paper | 3 | 4 | 53 | 61 | 5 | 4 | 47 | 49 | ||
| 26 | Textile fibres and their wastes | 8 | 9 | 141 | 133 | 1 | 2 | 19 | 21 | ||
| 27 | Crude fertilisers and minerals (excl. coal, petroleum and precious stones) | 7 | 10 | 135 | 143 | 7 | 8 | 113 | 115 | ||
| 28 | Metalliferous ores and metal scrap | 83 | 88 | 1,016 | 1,024 | 16 | 19 | 188 | 203 | ||
| 29 | Crude animal and vegetable materials nes | 9 | 15 | 106 | 109 | 11 | 14 | 159 | 166 | ||
| 3 | Mineral fuels, lubricants and related materials | 44 | 37 | 823 | 826 | 538 | 382 | 6,886 | 6,474 | ||
| 32 | Coal, coke and briquettes | 4 | 4 | 76 | 80 | 21 | 7 | 219 | 164 | ||
| 33 | Petroleum, petroleum products and related materials | 39 | 28 | 721 | 709 | 373 | 257 | 5,022 | 4,950 | ||
| 34 | Gas, natural and manufactured | 1 | 1 | 19 | 19 | 139 | 112 | 1,576 | 1,282 | ||
| 35 | Electric current | 0 | 4 | 6 | 18 | 5 | 6 | 69 | 78 | ||
| 4 | Animal and vegetable oils, fats and waxes | 4 | 5 | 52 | 63 | 18 | 16 | 235 | 217 | ||
| 41 | Animal oils and fats | 3 | 5 | 42 | 53 | 1 | 1 | 13 | 14 | ||
| 42 | Fixed vegetable fats and oils | 1 | 1 | 8 | 7 | 15 | 14 | 199 | 185 | ||
| 43 | Animal or vegetable fats and oils, processed; waxes | 0 | 0 | 2 | 2 | 2 | 1 | 23 | 18 | ||
| 5 | Chemicals and related products | 3,374 | 4,296 | 50,394 | 51,593 | 886 | 920 | 10,873 | 11,396 | ||
| 51 | Organic chemicals | 1,464 | 1,377 | 18,589 | 18,166 | 211 | 191 | 2,548 | 3,018 | ||
| 52 | Inorganic chemicals | 15 | 8 | 197 | 168 | 14 | 23 | 209 | 206 | ||
| 53 | Dyeing, tanning and colouring materials | 6 | 9 | 150 | 117 | 12 | 15 | 183 | 198 | ||
| 54 | Medical and pharmaceutical products | 1,205 | 2,113 | 21,295 | 22,268 | 356 | 402 | 4,499 | 4,476 | ||
| 55 | Essential oils; perfume materials; toilet and cleansing preparations | 422 | 509 | 6,250 | 6,946 | 100 | 107 | 1,084 | 1,126 | ||
| 56 | Fertilisers (other than those of Division 27) | 0 | 0 | 3 | 3 | 54 | 34 | 472 | 415 | ||
| 57 | Plastics in primary forms | 18 | 28 | 312 | 336 | 60 | 56 | 804 | 817 | ||
| 58 | Plastics in non-primary forms | 29 | 30 | 391 | 421 | 37 | 40 | 460 | 509 | ||
| 59 | Chemical materials and products nes | 214 | 223 | 3,207 | 3,168 | 41 | 53 | 613 | 632 | ||
| 6 | Manufactured goods classified chiefly by material | 126 | 132 | 1,711 | 1,852 | 293 | 327 | 3,876 | 4,208 | ||
| 61 | Leather; leather manufactures nes; dressed furskins | 1 | 2 | 27 | 35 | 1 | 1 | 17 | 19 | ||
| 62 | Rubber manufactures nes | 4 | 4 | 64 | 68 | 17 | 20 | 274 | 293 | ||
| 63 | Cork and wood manufactures (excl. furniture) | 16 | 15 | 242 | 240 | 10 | 15 | 160 | 200 | ||
| 64 | Paper, paperboard and articles thereof | 11 | 11 | 152 | 152 | 66 | 67 | 819 | 826 | ||
| 65 | Textile yarn, fabrics, made-up articles and related products | 9 | 15 | 139 | 158 | 26 | 34 | 330 | 406 | ||
| 66 | Non-metallic mineral manufactures nes | 20 | 25 | 292 | 351 | 30 | 35 | 389 | 428 | ||
| 67 | Iron and steel | 8 | 10 | 119 | 139 | 34 | 40 | 508 | 584 | ||
| 68 | Non-ferrous metals | 5 | 5 | 64 | 75 | 45 | 44 | 557 | 551 | ||
| 69 | Manufactures of metals nes | 52 | 44 | 611 | 635 | 63 | 70 | 824 | 901 | ||
| 7 | Machinery and transport equipment | 1,050 | 1,069 | 10,494 | 9,981 | 1,253 | 1,566 | 12,341 | 14,483 | ||
| 71 | Power generating machinery and equipment | 61 | 37 | 809 | 466 | 50 | 42 | 787 | 604 | ||
| 72 | Machinery specialised for particular industries | 47 | 43 | 563 | 669 | 237 | 193 | 1,275 | 2,164 | ||
| 73 | Metalworking machinery | 2 | 2 | 22 | 26 | 5 | 12 | 70 | 93 | ||
| 74 | General industrial machinery and equipment nes and parts nes | 113 | 147 | 1,428 | 1,555 | 103 | 124 | 1,218 | 1,395 | ||
| 75 | Office machines and automatic data processing machines | 520 | 516 | 4,019 | 3,809 | 262 | 334 | 2,848 | 3,077 | ||
| 76 | Telecommunications and sound equipment | 64 | 74 | 672 | 765 | 133 | 154 | 1,127 | 1,354 | ||
| 77 | Electrical machinery, apparatus and appliances nes and parts | 136 | 201 | 2,264 | 1,986 | 164 | 206 | 1,959 | 2,178 | ||
| 78 | Road vehicles (incl. air-cushion vehicles) | 16 | 18 | 233 | 256 | 248 | 345 | 1,878 | 2,575 | ||
| 79 | Other transport equipment | 92 | 32 | 484 | 449 | 51 | 158 | 1,179 | 1,044 | ||
| 8 | Miscellaneous manufactured articles | 859 | 967 | 10,712 | 11,275 | 527 | 609 | 6,119 | 6,834 | ||
| 81 | Prefab buildings; plumbing and electrical fixtures and fittings | 8 | 9 | 111 | 130 | 13 | 17 | 158 | 192 | ||
| 82 | Furniture and parts thereof; bedding, cushions etc | 13 | 11 | 122 | 139 | 28 | 34 | 321 | 369 | ||
| 83 | Travel goods, handbags and similar containers | 1 | 1 | 15 | 15 | 11 | 13 | 108 | 118 | ||
| 84 | Articles of apparel; clothing accessories | 18 | 27 | 216 | 258 | 127 | 140 | 1,512 | 1,633 | ||
| 85 | Footwear | 3 | 4 | 31 | 37 | 25 | 25 | 309 | 320 | ||
| 87 | Professional, scientific and controlling apparatus nes | 275 | 335 | 3,585 | 4,213 | 102 | 127 | 1,309 | 1,508 | ||
| 88 | Photographic apparatus; optical goods; watches and clocks | 79 | 78 | 1,072 | 1,048 | 18 | 21 | 219 | 249 | ||
| 89 | Miscellaneous manufactured articles nes | 464 | 502 | 5,560 | 5,435 | 203 | 233 | 2,184 | 2,445 | ||
| 9 | Commodities and transactions not classified elsewhere | 44 | 109 | 543 | 610 | 93 | 103 | 1,070 | 1,164 | ||
| Unclassified estimates2 | 48 | 55 | 630 | 609 | 98 | 83 | 1,096 | 1,103 | |||
| Total | 6,581 | 7,744 | 86,999 | 89,074 | 4,379 | 4,701 | 50,025 | 53,590 | |||
| 1 December 2014 is based on current Intrastat response levels, see background notes. | |||||||||||
| 2 Estimates for which a commodity classification is not available. | |||||||||||
| Table 4 Goods Exports and Imports classified by country1 | ||||||||
| €million | ||||||||
| Country | Exports | Imports | ||||||
| Dec | Dec | Jan-Dec | Jan-Dec | Dec | Dec | Jan-Dec | Jan-Dec | |
| 2013 | 2014 | 2013 | 2014 | 2013 | 2014 | 2013 | 2014 | |
| Austria | 24 | 34 | 447 | 355 | 21 | 15 | 222 | 212 |
| Belgium | 735 | 855 | 11,227 | 11,790 | 75 | 94 | 999 | 1,112 |
| Bulgaria | 4 | 5 | 70 | 66 | 5 | 6 | 22 | 34 |
| Croatia2 | 2 | 2 | 14 | 28 | 0 | 0 | 1 | 5 |
| Cyprus | 1 | 3 | 32 | 20 | 0 | 0 | 3 | 2 |
| Czech Republic | 42 | 39 | 461 | 466 | 32 | 41 | 331 | 398 |
| Denmark | 39 | 54 | 516 | 591 | 31 | 39 | 685 | 421 |
| Estonia | 2 | 1 | 22 | 18 | 1 | 2 | 15 | 41 |
| Finland | 26 | 33 | 348 | 318 | 7 | 11 | 103 | 139 |
| France | 339 | 421 | 4,042 | 4,676 | 190 | 318 | 2,198 | 2,527 |
| Germany | 444 | 501 | 6,621 | 5,856 | 355 | 379 | 4,124 | 4,255 |
| Great Britain | 1,132 | 1,065 | 12,620 | 11,842 | 1,434 | 1,435 | 15,870 | 16,192 |
| Greece | 25 | 13 | 273 | 274 | 2 | 2 | 30 | 34 |
| Hungary | 20 | 23 | 264 | 246 | 10 | 10 | 105 | 123 |
| Italy | 148 | 161 | 2,299 | 2,103 | 75 | 78 | 875 | 919 |
| Latvia | 3 | 3 | 47 | 55 | 2 | 1 | 23 | 28 |
| Lithuania | 2 | 2 | 33 | 37 | 10 | 6 | 79 | 68 |
| Luxembourg | 7 | 8 | 59 | 79 | 2 | 4 | 51 | 38 |
| Malta | 2 | 2 | 24 | 24 | 1 | 1 | 11 | 8 |
| Netherlands | 297 | 296 | 3,678 | 3,386 | 235 | 239 | 2,691 | 2,642 |
| Northern Ireland | 112 | 130 | 1,478 | 1,586 | 81 | 91 | 1,016 | 1,078 |
| Poland | 73 | 75 | 817 | 954 | 35 | 41 | 387 | 433 |
| Portugal | 28 | 29 | 325 | 355 | 12 | 14 | 143 | 163 |
| Romania | 19 | 34 | 375 | 357 | 9 | 8 | 109 | 98 |
| Slovakia | 5 | 4 | 61 | 55 | 8 | 4 | 61 | 46 |
| Slovenia | 3 | 4 | 35 | 37 | 5 | 8 | 17 | 35 |
| Spain | 223 | 175 | 2,695 | 2,455 | 76 | 88 | 776 | 869 |
| Sweden | 62 | 80 | 741 | 742 | 34 | 31 | 375 | 501 |
| EU Country not specified3 | 1 | 6 | 25 | 42 | 91 | 114 | 1,142 | 1,266 |
| Total EU | 3,820 | 4,058 | 49,649 | 48,812 | 2,837 | 3,082 | 32,463 | 33,689 |
| of which Euro-Zone4 | 2,308 | 2,545 | 32,188 | 31,855 | 1,066 | 1,259 | 12,318 | 13,073 |
| Australia | 37 | 84 | 711 | 701 | 10 | 7 | 91 | 80 |
| Brazil | 25 | 16 | 262 | 256 | 14 | 14 | 274 | 159 |
| Canada | 45 | 48 | 772 | 722 | 36 | 19 | 340 | 358 |
| China5 | 147 | 197 | 1,941 | 2,111 | 279 | 321 | 3,091 | 3,481 |
| India | 82 | 26 | 304 | 248 | 24 | 26 | 387 | 402 |
| Japan | 158 | 127 | 1,692 | 1,761 | 165 | 161 | 1,043 | 1,760 |
| Malaysia | 13 | 24 | 198 | 217 | 16 | 17 | 208 | 229 |
| Mexico | 38 | 74 | 692 | 1,216 | 27 | 21 | 317 | 313 |
| Norway | 17 | 24 | 345 | 320 | 24 | 83 | 1,103 | 938 |
| Russia | 37 | 29 | 637 | 722 | 19 | 13 | 148 | 226 |
| Saudi Arabia | 36 | 93 | 645 | 761 | 0 | 0 | 75 | 12 |
| Singapore | 44 | 45 | 560 | 561 | 29 | 24 | 430 | 350 |
| South Africa | 19 | 19 | 259 | 278 | 7 | 14 | 92 | 93 |
| South Korea | 24 | 43 | 321 | 466 | 42 | 78 | 408 | 483 |
| Switzerland | 588 | 475 | 5,116 | 5,255 | 64 | 78 | 838 | 1,251 |
| Taiwan | 10 | 11 | 130 | 146 | 26 | 25 | 218 | 244 |
| Thailand | 11 | 11 | 138 | 168 | 33 | 49 | 356 | 406 |
| Turkey | 23 | 26 | 429 | 445 | 37 | 46 | 297 | 435 |
| USA | 1,127 | 1,911 | 18,388 | 19,808 | 413 | 466 | 5,233 | 5,812 |
| Other countries | 278 | 401 | 3,784 | 3,976 | 256 | 116 | 2,223 | 2,406 |
| Country unknown6 | 2 | 2 | 27 | 123 | 21 | 40 | 389 | 464 |
| Total | 6,581 | 7,744 | 86,999 | 89,074 | 4,379 | 4,701 | 50,025 | 53,590 |
| 1 December 2014 is based on current Intrastat response levels, see background notes. | ||||||||
| 2 Croatia joined the EU on 1 July 2013. | ||||||||
| 3 Includes estimates for traders below the Intrastat threshold and transactions where the EU country was not specified. | ||||||||
| 4 Euro-zone members from January 2014: Austria, Belgium, Germany, Spain, Finland, France, Luxembourg, Greece, Ireland, Italy, | ||||||||
| the Netherlands, Portugal, Slovenia, Malta, Cyprus, Slovakia, Estonia and Latvia. | ||||||||
| 5China includes Hong Kong and Macao. | ||||||||
| 6 Trade for which the country of origin or country of final destination is unknown. | ||||||||
| Table 5 Goods Exports and Imports classified by commodity and principal countries1 | |||||||||
| €million | |||||||||
| Exports | Imports | ||||||||
| Country by Section level of SITC | Dec | Dec | Jan-Dec | Jan-Dec | Dec | Dec | Jan-Dec | Jan-Dec | |
| 2013 | 2014 | 2013 | 2014 | 2013 | 2014 | 2013 | 2014 | ||
| Great Britain | 1,132 | 1,065 | 12,620 | 11,842 | 1,434 | 1,435 | 15,870 | 16,192 | |
| 0 | Food and live animals | 366 | 356 | 3,456 | 3,552 | 245 | 265 | 2,452 | 2,536 |
| 1 | Beverages and tobacco | 21 | 19 | 289 | 255 | 32 | 31 | 281 | 308 |
| 2 | Crude materials, inedible, except fuels | 26 | 31 | 361 | 415 | 9 | 11 | 138 | 138 |
| 3 | Mineral fuels, lubricants and related materials | 39 | 29 | 538 | 397 | 382 | 296 | 4,496 | 4,174 |
| 4 | Animal and vegetable oils, fats and waxes | 1 | 2 | 16 | 12 | 3 | 3 | 43 | 40 |
| 5 | Chemicals and related products | 346 | 278 | 4,310 | 3,465 | 170 | 198 | 1,967 | 2,129 |
| 6 | Manufactured goods classified chiefly by material | 47 | 58 | 686 | 815 | 118 | 134 | 1,517 | 1,634 |
| 7 | Machinery and transport equipment | 175 | 175 | 1,699 | 1,668 | 220 | 246 | 2,415 | 2,534 |
| 8 | Miscellaneous manufactured articles | 86 | 94 | 954 | 972 | 198 | 203 | 1,946 | 2,065 |
| 9 | Commodities and transactions not classified elsewhere | 24 | 24 | 311 | 291 | 55 | 48 | 615 | 633 |
| Other EU2,3 | 2,688 | 2,993 | 37,029 | 36,970 | 1,404 | 1,647 | 16,594 | 17,497 | |
| 0 | Food and live animals | 272 | 282 | 3,290 | 3,446 | 204 | 220 | 2,540 | 2,576 |
| 1 | Beverages and tobacco | 27 | 29 | 337 | 353 | 30 | 32 | 395 | 370 |
| 2 | Crude materials, inedible, except fuels | 82 | 81 | 945 | 926 | 17 | 22 | 228 | 249 |
| 3 | Mineral fuels, lubricants and related materials | 4 | 7 | 106 | 101 | 12 | 19 | 655 | 450 |
| 4 | Animal and vegetable oils, fats and waxes | 3 | 4 | 29 | 44 | 10 | 11 | 146 | 136 |
| 5 | Chemicals and related products | 1,404 | 1,667 | 22,888 | 22,769 | 376 | 378 | 4,688 | 4,459 |
| 6 | Manufactured goods classified chiefly by material | 45 | 52 | 702 | 739 | 109 | 116 | 1,472 | 1,581 |
| 7 | Machinery and transport equipment | 490 | 465 | 4,430 | 4,122 | 422 | 598 | 3,821 | 4,704 |
| 8 | Miscellaneous manufactured articles | 332 | 370 | 3,918 | 4,084 | 103 | 125 | 1,246 | 1,476 |
| 9 | Commodities and transactions not classified elsewhere | 29 | 36 | 383 | 385 | 121 | 127 | 1,403 | 1,497 |
| USA | 1,127 | 1,911 | 18,388 | 19,808 | 413 | 466 | 5,233 | 5,812 | |
| 0 | Food and live animals | 10 | 13 | 120 | 153 | 31 | 21 | 290 | 237 |
| 1 | Beverages and tobacco | 34 | 41 | 350 | 350 | 1 | 1 | 14 | 18 |
| 2 | Crude materials, inedible, except fuels | 2 | 4 | 26 | 31 | 2 | 2 | 39 | 34 |
| 3 | Mineral fuels, lubricants and related materials | 0 | 0 | 144 | 280 | 0 | 0 | 27 | 142 |
| 4 | Animal and vegetable oils, fats and waxes | - | - | 0 | 0 | 0 | 0 | 2 | 1 |
| 5 | Chemicals and related products | 690 | 1,430 | 12,795 | 13,764 | 153 | 180 | 1,893 | 2,109 |
| 6 | Manufactured goods classified chiefly by material | 21 | 7 | 151 | 119 | 21 | 24 | 292 | 297 |
| 7 | Machinery and transport equipment | 82 | 101 | 1,038 | 1,195 | 143 | 166 | 1,873 | 2,061 |
| 8 | Miscellaneous manufactured articles | 286 | 314 | 3,719 | 3,880 | 58 | 67 | 759 | 870 |
| 9 | Commodities and transactions not classified elsewhere | 2 | 2 | 44 | 35 | 4 | 4 | 44 | 43 |
| China4 | 147 | 197 | 1,941 | 2,111 | 279 | 321 | 3,091 | 3,481 | |
| 0 | Food and live animals | 45 | 51 | 381 | 544 | 2 | 2 | 25 | 30 |
| 1 | Beverages and tobacco | 0 | 0 | 4 | 4 | 0 | 0 | 0 | 0 |
| 2 | Crude materials, inedible, except fuels | 5 | 7 | 93 | 108 | 1 | 3 | 27 | 35 |
| 3 | Mineral fuels, lubricants and related materials | - | - | 0 | 0 | 0 | 0 | 0 | 0 |
| 4 | Animal and vegetable oils, fats and waxes | 0 | 0 | 3 | 2 | - | 0 | 0 | 0 |
| 5 | Chemicals and related products | 43 | 76 | 462 | 753 | 13 | 17 | 192 | 213 |
| 6 | Manufactured goods classified chiefly by material | 1 | 3 | 20 | 28 | 22 | 29 | 294 | 348 |
| 7 | Machinery and transport equipment | 31 | 36 | 734 | 373 | 155 | 166 | 1,515 | 1,684 |
| 8 | Miscellaneous manufactured articles | 20 | 23 | 244 | 299 | 81 | 102 | 996 | 1,129 |
| 9 | Commodities and transactions not classified elsewhere | - | 0 | 0 | 0 | 3 | 3 | 40 | 40 |
| Rest of World | 1,487 | 1,578 | 17,020 | 18,343 | 851 | 831 | 9,238 | 10,607 | |
| 0 | Food and live animals | 114 | 116 | 1,487 | 1,626 | 64 | 48 | 726 | 774 |
| 1 | Beverages and tobacco | 10 | 14 | 194 | 182 | 14 | 13 | 133 | 136 |
| 2 | Crude materials, inedible, except fuels | 15 | 27 | 308 | 321 | 21 | 25 | 240 | 268 |
| 3 | Mineral fuels, lubricants and related materials | 0 | 0 | 34 | 47 | 144 | 67 | 1,708 | 1,708 |
| 4 | Animal and vegetable oils, fats and waxes | 0 | 0 | 4 | 4 | 4 | 2 | 44 | 40 |
| 5 | Chemicals and related products | 891 | 846 | 9,939 | 10,842 | 174 | 148 | 2,132 | 2,487 |
| 6 | Manufactured goods classified chiefly by material | 12 | 14 | 151 | 151 | 22 | 24 | 301 | 347 |
| 7 | Machinery and transport equipment | 273 | 293 | 2,593 | 2,622 | 313 | 390 | 2,718 | 3,500 |
| 8 | Miscellaneous manufactured articles | 135 | 166 | 1,875 | 2,040 | 88 | 111 | 1,172 | 1,294 |
| 9 | Commodities and transactions not classified elsewhere | 38 | 101 | 436 | 507 | 7 | 5 | 63 | 53 |
| Total | 6,581 | 7,744 | 86,999 | 89,074 | 4,379 | 4,701 | 50,025 | 53,590 | |
| 1 December 2014 is based on current Intrastat response levels, see background notes. | |||||||||
| 2 Croatia joined the EU on 1 July 2013. | |||||||||
| 3 Includes estimates for traders below the Intrastat threshold and transactions where the EU country was not specified. | |||||||||
| 4 China includes Hong Kong and Macao. | |||||||||
Introduction
Goods Exports and Imports statistics provide data on the movement of goods between countries. The statistics are a combination of Customs-based non-EU trade statistics and data from the Intrastat Survey of Irish traders involved in trade with other EU member states. The collection of trade data is the responsibility of VIMA (a branch of Revenue). The CSO is responsible for processing and disseminating the data.
Revisions
Trade figures are subject to revision on the incorporation of late Intrastat and VAT returns and corrections made by traders. When the preliminary results for a month are published, the results for months -1 November 2014 in this publication), -4 (August 2014) and -8 (April 2014) are revised.
Intrastat System
The Intrastat system has two components. Firstly, the Intrastat survey (conducted by the Revenue Commissioners), in which traders, above the Intrastat survey trade thresholds, make detailed monthly returns giving information on the quantity and value of all exports to or imports from EU countries.
The total number of traders required to make a detailed import return is around 6,700 while around 1,900 must make a detailed export return. The response rate in terms of number of traders in December 2014 was 68%, covering an estimated 91% of the total value of intra-EU trade (these response rates will have increased by the next time data for December is published).
The second component of the Intrastat system is the regular VAT return, on which all traders are required to record the total value of goods imported from and exported to other EU countries. This information provides the basis for determining total EU trade for those traders below the Intrastat survey thresholds. It is also used to maintain the register of EU traders.
Extrastat System
The statistics of trade with non-EU countries are compiled from the documents supplied by importers and exporters to the Customs authorities. The document is the Single Administrative Document (SAD) used for Customs clearance purposes.
Estimation
The figures in this release include estimates for traders above the Intrastat thresholds who did not make detailed returns for the period and for traders below the thresholds who did not provide aggregate intra-EU trade figures on their VAT returns.
Estimates for Intrastat non-respondents are apportioned to individual commodities and countries whenever previous Intrastat returns are available. Estimates for traders below the Intrastat thresholds are assigned to partner country where possible, but not to commodity.
Imports incorporate an upward adjustment of 1.75% of total imports, which is included in ‘Unclassified estimates’. This special adjustment arises from the difficulty of comprehensively covering all EU imports through the Intrastat survey system. The unclassified category also includes certain miscellaneous adjustments.
More information is now being processed on lower value transactions. Prior to January 2012, transactions below €254 were grouped together, this value has now decreased to €127. Therefore, this has resulted in more detail being available at commodity level in Table 3 and at country level in Tables 4 and 5.
Unit Value Indices
The monthly unit value index measures monthly unit value trends relative to the annual levels in the preceding year using value weights relating to that year’s trade (Laspeyres index).
The annual index is compiled using value weights for both the current and previous year (Fisher index) to allow for change in the structure of trade in goods.
The monthly index series should be regarded as interim measures suitable for month-to-month comparisons within a given year. Previous monthly indices are revised when late returns are received.
When the annual unit value index is compiled, the monthly unit value indices are rescaled to make their average equal to the annual index.
Seasonally Adjusted Series
Monthly exports, imports, trade surplus and the volume series for exports and imports have been seasonally adjusted using the US Bureau of the Census X-11 Variant of the Census Method 11 Seasonal Adjustment Program. In the main, monthly projections are based on series recalculated at the end of the previous year.
Methodology
There are methodological differences between the measurement of exports and imports in this release compared with Industrial Production, National Accounts and Balance of Payments statistics. This release records the movement of all goods over the frontier at the valuation placed on the goods at the time of crossing the frontier. Industrial Production, National Accounts and Balance of Payments statistics take account of additional aspects of cross-frontier activities such as goods sent abroad for processing where goods cross the frontier without change of ownership. The CSO releases for those statistics provide more information on their methodology.
Services Exports and Imports
The quarterly Balance of Payments (BOP) statistics provide detail on Services exports and imports.
 Hide Background Notes
Scan the QR code below to view this release online or go to
http://www.cso.ie/en/releasesandpublications/er/gei/goodsexportsandimportsdecember2014/
 Show Table 1 Goods Exports and Imports summary analysis
 Hide Table 1 Goods Exports and Imports summary analysis