
This release has been compiled during the COVID-19 crisis. The results contained in this release reflect some of the economic aspects of the COVID-19 situation.
It is important to note that the results presented in the survey represent responding enterprises only. The CSO acknowledges that non-response may be related to whether businesses are adversely impacted by COVID-19. If this were the case, there is potential for bias in these estimates that weighting procedures would not correct for. As such, the results presented here are unweighted.
For further information see Background Notes. Business Impact of COVID-19
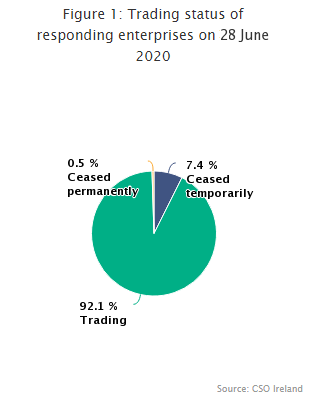
| Trading status of responding enterprises on 28 June 2020 | ||
| % of responding enterprises | ||
| Sector | Trading | Ceased trading, (temporarily or permanently) |
| Industry | 98.4 | 1.6 |
| Construction | 80.3 | 19.7 |
| Wholesale and Retail | 97.1 | 2.9 |
| Accommodation and Food Services | 37.1 | 62.9 |
| All other Services | 93.3 | 6.7 |
| Total | 92.1 | 7.9 |
The Business Impact of COVID-19 Survey (BICS) has been created to measure and report quickly on the impact of COVID-19 on business in Ireland. The fourth wave of the survey was collected in the week commencing 29 June 2020.
A total of 3,000 enterprises were surveyed online for the fourth wave of the BICS, with 27.1% of sampled enterprises completing the survey. The survey reports:
For further information, see Infographic
| Please note that not all businesses may be in a position to respond to the Business Impact of COVID-19 Survey. Therefore, the results will only reflect the characteristics of those who responded. |
| X-axis label | Trading | Ceased trading temporarily or permanently |
|---|---|---|
| Industry | 98.4 | 1.6 |
| Construction | 80.3 | 19.7 |
| Wholesale and Retail | 97.1 | 2.9 |
| Accommodation and Food Services | 37.1 | 62.9 |
| All other Services | 93.3 | 6.7 |
Most responding Wholesale and Retail enterprises were trading
| X-axis label | Restarted trading |
|---|---|
| Industry | 26.9 |
| Construction | 46.7 |
| Wholesale and Retail | 33 |
| Services | 28.1 |
| Total | 31.3 |
Almost a third of responding enterprises restarted trading in June
| X-axis label | 1 Jun-28 Jun | 29 Jun-26 Jul |
|---|---|---|
| 75 to 100% less than normal | 12.8 | 10.1 |
| 50 to 74% less than normal | 12 | 12.4 |
| 25 to 49% less than normal | 21.8 | 17.9 |
| 10 to 24% less than normal | 15 | 20 |
| At or close to normal expectation | 28.2 | 33.6 |
| Higher than normal | 10.2 | 5.9 |
Six in ten enterprises had lower than normal turnover from 1 June to 28 June 2020
| For long labels below use to display on multiple lines | Increased | No change or decreased | Don't know |
|---|---|---|---|
| Industry | 28 | 66.5 | 5.5 |
| Construction | 34.4 | 60.7 | 4.9 |
| Wholesale and Retail | 49.1 | 43.5 | 7.4 |
| Services | 20.9 | 72.3 | 6.8 |
| Total | 33.9 | 59.5 | 6.5 |
A third of enterprises had an increase in turnover since the easing of COVID-19 restrictions on 8 June 2020 (Phase 2)
| X-axis label | Imports | Exports |
|---|---|---|
| Decrease | 28.8 | 34.2 |
| Increase | 7.2 | 7.9 |
| Not affected | 54.2 | 49.1 |
| Don't know | 9.9 | 8.9 |
Exports unaffected for nearly half of responding exporters
| For long labels below use to display on multiple lines | Staff working at their normal place of work | Staff working remotely | Not currently working | Other (deployed elsewhere etc.) |
|---|---|---|---|---|
| Micro (<10) | 59.8 | 15.9 | 16.6 | 7.7 |
| Small (10-49) | 67.2 | 20.7 | 8.1 | 4 |
| Medium (50-249) | 52.5 | 33.8 | 11.9 | 1.7 |
| Large (250+) | 45.9 | 40.8 | 10.2 | 3.1 |
| Total | 58.3 | 26.8 | 11 | 3.9 |
Responding enterprises had an average of 58.3% of staff working at their normal place of work in the week ending 28 June 2020
| For long labels below use to display on multiple lines | Returned from temporary leave | Returned from remote working |
|---|---|---|
| Micro (<10) | 28.2 | 10.1 |
| Small (10-49) | 23.1 | 7 |
| Medium (50-249) | 15.2 | 7.9 |
| Large (250+) | 7.6 | 3.3 |
| Total | 19.1 | 7.1 |
Responding enterprises had an average of 19.1% of workforce return from temporary leave
| X-axis label | Workplace measures |
|---|---|
| Staff remote working | 59.5 |
| Rearranging workspace to facilitate social distancing | 78 |
| Staggering shifts to facilitate social distancing | 38.6 |
| Occupancy limits in the workplace | 41.7 |
| Mandatory PPE (face covering, gloves, etc.) in the workplace | 46.7 |
| Maintaining log of meeting to facilitate contact tracing | 42.7 |
| Temperature screening | 30.4 |
| Other | 10.1 |
| No measures | 3 |
Three in ten enterprises used temperature screening in the workplace
| X-axis label | Median spend |
|---|---|
| Micro (<10) | 500 |
| Small (10-49) | 4000 |
| Medium (50-249) | 10000 |
| Large (250+) | 42500 |
Large enterprises had a median spend of €42,500 on COVID-19 measures
A third of enterprises reported lower than projected personnel costs
| For long labels below use to display on multiple lines | Personnel costs |
|---|---|
| 50-100% lower | 7.9 |
| 20-50% lower | 12 |
| Up to 20% lower | 12.9 |
| No change | 37.5 |
| Up to 20% higher | 14.5 |
| Over 20% higher | 2 |
| Don't know | 13.2 |
| For long labels below use to display on multiple lines | non-personnel costs |
|---|---|
| 50-100% lower | 3.6 |
| 20-50% lower | 6.6 |
| Up to 20% lower | 18.6 |
| No change | 31.6 |
| Up to 20% higher | 21.1 |
| Over 20% higher | 2.3 |
| Don't know | 16.3 |
| X-axis label | Measures taken |
|---|---|
| Deferred or changed loan repayments | 16.2 |
| Deferred or changed property payments (including rent, utilities and local authority rates) | 22.8 |
| Deferred or changed revenue payments | 25.2 |
| Deferred or changed payments to suppliers | 20.4 |
| Increased overdraft facilities | 7 |
| Other | 6.3 |
| No measures taken | 53.3 |
A quarter of enterprises deferred or changed revenue payments
| For long labels below use to display on multiple lines | Innovations |
|---|---|
| Adopted new methods of providing products and services | 30.5 |
| Adopted new methods of communication | 53.8 |
| Introduced new products | 13.1 |
| Repurposed production (e.g. to supply PPE, hand sanitiser, etc.) | 10.9 |
| Other | 3.8 |
More than three in ten enterprises adopted new methods of providing products and services
| For long labels below use to display on multiple lines | SMEs (<250) | Large (250+) | Total |
|---|---|---|---|
| Decreased | 6.7 | 2 | 5.8 |
| Increased | 4.4 | 3.4 | 4.2 |
| No change | 72.7 | 84.6 | 74.9 |
| Don't know | 16.2 | 10.1 | 15.1 |
Three quarters of responding enterprises reported no change in ability to access finance
Almost two thirds of responding enterprises expressed confidence in having financial resources to continue operating for longer than six months
| For long labels below use to display on multiple lines | Continue to operate |
|---|---|
| Up to 1 month | 1.7 |
| Up to 3 months | 12.5 |
| Up to 6 months | 12.4 |
| Longer than 6 months | 63.7 |
| Not confident | 1.1 |
| Don't know | 8.7 |
Nearly three in five enterprises availed of Government supports
| For long labels below use to display on multiple lines | Government support |
|---|---|
| Yes | 59.4 |
| No | 40.6 |
| Table 1 Restarted trading in the four weeks 1 Jun to 28 Jun 2020 by sector | |
| Sector | % of responding enterprises |
| Industry | 26.9 |
| Construction | 46.7 |
| Wholesale and Retail | 33.0 |
| Services | 28.1 |
| Total | 31.3 |
| Table 2 Estimated impact on turnover in the previous (1 Jun - 28 Jun) and forthcoming (29 Jun - 26 Jul) four week periods | ||
| % of responding enterprises | ||
| Estimated impact on turnover | 1 Jun-28 Jun | 29 Jun-26 Jul |
| 75-100% less than normal | 12.8 | 10.1 |
| 50-74% less than normal | 12.0 | 12.4 |
| 25-49% less than normal | 21.8 | 17.9 |
| 10-24% less than normal | 15.0 | 20.0 |
| At or close to normal expectation | 28.2 | 33.6 |
| Higher than normal | 10.2 | 5.9 |
| Total | 100.0 | 100.0 |
| Table 3 Change in turnover following phase two easing of restrictions on 8 Jun 2020 by sector | |||
| % of responding enterprises | |||
| Sector | Increased | No change or decreased | Don't know |
| Industry | 28.0 | 66.5 | 5.5 |
| Construction | 34.4 | 60.7 | 4.9 |
| Wholesale and Retail | 49.1 | 43.5 | 7.4 |
| Services | 20.9 | 72.3 | 6.8 |
| Total | 33.9 | 59.5 | 6.5 |
| Table 4 COVID-19 impact on international trade, 1 Jun to 28 Jun 2020 | ||
| % of responding enterprises | ||
| Impact on international trade | Exports | Imports |
| Decrease | 34.2 | 28.8 |
| Increase | 7.9 | 7.2 |
| Not affected | 49.1 | 54.2 |
| Don't know | 8.9 | 9.9 |
| Total | 100.0 | 100.0 |
| Table 5 Average percentage of workforce by location and size class in the week ending 28 Jun 2020 | |||||
| % of responding enterprises | |||||
| Location | Micro | Small | Medium | Large | Total |
| (<10) | (10-49) | (50-249) | (250+) | ||
| Staff working at their normal place of work | 59.8 | 67.2 | 52.5 | 45.9 | 58.3 |
| of which: | |||||
| Returned from temporary leave (1 Jun - 28 Jun) | 28.2 | 23.1 | 15.2 | 7.6 | 19.1 |
| Returned from remote working (1 Jun - 28 Jun) | 10.1 | 7.0 | 7.9 | 3.3 | 7.1 |
| Staff working remotely | 15.9 | 20.7 | 33.8 | 40.8 | 26.8 |
| Not currently working | 16.6 | 8.1 | 11.9 | 10.2 | 11.0 |
| Other (deployed elsewhere etc.) | 7.7 | 4.0 | 1.7 | 3.1 | 3.9 |
| Table 6 Workplace measures implemented due to COVID-19 up to 28 Jun 2020 | |
| % of responding enterprises | |
| Staff remote working | 59.5 |
| Rearranging workspace to facilitate social distancing | 78.0 |
| Staggering shifts to facilitate social distancing | 38.6 |
| Occupancy limits in the workplace | 41.7 |
| Mandatory PPE (face covering, gloves, etc.) in the workplace | 46.7 |
| Maintaining log of meeting to facilitate contact tracing | 42.7 |
| Temperature screening | 30.4 |
| Other | 10.1 |
| No measures | 3.0 |
| Table 7 Median spend on measures to comply with COVID-19 requirements for trading | |
| Size class | Median spend |
| Micro (<10) | €500 |
| Small (10-49) | €4,000 |
| Medium (50-249) | €10,000 |
| Large (250+) | €42,500 |
| Table 8 Estimated change in operating costs up to 28 Jun 2020 | ||
| % of responding enterprises | ||
| Estimated change in operating costs | Personnel costs | Non-personnel costs |
| 50-100% lower | 7.9 | 3.6 |
| Between 20-50% lower | 12.0 | 6.6 |
| Up to 20% lower | 12.9 | 18.6 |
| No change | 37.5 | 31.6 |
| Up to 20% higher | 14.5 | 21.1 |
| More than 20% higher | 2.0 | 2.3 |
| Don't know | 13.2 | 16.3 |
| Table 9 Measures taken to manage cashflow as a result of the COVID-19 crisis in the four weeks 1 Jun to 28 Jun 2020 | |
| % of responding enterprises | |
| Deferred or changed loan repayments | 16.2 |
| Deferred or changed property payments (including rent, utilities and local authority rates) | 22.8 |
| Deferred or changed revenue payments | 25.2 |
| Deferred or changed payments to suppliers | 20.4 |
| Increased overdraft facilities | 7.0 |
| Other | 6.3 |
| No measures taken | 53.3 |
| Table 10 Innovations adopted due to COVID-19 up to 28 Jun 2020 | |
| % of responding enterprises | |
| Adopted new methods of providing products and services | 30.5 |
| Adopted new methods of communication | 53.8 |
| Introduced new products | 13.1 |
| Repurposed production to supply products needed during COVID-19 crisis (e.g. PPE, hand sanitiser or other in-demand products etc.) | 10.9 |
| Other | 3.8 |
| Table 11 Changes in access to finance by size class, 1 Jun to 28 Jun 2020 | |||
| % of responding enterprises | |||
| Access to finance | SMEs | Large | Total |
| (<250) | (250+) | ||
| Decreased | 6.7 | 2.0 | 5.8 |
| Increased | 4.4 | 3.4 | 4.2 |
| No change | 72.7 | 84.6 | 74.9 |
| Don't know | 16.2 | 10.1 | 15.1 |
| Total | 100.0 | 100.0 | 100.0 |
| Table 12 Confidence in financial resources to continue operating throughout the COVID-19 crisis, 1 Jun to 28 Jun 2020 | |
| % of responding enterprises | |
| Up to 1 month | 1.7 |
| Up to 3 months | 12.5 |
| Up to 6 months | 12.4 |
| Longer than 6 months | 63.7 |
| Not confident | 1.1 |
| Don't know | 8.7 |
| Total | 100.0 |
| Table 13 Availing of Government supports, 1 Jun to 28 Jun 2020 | |
| % of responding enterprises | |
| Availed of Government support* | 59.4 |
| of which: | |
| Revenue Temporary COVID-19 Wage Subsidy Scheme | 55.6 |
| COVID-19 Working Capital Loan Scheme (SBCI) | 2.3 |
| COVID-19 Business Financial Planning Grant (Enterprise Ireland) | 2.3 |
| Restart Grant (Local Authority) | 11.2 |
| Business Continuity Voucher (LEO) | 4.8 |
| Other | 5.2 |
| Not availed of Government support | 40.6 |
| Total | 100.0 |
| * Note that some enterprises have availed of more than one type of government support. | |
The Business Impact of COVID-19 Survey (BICS) has been created to measure and report quickly on key features of the impact of the COVID-19 crisis on business in Ireland.
The survey is being conducted online and covers a sample of approximately 3,000 enterprises. The first wave of the survey was collected in the week commencing 20 April 2020 while the second and third waves were collected in the weeks commencing 4 May and 2 June respectively. The fourth wave of the survey was issues on 29 June.
| Wave | Response Rate |
| 1 | 26.0% |
| 2 | 24.5% |
| 3 | 27.9% |
| 4 | 27.1% |
The survey was collected from enterprises on a voluntary basis under Section 24 of the Statistics Act, 1993.
The information collected in the survey is confidential under the Statistics Act and will only be used by the Central Statistics Office for the compilation of aggregate statistics. The CSO has checked the statistical outputs of the survey to ensure that tables do not disclose details of any company. The raw data will not be shared with any other organisations.
The CSO would like to thank businesses that responded to the Business Impact of COVID-19 Survey.
The reporting statistical unit for the BICS is the enterprise. The sample size for the BICS is approximately 3,000 enterprises. The enterprise is defined as the smallest combination of legal units that is an organisational unit producing goods and/or services, which benefits from a certain degree of autonomy in decision-making.
There was a response rate of 27.1% to the fourth wave of the survey. It is important to note that the results of the survey apply to respondents only, and that no imputation or estimation procedures have been used in the case of non-response. The CSO acknowledges that not all businesses may be in a position to respond to the survey. Therefore, as the results of the survey are unweighted, they may only reflect the characteristics of those who have responded.
Enterprises of all size classes were surveyed. The sectors of economic activity included in the survey were determined in accordance with the NACE Rev. 2 classification scheme, which is the European Commission’s classification system for economic activity. The NACE Rev. 2 sectors included in the survey were as follows:
Sector B: Mining and quarrying
Sector C: Manufacturing
Sector D: Electricity, gas, steam and air conditioning supply
Sector E: Water supply; sewerage, waste management and remediation activities
Sector F: Construction
Sector G: Wholesale and retail trade; Repair of motor vehicles and motorcycles
Sector H: Transportation and storage
Sector I: Accommodation and food service activities
Sector J: Information and communication
Sector K: Financial and insurance activities
Sector L: Real estate activities
Sector M: Professional, scientific and technical activities
Sector N: Administrative and support service activities
Sector R: Arts, entertainment and recreation
Sector S: Other service activities
Please note that some more granular NACE Rev. 2 descriptions were also referenced in the text of this release. For further information on the NACE Rev. 2 classification scheme, please click Classifications
The survey is collected via an online questionnaire. The topics covered are about how the COVID-19 crisis has affected business and what steps have been taken as a result – e.g. in relation to the level of business, workforce and organisational changes, access to finance, and availing of Government support schemes.
The following is a link to the questionnaire for each wave of the BICS survey:Business Impact of COVID-19 Survey
Size Class
For the BICS, the size class of an enterprise is determined by the number of persons engaged associated with the enterprise as follows:
| Size Class | Number of Persons Engaged |
| Micro | 0 - 9 |
| Small | 10 - 49 |
| Medium | 50 - 249 |
| SMEs | 0 - 249 |
| Large | 250+ |
A Small or Medium Enterprise (SME) is essentially an amalgamation of the Micro, Small and Medium categories, i.e. having 0-249 persons engaged.
Sector
In the above results, there are cases where several NACE Rev. 2 categories are presented in aggregate form as follows:
| Sector | NACE Rev. 2 Category |
| Industry | B-E |
| Construction | F |
| Wholesale and Retail | G |
| Services | H-N, R-S |
Note: Some of the data presenting in the release separate Accommodation and Food Services (NACE I) from Services.
Other Breakdowns
Many of the breakdowns in this release are based on the enterprise’s own best estimate at a point in time. The qualitative nature of these breakdowns has been chosen to limit burden on respondents.
 Hide Background Notes
Scan the QR code below to view this release online or go to
http://www.cso.ie/en/releasesandpublications/er/bic19/businessimpactofcovid-19survey1junto28jun2020/
 Show Table 1 Restarted trading in the four weeks 1 Jun to 28 Jun 2020 by sector
 Hide Table 1 Restarted trading in the four weeks 1 Jun to 28 Jun 2020 by sector