
| Business Expenditure on Research and Development (R&D) 2009-20161 | |||||
| €'000 | |||||
| 2009 | 2011 | 2013 | 2015 | 20161 | |
| Current Expenditure | 1,542,843 | 1,606,911 | 1,874,663 | 2,075,955 | 2,090,611 |
| Capital Expenditure | 325,613 | 150,314 | 147,200 | 157,102 | 202,214 |
| Total Expenditure | 1,868,456 | 1,757,225 | 2,021,863 | 2,233,057 | 2,292,825 |
| of which | |||||
| Irish Spend | 563,217 | 536,868 | 703,121 | 809,662 | 926,004 |
| Foreign Spend | 1,305,239 | 1,220,357 | 1,318,742 | 1,423,395 | 1,366,821 |
| 1Expenditure for 2016 is estimated | |||||
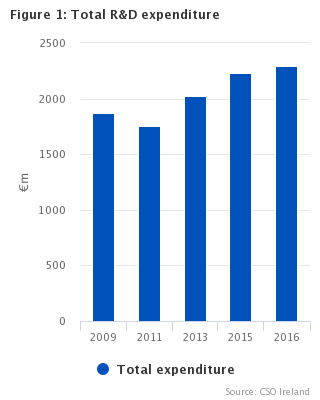
Results from the 2015 - 2016 Business Expenditure on Research and Development survey show that in excess of €2.2bn was spent on research and development (R&D) activities by enterprises in Ireland in 2015. This represents an increase of 10% compared with actual expenditure in 2013. Current expenditure, which comprises labour costs and other current costs, accounted for 93% of all expenditure in 2015, with capital expenditure accounting for the remaining 7% or €157m of total expenditure.
Irish owned enterprises reported an increase in R&D spend of 15% or €107m, up from €703m in 2013 to €810m in 2015.
Enterprises were also asked for their estimated R&D expenditure in 2016. These estimates indicate that R&D expenditure increased to €2.3bn in 2016, with the split between current and capital expenditure similar to data reported for 2015. See Headline Table and Figure 1.
Large enterprises’ share of R&D expenditure at 55% in 2015
Enterprises that employ 250 persons or more had the greatest share of R&D expenditure in 2015 with 55% of all actual expenditure, this accounted for €1.2bn of the total spend. Small enterprises with less than 50 persons engaged spent almost €502m on R&D in 2015 which accounted for over 22% of the spend. Medium sized enterprises employing between 50 and 249 persons spent just over €503m in the same period which represented 23% of total spend.
The breakdown of R&D expenditure in 2016 by employment size class shows a similar distribution to 2015, with small enterprises estimating that they would spend approximately €580m. Medium enterprises forecast a spend of €522m. Large enterprises estimated they would spend nearly €1.2bn in 2016. See Figure 2 and Table 1.
| For long labels below use to display on multiple lines | Share of total R&D expenditure |
|---|---|
| Small (<50) | 22.5 |
| Medium (50-249) | 22.5 |
| Large (250+) | 55 |
Labour Costs account for 61% of all R&D expenditure
In 2015, enterprises reported that over €1.3bn was spent on labour costs, which accounted for 61% of all R&D expenditure. Other current costs, which include materials, supplies, equipment and overheads associated with R&D, had a spend of nearly €726m which accounted for 33% of total expenditure. The remaining expenditure of €157m was accounted for by capital expenditure with just over 53% of capital expenditure being spent on Instruments and Equipment wholly acquired for R&D purposes. See Figure 3 and Tables 2 and 3.
| For long labels below use to display on multiple lines | Share of total R&D expenditure |
|---|---|
| Labour costs | 60.5 |
| Other current costs | 32.5 |
| Capital expenditure | 7 |
Two-thirds of R&D expenditure is by Foreign owned enterprises
Foreign owned enterprises accounted for 64% of all R&D expenditure, with just over €1.3bn being spent on current expenditure, which represented 93% of all their R&D expenditure. The remaining 7% or €98m was spent on capital expenditure. Irish owned enterprises in comparison spent over €800m on R&D, with current expenditure at €751m accounting for nearly 93% of this expenditure. The remaining 7% or €59m was spent on capital expenditure. See Figure 4 and Table 1.
The largest 100 enterprises in terms of R&D spend accounted for over €1.6bn, or 73%, of the total R&D expenditure in 2015. Of these top 100 enterprises, 76% of the spend can be attributed to foreign owned enterprises. The spend of enterprises outside the Top 100 amounted to over €608m. Of this spend, €184m, or 30%, can be attributed to foreign owned enterprises, with Irish owned enterprises accounting for almost €424m, or 70%, of the spend.
| For long labels below use to display on multiple lines | Share of total R&D expenditure |
|---|---|
| Irish owned enterprises | 36.3 |
| Foreign owned enterprises | 63.7 |
Services sector accounted for 61% of total R&D expenditure
R&D spending was highest in the Services sector, accounting for 61% of all expenditure. Spending in this sector was nearly €1.4bn in 2015, while the Manufacturing sector spent over €876m on R&D. For the purposes of this survey it should be noted that spending in the Services sector includes the spend from all other non-Manufacturing sectors. The value of this contribution to the Services sector total is not significant.
Service sector enterprises reported that labour costs accounted for 74% of their current expenditure, while Manufacturing enterprises stated that 51% of their current expenditure was related to labour costs. In terms of capital expenditure, Manufacturing enterprises spent nearly €71m which represents 45% of all capital expenditure on R&D. See Figure 5 and Tables 2 and 3.
| For long labels below use to display on multiple lines | Share of total R&D expenditure |
|---|---|
| Manufacturing sector | 39.2 |
| Services sector | 60.8 |
Southern and Eastern region account for over 80% of all R&D expenditure
Total R&D spending in the Southern and Eastern region (SE) region was in excess of €1.8bn in 2015 which accounted for 83% of all R&D expenditure. The remainder of all R&D expenditure (17%), which accounted for €384m of the total spend, was spent in the Border, Midland and Western (BMW) region. 93% of all R&D spending in the SE region can be attributed to current expenditure, while the corresponding figure for the BMW region was 92%. See Figure 6 and Table 1.
| For long labels below use to display on multiple lines | Share of total R&D Expenditure |
|---|---|
| Border, Midland and Western region | 17.2 |
| Southern and Eastern region | 82.8 |
Funding of R&D expenditure by enterprises
Enterprises were asked to report on how R&D expenditure was funded. 88% of all R&D expenditure was funded by enterprises’ own company/internal funds, while 6% of expenditure was funded from public funds. Small enterprises were more likely to use public funds, with 7% of funding for these enterprises attributed to public funding.
| Small (<50) | Medium (50-249) | Large (250+) | |
| Own company/internal funds | 18.9 | 19.5 | 49.4 |
| Public funding | 1.6 | 0.6 | 3.4 |
| All other sources | 2 | 2.4 | 2.2 |
Ireland ranked 9th in EU28 in terms of R&D intensity in 2013
The Business Expenditure on Research and Development survey is carried out in all EU28 member states. The most recent data available from Eurostat is taken from the 2013-2014 survey and allows comparisons across the EU. R&D intensity for a country is defined as the R&D expenditure as a percentage of Gross Domestic Product. In 2013, the R&D intensity for Ireland, at 1.1%, was below the EU28 average of 1.3%. Sweden had the highest R&D intensity in the EU with a figure of 2.3%, while Cyprus had the lowest R&D intensity at 0.1%. See Figure 8.
2015 data for the EU28 is not available at time of publication. Comparable figures for 2015 show that the R&D intensity for Ireland has decreased to 0.8%. This was not due to a fall in R&D spend but rather due to a large increase in GDP in 2015. An explanatory note can be found on the CSO website regarding the 2015 GDP figure at the following link:
| % of GDP | |
| Sweden | 2.28 |
| Finland | 2.26 |
| Austria | 2.1 |
| Slovenia | 1.99 |
| Denmark | 1.91 |
| Germany | 1.9 |
| Belgium | 1.72 |
| France | 1.45 |
| EU28 | 1.29 |
| Ireland | 1.12 |
| Netherlands | 1.09 |
| United Kingdom | 1.06 |
| Czech Republic | 1.03 |
| Hungary | 0.97 |
| Estonia | 0.82 |
| Italy | 0.72 |
| Luxembourg | 0.69 |
| Spain | 0.67 |
| Portugal | 0.63 |
| Croatia | 0.41 |
| Malta | 0.4 |
| Bulgaria | 0.39 |
| Poland | 0.38 |
| Slovakia | 0.38 |
| Greece | 0.27 |
| Lithuania | 0.24 |
| Latvia | 0.17 |
| Romania | 0.12 |
| Cyprus | 0.07 |
Researchers account for 54% of all R&D staff
Enterprises were asked to indicate the numbers of staff who devoted any of their time to R&D activities. R&D personnel includes researchers (PhD qualified and others), technicians and other support staff. In total, there were 26,336 persons engaged in R&D in Ireland in 2015. Of this total, 54% or 14,174 persons were employed as researchers, of which 2,162 were PhD qualified researchers. In addition, there were 6,942 technicians which accounted for 26% of all staff, with the remaining 20% of R&D personnel accounted for by 5,221 support staff. See Figure 9 and Table 4.
| For long labels below use to display on multiple lines | Percentage of research personnel |
|---|---|
| PhD qualified researchers | 8.2 |
| Other researchers | 45.6 |
| Technicians | 26.4 |
| Support staff | 19.8 |
30% of all researchers employed by small enterprises
The number of R&D personnel engaged in small enterprises in 2015 was 7,778 which accounted for 30% of all research personnel. The number of research personnel in medium sized enterprises was 7,553. This accounted for 29% of all R&D personnel. 11,005 R&D staff were engaged in large enterprises. This accounted for 42% of all R&D personnel. Small enterprises accounted for 799 PhD qualified researchers which equates to nearly 37% of all PhD qualified researchers; large enterprises accounted for 39% of all PhD qualified researchers with 840 persons employed as PhD researchers in these enterprises. Just one in four PhD qualified researchers or 523 persons were employed in medium sized enterprises. See Figure 10 and Table 4.
13,698 research staff were engaged in Irish owned enterprises, while 12,638 research staff were engaged in foreign owned enterprises, accounting for 52% and 48% of research staff respectively. There were more research staff engaged in the Services sector (67%) than in the Manufacturing sector (33%)
21,899 people were engaged as research staff in the Southern and Eastern (SE) region in 2015 compared to 4,438 in the Border, Midland and Western (BMW) region. The SE region accounted for 83% of all research staff, while the BMW region accounted for 17%. See Figure 10 and Table 4.
| PhD qualified researchers | |
| Small (<50) | 36.9 |
| Medium (50-249) | 24.2 |
| Large (250+) | 38.8 |
Males account for 76% of all R&D staff
The number of male research personnel in 2015 was 20,001 which accounted for 76% of all R&D staff. This compares with a 2013 figure of 77%. Research staff has the largest share of female employment with 54%, while Technicians have the lowest share of female staff at just 22%. See Figure 11 and Table 4.
| Male | Female | |
| 2009 | 73.5 | 26.5 |
| 2011 | 75.9 | 24.1 |
| 2013 | 76.9 | 23.1 |
| 2015 | 75.9 | 24.1 |
R&D active enterprises
R&D active enterprises are those enterprises who reported they either performed in-house R&D, had R&D performed on their behalf, or controlled branches engaged in R&D activity. There were nearly 1,900 enterprises engaged in R&D activities in Ireland in 2015. More than 73% of all enterprises spent less than €500,000 on R&D activities. Just over one sixth spent between €500,000 and €2m, whilst only 10% of enterprises spent €2m or more on R&D activities. See Figure 12.
| % of enterprises | |
| €0 - €99,999 | 37 |
| €100,000 - €499,999 | 36.1 |
| €500,000 - €1,999,999 | 17.1 |
| €2,000,000 - €4,999,999 | 4.8 |
| > €5,000,000 | 5 |
Small enterprises account for 71% of R&D active enterprises yet only 1% of small enterprises engage in R&D
In 2015, over 1,300 small enterprises were engaged in R&D. They accounted for 71% of all R&D active enterprises, compared with 386 medium enterprises which accounted for 21% of R&D active enterprises, and 166 large enterprises which accounted for 9% of all R&D active enterprises.
Most recent figures available from the CSO report Business In Ireland 2014 indicates that there are 514 enterprises in Ireland classified as large. Of these 514 enterprises, 32% or 166 large enterprises, consider themselves as being R&D active. In contrast, there are over 2,600 enterprises classified as medium size enterprises in Ireland, with under 15% or 386 of these medium considered to be R&D active. There are over 235,000 enterprises in Ireland classified as small enterprises. 1,323 small enterprises considered themselves to be R&D active. This accounts for less than 1% of all small enterprises. The vast majority ,97%, of small enterprises spent less than €2m on R&D activities compared to 82% of medium size enterprises and 54% of large enterprises. See Figures 13 and 14.
| For long labels below use to display on multiple lines | Enterprises engaged in R&D |
|---|---|
| Small (<50) | 1323 |
| Medium (50-249) | 386 |
| Large (250+) | 166 |
| Small (<50) | Medium (50-249) | Large (250+) | |
| €0 - €99,999 | 597 | 87 | 9 |
| €100,000 - €499,999 | 504 | 140 | 33 |
| €500,000 - €1,999,999 | 184 | 90 | 47 |
| €2,000,000 - €4,999,999 | 31 | 38 | 21 |
| >€5,000,000 | 7 | 31 | 56 |
79% of R&D active enterprises are Irish
There were 1,488 Irish owned enterprises engaged in R&D activities in 2015 which equates to 79% of all R&D active enterprises, compared to 387 foreign owned enterprises which accounts for the remaining 21% of all R&D active enterprises. Over 80% of all Irish owned enterprises spent less than €500,000 on research and development compared to 44% of all foreign owned enterprises. See Figure 15.
| Irish owned enterprises | Foreign owned enterprises | |
| €0 - €99,999 | 624 | 70 |
| €100,000 - €499,999 | 577 | 100 |
| €500,000 - €1,999,999 | 218 | 102 |
| €2,000,000 - €4,999,999 | 44 | 46 |
| >€5,000,000 | 25 | 69 |
37% of R&D active enterprises had spend of less than €100,000
694 or 37% of R&D active firms had spend of under €100,000 in 2015. This was closely followed by the spend category €100,000-€500,000, with 36% of firms.
The most popular spend category was less than €100,000 for Manufacturing sector firms, while for the Services sector the €100,000-€500,000 category was most popular. See Figure 16.
| Manufacturing sector | Services sector | |
| €0 - €99,999 | 291 | 403 |
| €100,000 - €499,999 | 241 | 437 |
| €500,000 - €1,999,999 | 129 | 191 |
| €2,000,000 - €4,999,999 | 29 | 62 |
| >€5,000,000 | 38 | 56 |
| Table 1 Total expenditure on research and development by size of enterprise, nationality of ownership, sector of activity and region, 2015 | |||
| €'000 | |||
| Total current expenditure | Total capital expenditure | Total R&D expenditure | |
| Size of enterprise | |||
| Small (<50 persons engaged) | 470,677 | 31,090 | 501,767 |
| Medium (50 - 249 persons engaged) | 465,800 | 37,480 | 503,280 |
| Large (250+ persons engaged) | 1,139,479 | 88,531 | 1,228,010 |
| Nationality of ownership | |||
| Irish owned enterprises | 750,750 | 58,912 | 809,662 |
| Foreign owned enterprises | 1,325,205 | 98,190 | 1,423,395 |
| Sector of activity | |||
| Manufacturing sector | 805,212 | 70,865 | 876,077 |
| Services sector | 1,270,743 | 86,237 | 1,356,980 |
| Region | |||
| Border, Midland and Western region | 353,651 | 30,461 | 384,112 |
| Southern and Eastern region | 1,722,304 | 126,641 | 1,848,945 |
| Total - all enterprises | 2,075,955 | 157,102 | 2,233,057 |
| Table 2 Current expenditure on research and development by size of enterprise, nationality of ownership, sector of activity and region, 2015 | |||
| €'000 | |||
| Labour costs | Other current costs | Total current expenditure | |
| Size of enterprise | |||
| Small (<50 persons engaged) | 337,729 | 132,948 | 470,677 |
| Medium (50 - 249 persons engaged) | 322,223 | 143,577 | 465,800 |
| Large (250+ persons engaged) | 690,025 | 449,453 | 1,139,478 |
| Nationality of ownership | |||
| Irish owned enterprises | 523,227 | 227,524 | 750,751 |
| Foreign owned enterprises | 826,751 | 498,454 | 1,325,205 |
| Sector of activity | |||
| Manufacturing sector | 407,104 | 398,108 | 805,212 |
| Services sector | 942,874 | 327,870 | 1,270,743 |
| Region | |||
| Border, Midland and Western region | 223,215 | 130,436 | 353,651 |
| Southern and Eastern region | 1,126,762 | 595,542 | 1,722,304 |
| Total - all enterprises | 1,349,977 | 725,978 | 2,075,955 |
| Table 3 Capital expenditure on research and development by size of enterprise, nationality of ownership, sector of activity and region, 2015 | ||||||
| €'000 | ||||||
| Land and buildings | Payments made for licences to use intellectual products | Instruments and equipment excluding software | Software purchased wholly for R&D purposes | Software development by company in-house and used in-house | Total capital expenditure | |
| Size of enterprise | ||||||
| Small (<50 persons engaged) | 5,067 | 3,629 | 14,512 | 3,673 | 4,209 | 31,090 |
| Medium (50 - 249 persons engaged) | 2,468 | 4,528 | 25,515 | 2,994 | 1,976 | 37,481 |
| Large (250+ persons engaged) | 21,374 | 4,738 | 43,427 | 6,072 | 12,921 | 88,532 |
| Nationality of ownership | ||||||
| Irish owned enterprises | 8,093 | 5,120 | 23,291 | 7,691 | 14,716 | 58,911 |
| Foreign owned enterprises | 20,815 | 7,775 | 60,163 | 5,048 | 4,389 | 98,190 |
| Sector of activity | ||||||
| Manufacturing sector | 17,025 | 3,494 | 34,675 | 3,659 | 12,010 | 70,863 |
| Services sector | 11,883 | 9,401 | 48,778 | 9,079 | 7,095 | 86,236 |
| Region | ||||||
| Border, Midland and Western region | 1,966 | 1,756 | 14,511 | 1,102 | 11,126 | 30,461 |
| Southern and Eastern region | 26,943 | 11,140 | 68,943 | 11,636 | 7,980 | 126,642 |
| Total - all enterprises | 28,909 | 12,896 | 83,454 | 12,738 | 19,106 | 157,103 |
| Table 4 Total headcount of research personnel by size of enterprise, nationality of ownership, sector of activity and region, 2015 | |||||||||||||||
| No. | |||||||||||||||
| PhD qualified researchers | Other researchers | Technicians | Support staff | All R&D staff | |||||||||||
| Male | Female | Total | Male | Female | Total | Male | Female | Total | Male | Female | Total | Male | Female | Total | |
| Size of enterprise | |||||||||||||||
| Small (<50 persons engaged) | 603 | 196 | 799 | 2,770 | 557 | 3,328 | 1,791 | 288 | 2,078 | 1,169 | 404 | 1,573 | 6,334 | 1,445 | 7,778 |
| Medium (50 - 249 persons engaged) | 373 | 150 | 523 | 2,487 | 893 | 3,380 | 1,981 | 503 | 2,484 | 767 | 399 | 1,166 | 5,607 | 1,946 | 7,553 |
| Large (250+ persons engaged) | 598 | 243 | 840 | 3,933 | 1,370 | 5,303 | 1,783 | 598 | 2,380 | 1,747 | 735 | 2,482 | 8,060 | 2,945 | 11,005 |
| Nationality of ownership | |||||||||||||||
| Irish owned enterprises | 792 | 260 | 1,052 | 4,391 | 1,315 | 5,706 | 2,876 | 688 | 3,564 | 2,477 | 899 | 3,376 | 10,537 | 3,162 | 13,698 |
| Foreign owned enterprises | 782 | 329 | 1,111 | 4,799 | 1,505 | 6,304 | 2,677 | 701 | 3,378 | 1,206 | 639 | 1,845 | 9,464 | 3,174 | 12,638 |
| Sector of activity | |||||||||||||||
| Manufacturing sector | 503 | 198 | 701 | 2,432 | 721 | 3,153 | 1,526 | 604 | 2,130 | 1,914 | 696 | 2,610 | 6,375 | 2,219 | 8,594 |
| Services sector | 1,071 | 391 | 1,462 | 6,758 | 2,100 | 8,857 | 4,028 | 784 | 4,812 | 1,769 | 842 | 2,611 | 13,626 | 4,117 | 17,743 |
| Region | |||||||||||||||
| Border, Midland and Western region | 297 | 84 | 382 | 1,549 | 590 | 2,140 | 840 | 175 | 1,015 | 663 | 239 | 902 | 3,350 | 1,088 | 4,438 |
| Southern and Eastern region | 1,277 | 505 | 1,782 | 7,641 | 2,230 | 9,871 | 4,713 | 1,214 | 5,927 | 3,019 | 1,299 | 4,318 | 16,651 | 5,248 | 21,899 |
| Total - all enterprises | 1,574 | 589 | 2,162 | 9,190 | 2,820 | 12,011 | 5,555 | 1,389 | 6,942 | 3,683 | 1,538 | 5,221 | 20,001 | 6,336 | 26,336 |
Introduction: The Business Expenditure on Research and Development (BERD) Survey 2015 - 2016 is a survey of the research and development activities of enterprises in Ireland and other EU Member States.
The BERD Survey is carried out under Commission Regulation (EC) No 995/2012 implementing Decision No 1608/2003/EC. The survey collects information about the research and development activities of enterprises across all business sectors of the economy. Most questions gather information on the spending and performance of research and development.
The BERD Survey is an On-Line Only Survey conducted by the CSO under Section 11 of the Statistics Act, 1993 to increase efficiency in the collection of statistical data and to reduce the burden on the participating enterprises. Data were collected in accordance with Section 33 of the Statistics Act, 1993 and with EU law and the survey was carried out under the agreed set of international rules as laid out in the OECD Frascati manual. Data are strictly confidential and will be used only for statistical purposes.
Survey: The BERD Survey is a targeted survey which is issued to all enterprises which are believed to be actively engaged in research and development across all business sectors of the economy. These enterprises were identified from various sources which included previous responses to the survey, other CSO data and other administrative sources.
Questionnaire: The BERD questionnaire is available from the CSO website.
Definition of Research and Development: Research and Development (R&D) is creative work undertaken on a systematic basis in order to create new or improved products, processes, services or other applications. R&D is distinguishable from other activities by the presence of an appreciable element of novelty and by the resolution of problems and uncertainties using scientific or technological means. Routine activities, such as routine software development, routine monitoring/analysis or preproduction preparation, where there is no appreciable novelty or problem resolution, are not considered to be R&D for the purpose of this survey.
Rounding of figures: Totals may not sum due to rounding.
 Hide Background Notes
Scan the QR code below to view this release online or go to
http://www.cso.ie/en/releasesandpublications/er/berd/businessexpenditureonresearchdevelopment2015-2016/
 Show Table 1 Total expenditure on research and development by size of enterprise, nationality of ownership, sector of activity and region, 2015
 Hide Table 1 Total expenditure on research and development by size of enterprise, nationality of ownership, sector of activity and region, 2015