
| 2008 | 2009 | 2010 | 2011 | % Change 2008 - 2011 | % Change 2010 - 2011 | |
| Number of enterprises | 216,265 | 206,575 | 195,431 | 189,055 | -12.6% | -3.3% |
| Persons engaged | 1,503,034 | 1,308,786 | 1,237,385 | 1,223,047 | -18.6% | -1.2% |
| Number of enterprise births | 11,954 | 13,810 | 11,237 | 11,847 | -0.9% | 5.4% |
| Number of enterprise deaths | 20,601 | 24,511 | 18,308 | .. | .. | .. |

This release provides data on the “Business Demography” of Ireland for reference year 2011 and other years. The detailed tables provided with this release present a detailed breakdown of the numbers of active enterprises and newly birthed and ceased enterprises, classified by economic activity, employment size and legal form. Related employment data is also outlined. A detailed county level breakdown is also provided in relation to active enterprises and employment only.
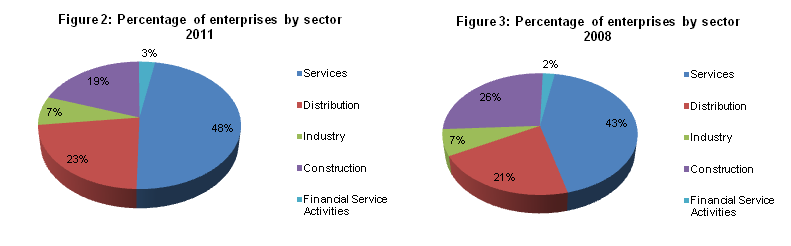
There were over 189,000 active enterprises in the private business economy1 in Ireland in 2011, with nearly 1.22 million person’s engaged2. This represents a decrease of 3.3% and 1.2% respectively from 2010. See summary table. The services sector3 accounts for almost half (48%) of all enterprises in 2011, with the construction sector accounting for a fifth (19%) of enterprises. In 2008 construction accounted for 26% of total enterprises, by 2011 it accounted for 19%. See figures 1 - 3 and summary table.
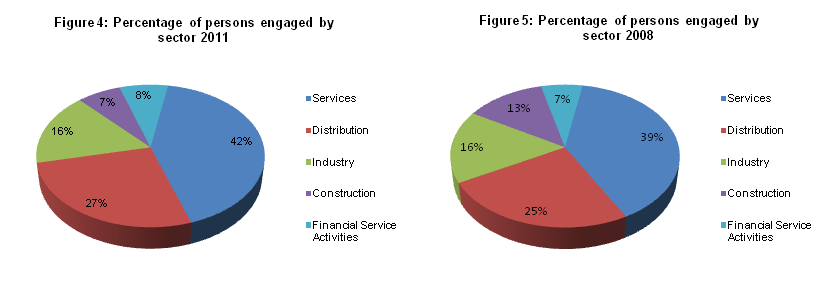
When comparing the trend for the number of persons engaged in the private business economy to the number of enterprises we see a similar situation in relation to the services sector and the construction sector. In 2011 the services sector accounted for 42% of all persons engaged while in 2008 it accounted for 39%. Construction accounted for 7% of all persons engaged in 2011, down from 13% in 2008. See figures 4 & 5.
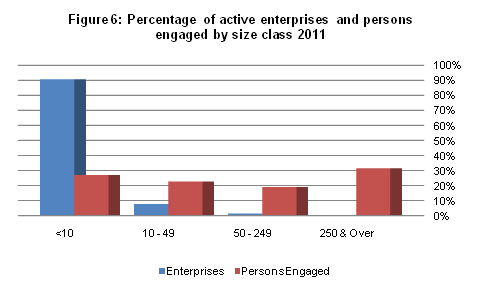
Small and medium sized enterprises4 accounted for nearly 99.8% of the total enterprise population for 2011. They also accounted for 68.6% of total persons engaged, with large enterprises (employing 250 or more persons), despite accounting for only a small fraction of total enterprise numbers, employing over 30% of persons engaged. See figure 6.
This Business Demography release relates to reference year 2011, however data on enterprise deaths5 are up to reference year 2010. All enterprise births6 were followed for 5 years (2006 to 2011) to assess their survival rate and the resulting effect on employment.
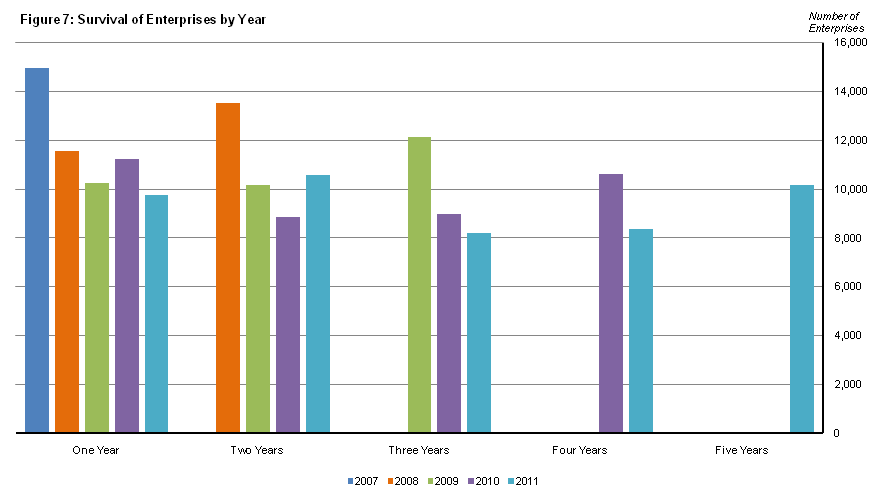
Over 30% of all enterprises that were active during 2011 began trading in the period 2006 – 2011 inclusive. These enterprises accounted for nearly 10% of persons engaged in the private business economy in 2011. The one year survival rate (enterprises which have survived one year to reference year, e.g. enterprise was born in 2010 and was still in operation in 2011) for enterprises to 2011 has decreased since 2007, highlighting the difficulties of staying in business over the period. Of the 16,696 enterprises which were enterprise births in 2006, 10,188 or 61% have survived to reference year 2011. See figure 7.
During 2011, over 11,800 enterprise births occurred, an increase of over 5% on 2010. There were over 10,600 persons engaged in these newly birthed enterprises.
Sector D7 “Electricity, Gas, Steam and Air Conditioning Supply” had the highest enterprise birth rate of 10.97% (34 enterprises), albeit a sector with a relatively few number of enterprises. The second highest was 10.62% in sector J “Information and Communication” (1,068 enterprises).The number of births in sector F “Construction” increased from 1,818 to 1,976, but is still below 2009 birth levels and less than 35% of the 2006 peak (5,717).
Small decreases in the number of births were recorded in sectors D “Electricity, gas, steam and air conditioning supply”, G “Wholesale and retail trade; repair of motor vehicles and motorcycles” and L “Real estate activities” with increases observed in all other sectors. See figure 8.

Over 18,000 enterprises ceased during 20108, resulting in a loss of nearly 25,000 jobs. This represents 25% less deaths than 2009. The sector with the largest reduction in the number of enterprises was sector F “Construction” with over 12.75% of enterprises ceasing. This was followed by sector L “Real Estate Activities” at almost 10.1%. In comparison with 2009 figures, the number of deaths decreased in all sectors. See figure 9.
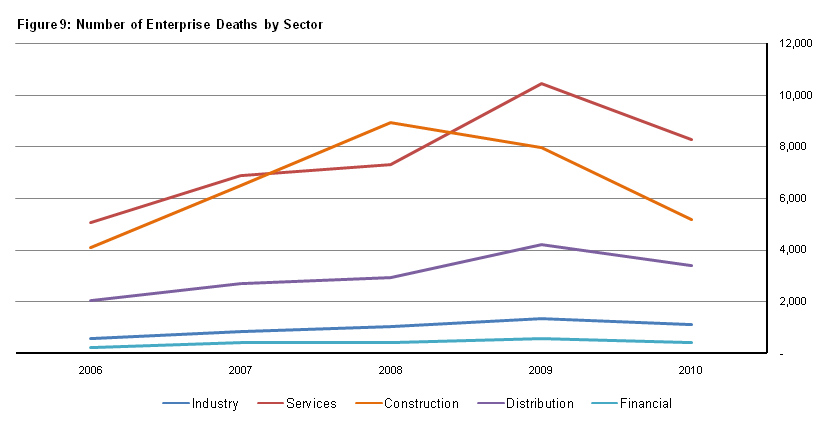
In terms of employment, sector F “Construction” had the most persons engaged in ceased enterprises, with a loss of 6,207 jobs. The second highest was sector G “Wholesale and Retail Trade, Repair of Motor Vehicles and Motor Cycles” with a loss of just over 5,000 jobs. As can be seen from figure 10, the number of persons engaged from enterprise births overall remained relatively steady in 2010 and 2011, while the number of persons engaged in enterprises which ceased decreased in 2010 overall.

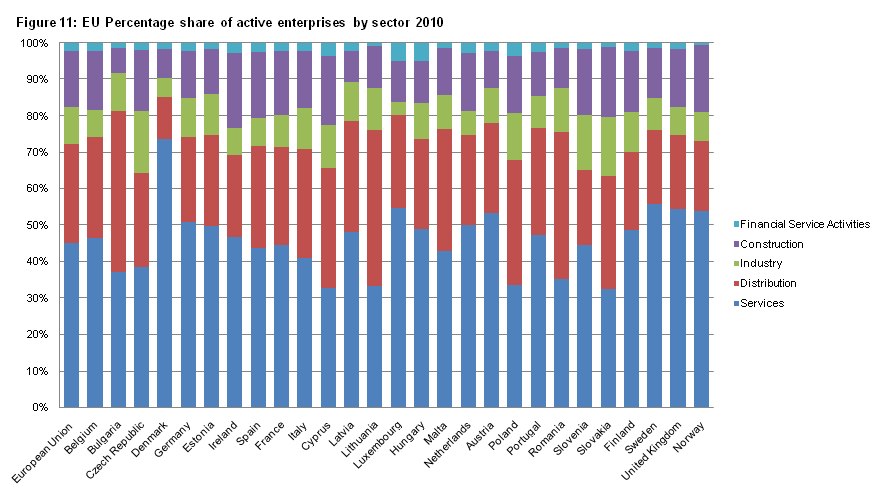
In EU terms9 (latest data available for 2010), Ireland’s largest sector of active enterprises, the services sector at 47%, is higher than the EU average (45%) but lower than Germany (51%) and the UK (55%). Denmark has the largest reliance on the services sector at nearly 74%. In 2010, Ireland had the largest percentage share of active enterprises in the EU for sector F “Construction” at over 20%. This compares to 15% for the EU average, the UK at 16% and Germany at 13%. Bulgaria had the smallest percentage of active enterprises in construction at nearly 7% followed closely by Denmark at 8%. See figure 11.
| Table 1: Active Enterprises (Number) by Activity and Year | |||||||
| Number of Enterprises | |||||||
| 2006 | 2007 | 2008 | 2009 | 2010 | 2011 | ||
| Business economy excluding activities of holding companies (B to N,ex K-64.2) | 211,950 | 216,198 | 216,265 | 206,575 | 195,431 | 189,055 | |
| Mining and quarrying (B) | .. | .. | 407 | 397 | 381 | 354 | |
| Manufacturing (C) | 13,393 | 13,583 | 13,697 | 13,363 | 12,790 | 12,290 | |
| Electricity, gas, steam and air conditioning supply (D) | .. | .. | 221 | 301 | 310 | 325 | |
| Water supply, sewerage, waste management and remediation activities (E) | 751 | 800 | 829 | 862 | 825 | 853 | |
| Construction (F) | 61,194 | 61,082 | 57,042 | 46,655 | 40,459 | 36,747 | |
| Wholesale and retail trade, repair of motor vehicles and motorcycles (G) | 44,225 | 44,834 | 45,732 | 45,347 | 43,981 | 42,966 | |
| Transportation and storage (H) | 11,758 | 11,990 | 11,926 | 11,306 | 10,572 | 10,171 | |
| Accommodation and food service activities (I) | 16,494 | 16,361 | 16,905 | 16,822 | 16,511 | 16,340 | |
| Information and communication (J) | 9,310 | 9,696 | 10,137 | 10,076 | 10,057 | 10,297 | |
| Financial and insurance activities excluding activities of holding companies (K-642)10 | 4,169 | 4,747 | 4,901 | 5,271 | 5,282 | 5,454 | |
| Real estate activities (L) | 10,182 | 10,668 | 10,853 | 12,075 | 11,673 | 11,423 | |
| Professional, scientific and technical activities (M) | 28,547 | 29,709 | 31,078 | 31,718 | 30,801 | 30,440 | |
| Administrative and support service activities (N) | 11,406 | 12,150 | 12,537 | 12,382 | 11,789 | 11,395 | |
| Education (P) | 4,734 | 5,094 | 5,408 | 6,933 | 7,154 | 7,424 | |
| Arts, Entertainment & Recreation (R) | .. | .. | .. | .. | .. | 4,878 | |
| .. indicates that the data has been suppressed to protect the confidentiality of individual enterprises or that it is not available for the years in question. | |||||||
| Table 2: Persons Engaged (Number) by Activity and Year | |||||||
| Number of Persons Engaged | |||||||
| 2006 | 2007 | 2008 | 2009 | 2010 | 2011 | ||
| Business economy excluding activities of holding companies (B to N,ex K-64.2) | 1,443,072 | 1,528,295 | 1,503,034 | 1,308,786 | 1,237,385 | 1,223,047 | |
| Mining and quarrying (B) | .. | .. | 7,563 | 6,208 | 5,173 | 4,234 | |
| Manufacturing (C) | 225,101 | 229,912 | 222,412 | 193,027 | 181,156 | 181,257 | |
| Electricity, gas, steam and air conditioning supply (D) | .. | .. | 9,546 | 9,911 | 9,460 | 9,086 | |
| Water supply, sewerage, waste management and remediation activities (E) | 6,701 | 7,874 | 8,092 | 7,814 | 7,753 | 7,935 | |
| Construction (F) | 223,924 | 229,525 | 190,364 | 126,147 | 98,445 | 85,306 | |
| Wholesale and retail trade, repair of motor vehicles and motorcycles (G) | 339,588 | 370,601 | 375,361 | 341,205 | 329,917 | 326,303 | |
| Transportation and storage (H) | 83,663 | 84,405 | 89,875 | 82,428 | 78,156 | 78,133 | |
| Accommodation and food service activities (I) | 157,004 | 165,005 | 165,219 | 150,083 | 145,035 | 146,024 | |
| Information and communication (J) | 65,354 | 69,372 | 71,294 | 67,378 | 66,671 | 67,324 | |
| Financial and insurance activities excluding activities of holding companies (K-642)10 | 85,188 | 94,981 | 98,904 | 93,523 | 94,326 | 94,328 | |
| Real estate activities (L) | 22,630 | 23,849 | 23,549 | 22,274 | 21,584 | 22,244 | |
| Professional, scientific and technical activities (M) | 111,231 | 120,020 | 122,973 | 108,949 | 103,526 | 103,386 | |
| Administrative and support service activities (N) | 105,668 | 115,376 | 117,882 | 99,839 | 96,183 | 97,487 | |
| Education (P) | 127,145 | 135,111 | 142,385 | 148,587 | 145,148 | 139,705 | |
| Arts, Entertainment & Recreation (R) | .. | .. | .. | .. | .. | 31,359 | |
| .. indicates that the data has been suppressed to protect the confidentiality of individual enterprises or that it is not available for the years in question. | |||||||
| Table 3: Persons Engaged (Number) by Persons Engaged and Year | |||||||
| Number of Persons Engaged | |||||||
| 2006 | 2007 | 2008 | 2009 | 2010 | 2011 | ||
| Business economy excluding activities of holding companies (B to N,ex K-64.2) | |||||||
| All persons engaged size classes | 1,443,072 | 1,528,295 | 1,503,034 | 1,308,786 | 1,237,385 | 1,223,047 | |
| Under 10 | 393,908 | 409,066 | 398,805 | 356,219 | 336,581 | 329,639 | |
| 10-19 | 164,131 | 169,149 | 161,923 | 139,130 | 130,962 | 127,156 | |
| 20 - 49 | 200,365 | 208,575 | 201,188 | 167,025 | 154,477 | 149,565 | |
| 50 - 249 | 286,847 | 306,014 | 295,933 | 245,282 | 232,498 | 232,469 | |
| 250 and over | 397,821 | 435,491 | 445,185 | 401,130 | 382,867 | 384,218 | |
| .. indicates that the data has been suppressed to protect the confidentiality of individual enterprises or that it is not available for the years in question. | |||||||
| Table 4: Enterprise Births (Number) by Activity and Year | |||||||
| Number of Enterprise Births | |||||||
| 2006 | 2007 | 2008 | 2009 | 2010 | 2011 | ||
| Business economy excluding activities of holding companies (B to N,ex K-64.2) | 16,696 | 13,461 | 11,954 | 13,810 | 11,237 | 11,847 | |
| Mining and quarrying (B) | .. | 16 | 21 | 21 | .. | 23 | |
| Manufacturing (C) | 764 | 576 | 540 | 678 | 590 | 604 | |
| Electricity, gas, steam and air conditioning supply (D) | .. | 26 | 33 | 44 | 38 | 34 | |
| Water supply, sewerage, waste management and remediation activities (E) | 59 | 54 | 53 | 71 | .. | 64 | |
| Construction (F) | 5,717 | 3,824 | 2,489 | 2,278 | 1,818 | 1,976 | |
| Wholesale and retail trade, repair of motor vehicles and motorcycles (G) | 2,553 | 2,202 | 2,298 | 3,012 | 2,413 | 2,335 | |
| Transportation and storage (H) | 822 | 658 | 583 | 762 | 494 | 545 | |
| Accommodation and food service activities (I) | 1,060 | 913 | 1,115 | 1,363 | 1,202 | 1,278 | |
| Information and communication (J) | 930 | 879 | 864 | 936 | 928 | 1,068 | |
| Financial and insurance activities excluding activities of holding companies (K-642)10 | 390 | 487 | 325 | 449 | 370 | 372 | |
| Real estate activities (L) | 1,209 | 958 | 700 | 862 | 687 | 663 | |
| Professional, scientific and technical activities (M) | 2,293 | 1,930 | 2,133 | 2,568 | 1,955 | 2,137 | |
| Administrative and support service activities (N) | 860 | 937 | 799 | 765 | 678 | 749 | |
| Education (P) | .. | .. | .. | .. | 378 | 328 | |
| Arts, Entertainment & Recreation (R) | .. | .. | .. | .. | .. | 333 | |
| .. indicates that the data has been suppressed to protect the confidentiality of individual enterprises or that it is not available for the years in question. | |||||||
| Table 5: Preliminary Enterprise Deaths (Number) by Activity and Year | |||||||
| Number of Enterprise Deaths | |||||||
| 2006 | 2007 | 2008 | 2009 | 2010 | 2011 | ||
| Business economy excluding activities of holding companies (B to N,ex K-64.2) | 11,939 | 17,263 | 20,601 | 24,511 | 18,308 | .. | |
| Mining and quarrying (B) | .. | 18 | 27 | 31 | .. | .. | |
| Manufacturing (C) | 526 | 736 | 924 | 1,177 | 951 | .. | |
| Electricity, gas, steam and air conditioning supply (D) | .. | 19 | 19 | 39 | .. | .. | |
| Water supply, sewerage, waste management and remediation activities (E) | 28 | 56 | 51 | 92 | 68 | .. | |
| Construction (F) | 4,076 | 6,477 | 8,923 | 7,956 | 5,162 | .. | |
| Wholesale and retail trade, repair of motor vehicles and motorcycles (G) | 2,038 | 2,714 | 2,948 | 4,217 | 3,382 | .. | |
| Transportation and storage (H) | 609 | 902 | 993 | 1,349 | 960 | .. | |
| Accommodation and food service activities (I) | 1,007 | 1,170 | 1,187 | 1,741 | 1,411 | .. | |
| Information and communication (J) | 671 | 861 | 965 | 1,236 | 1,008 | .. | |
| Financial and insurance activities excluding activities of holding companies (K-642)10 | 202 | 379 | 383 | 549 | 389 | .. | |
| Real estate activities (L) | 804 | 1,097 | 924 | 1,405 | 1,178 | .. | |
| Professional, scientific and technical activities (M) | 1,413 | 1,976 | 2,214 | 3,323 | 2,705 | .. | |
| Administrative and support service activities (N) | 554 | 858 | 1,042 | 1,396 | 1,027 | .. | |
| Education (P) | 166 | 238 | 381 | 562 | 405 | .. | |
| Arts, Entertainment & Recreation (R) | .. | .. | .. | .. | 430 | .. | |
| .. indicates that the data has been suppressed to protect the confidentiality of individual enterprises or that it is not available for the years in question. | |||||||
This release covers the reference year 2011, however data on enterprise deaths relates to 2010. Statistics are also provided on enterprise births since 2006 that were still active during 2010. All 2011 enterprise births will be followed for 5 years to assess their survival rate and the resulting effect on employment.
Detailed data tables are available on CSO’s data dissemination service at:
The Background Notes at the link below provide more details on the release:
http://www.cso.ie/en/surveysandmethodology/multi-sectoral/businessdemography/backgroundnotes/
For further information on the NACE Rev. 2 classification of economic activity, see this link:
http://www.cso.ie/en/surveysandmethodology/classifications/classificationofindustrialactivity/
Footnotes:
1 The private business economy covers the NACE Rev 2 sectors B - N (excluding 64.20 Activities of holding companies). For comparison with previous Business Demography releases only sectors B – N (excluding 64.20 Activities of holding companies) figures are included in the release text. Sectors P & R are an extension of the coverage in recent years.
The full list of Rev 2 sectors covered is:
B – Mining and Quarrying
C – Manufacturing
D – Electricity, Gas, Steam and Air Conditioning Supply
E – Water Supply; Sewerage, Waste management and Remediation Activities
F – Construction
G – Wholesale and Retail Trade; Repair of Motor Vehicles and Motorcycles
H – Transportation and Storage
I – Accommodation and Food Service Activities
J – Information and Communication
K – Financial and Insurance Activities (excludes NACE code 64.20
Activities of holding companies)
L – Real Estate Activities
M – Professional, Scientific and Technical Activities
N – Administrative and Support Service Activities
P – Education
R – Arts, Entertainment and Recreation
2 Persons engaged includes employees, working proprietors and family members.
3 The composition of sectors used in the graph is as follows:
- Services: Sectors H,I,J,L,M,N
- Distribution: Sector G
- Industry: Sectors B,C,D,E
- Construction: Sector F
- Financial Service Activities: Sector K excluding 64.20, Activities of holding companies.
4 Small and Medium Enterprises are defined as enterprises with less than 250 persons engaged. The persons engaged breakdown provided in the figures are;
Less than 10: Micro Enterprises
10 – 49: Small Enterprises
50 – 249: Medium Enterprises
250+: Large Enterprises.
5 Enterprise Deaths: An enterprise death amounts to the dissolution of a combination of production factors with the restriction that no other enterprises are involved in the event. Deaths do not include exits from the population due to mergers, takeovers, break-ups or restructuring of a set of enterprises. It does not include exits from a sub-population resulting only from a change of activity.
An enterprise is included in the count of deaths only if it is not reactivated within two years.
The population of enterprise deaths in 2010 contains all enterprises that ceased at some point during the year 2010.
6 Enterprise Births: An enterprise birth amounts to the creation of a combination of production factors with the restriction that no other enterprises are involved in the event. Births do not include entries into the population due to mergers, break-ups, split-off or restructuring of a set of enterprises. It does not include entries into a sub-population resulting only from a change of activity.
A birth occurs when and enterprise starts from scratch and actually starts activity. An enterprise creation can be considered an enterprise birth if new production factors, in particular new jobs, is created. If a dormant unit is reactivated within two years, this event is not considered a birth.
The population of enterprise births in 2011 contains all enterprises that started at some stage during the year 2011.
7 Sectors refer to NACE Rev 2 sectors which are described in footnote 1. These NACE Rev2 Sectors provide a detailed breakdown of the sector analysis provided in footnote 3.
8 Population, births and survival data in this release relates to 2011, but the latest deaths data available is for 2010.
9 Business Demography figures at an EU level are available at the following link. Latest data available is for 2010.
10 NACE coded 64.20, Activities of holding companies is excluded from sector K
 Hide Background Notes
When comparing the trend for the number of persons engaged in the private business economy to the number of active enterprises, we see different patterns emerging in the services and construction sectors. In 2012 the services sector accounted for 43% of all persons engaged while in 2008 and 2009 it accounted for over 39% and 41% respectively. Construction accounted for 6.3% of all persons engaged in 2012, down from 12.7% in 2008 and 9.6% in 2009. See figures 4 & 5.
| For long labels below use to display on multiple lines | Percentage of Enterprises by Sector 2012 |
|---|---|
| Services | 48.6 |
| Distribution | 22.8 |
| Industry | 7.3 |
| Construction | 18.3 |
| Financial Service Activities | 3 |
| For long labels below use to display on multiple lines | Percentage of Enterprises by Sector 2008 |
|---|---|
| Services | 43.2 |
| Distribution | 21.1 |
| Industry | 7 |
| Construction | 26.4 |
| Financial Service Activities | 2.3 |
Scan the QR code below to view this release online or go to
http://www.cso.ie/en/releasesandpublications/er/bd/businessdemography2011/
 Show Table 1 Active Enterprises (Number) by Activity and Year
 Hide Table 1 Active Enterprises (Number) by Activity and Year