
| Small and medium sized enterprises applying for different types of finance, 2014 | ||||
| % | ||||
| Size of Enterprise | Bank finance | Equity finance | Other types of finance | |
| Micro (1-9 Persons employed) | 20.0 | 1.7 | 5.0 | |
| Small (10-49 Persons employed) | 35.0 | 2.5 | 8.0 | |
| Medium (50-249 Persons employed) | 39.8 | 4.7 | 9.1 | |
| All SMEs (Under 250 Persons employed) | 21.4 | 1.8 | 5.3 | |
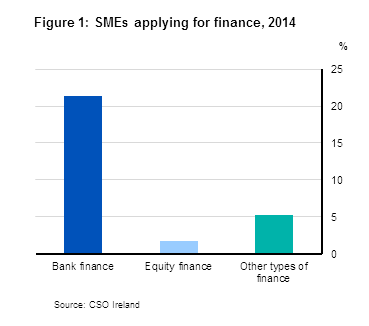
Results from the 2014 Access to Finance survey show that bank finance was the most popular type of finance sought. Over a fifth of all small and medium sized enterprises (SMEs) applied for such finance in 2014. While 20% of micro sized enterprises applied for bank finance, the rate rose to 35% for small sized enterprises and increased again to 39.8% for medium sized enterprises.
Relatively few SMEs looked for finance from non-bank sources, for example only 4.7% of medium sized enterprises looked for equity finance compared to 39.8% of similar sized enterprises who looked for bank finance. Exporting SMEs generally made more applications for bank finance than non-exporting SMEs. See Headline table, Table 1 and Figures 1 & 2.
| Size of Enterprise | Bank finance | Equity finance | Other types of finance |
|---|---|---|---|
| Micro (1-9) | 20 | 1.7 | 5 |
| Small (10-49) | 35 | 2.5 | 8 |
| Medium (50-249) | 39.8 | 4.7 | 9.1 |
| 0 | 0 | 0 | |
| All SMEs (Under 250) | 21.4 | 1.8 | 5.3 |
The Access to Finance survey was first carried out for reference year 2010. The most recent survey was carried out for reference year 2014 for all SMEs. There are significant methodological differences between the 2010 and 2014 surveys and the results are not comparable. Please see background notes for more detailed explanation.
Larger SMEs were more successful when applying for bank finance in 2014
Over 70% of SME bank finance applications were successful. Applications from larger SMEs were more successful than smaller SMEs when applying for bank finance. Almost 92% of medium sized enterprises were successful compared to just under 70% of micro sized enterprises. Exporting SMEs were noticably more successful than non-exporting SMEs when applying for bank finance. Almost 95% of exporting SMEs were successful compared to 67% for non-exporting enterprises. See Figure 3 and Table 2.
| Size of Enterprise | Bank finance |
|---|---|
| Micro (1-9) | 69.5 |
| Small (10-49) | 74.4 |
| Medium (50-249) | 91.6 |
| 0 | |
| All SMEs (Under 250) | 70.6 |
Information and Communications (ICT) sector less likely to look for bank finance than other sectors but more likely to be successful
Over a fifth of SMEs in the Industry, Construction and Selected Services sectors applied for bank finance in 2014. This was in contrast with the ICT sector where only 12.5% of SMEs applied for bank finance. However, the ICT sector had the highest rate of applications for equity finance at 3.9%.
The use of finance types other than bank and equity finance was most prevalent in the Construction sector, with 8% of SMEs in this sector applying for other types of finance, such as loans from sources other than banks, leasing, factoring, etc. See Figure 4 and Table 3.
| NACE Sector | Bank finance | Equity finance | Other types of finance |
|---|---|---|---|
| Industry (NACE 05-39) | 23 | 2.9 | 6 |
| Construction (NACE 41-43) | 22.3 | 0.8 | 7.98131679538186 |
| Selected services (NACE 45-56, 68, 77-82) | 23.7 | 2 | 5.14564547587416 |
| Information and communications (NACE 58-63) | 12.5 | 3.9 | 3.70512163892446 |
| Professional, scientific and technical activities (NACE 69-75) | 16.3 | 1.3 | 2.92516370439663 |
| 0 | 0 | 0 | |
| All economic sectors (05-82, excl. 64-66) | 21.4 | 1.822096852056 | 5.26249198423506 |
Looking at the success rates of bank finance applications for individual NACE sectors, the ICT sector reported the highest success rate with 84.3% of all applications approved, followed by the Construction sector where 73% of bank finance applications were successful.
The sector with the highest rate of unsuccessful bank finance applications was the Selected Services sector (retail, accommodation, food and professional services sectors) where 31.6% of applications did not succeed and a further 6.6% of applications were only partially successful. See Figure 5 and Table 4.
| NACE Sector | Successful | Partially successful | Unsuccessful |
|---|---|---|---|
| Industry (NACE 05-39) | 65.4 | 4.9 | 29.7 |
| Construction (NACE 41-43) | 73 | 0 | 27 |
| Selected services (NACE 45-56, 68, 77-82) | 61.8 | 6.6 | 31.6 |
| Information and communications (NACE 58-63) | 84.3 | 0 | 15.7 |
| Professional, scientific and technical activities (NACE 69-75) | 67 | 6.8 | 26.2 |
| 0 | 0 | 0 | |
| All economic sectors (NACE 05-82 excl. 64-66 ) | 65.5 | 5.1 | 29.4 |
Higher growth enterprises more successful in bank finance applications than lower growth enterprises
Using increases in employment over time as a proxy for enterprise growth, it is possible to analyse the financial application experience by enterprise growth type. Enterprises classed as “high-potential start-ups” are SMEs established between 2010 and 2014 whose employment increased by at least 20% per annum over that period. SMEs classed as “other high growth” are enterprises established prior to 2010 whose employment increased by at least 20% per annum between 2010 and 2014. The remaining SMEs were classed as “other” enterprises.
There was little difference in bank application rates between the three growth types (high-potential start-ups, other high growth, and other enterprises) – approximately 20% - there was however a marked difference in success rates by type of growth enterprise. Bank finance applications from SMEs which experienced more employment growth were more successful when applying for finance. Applications from high-potential start ups and other high growth enterprises achieved success rates of over 70%, compared to lower employment growth SMEs who recorded a success rate of 47.3%. See Figure 6 and Tables 5 & 6.
| Growth group | Successful | Partially successful | Unsuccessful |
|---|---|---|---|
| High potential start-ups | 70.9 | 4.5 | 24.6 |
| Other high growth | 75 | 4 | 21 |
| Other enterprises | 47.3 | 7.2 | 45.5 |
| 0 | 0 | 0 | |
| All growth types | 65.5 | 5.1 | 29.4 |
New lending was the main type of finance sought from banks
The main type of finance that SMEs sought from banks in 2014 was new lending, which amounted to 57.1% of all applications. Nearly 31% of all SME applications for bank finance were for renewals of existing facilities, while 12.2% of applications were for debt restructuring purposes. When analysing by enterprise size class, approximately 16% of small and 20% of medium size enterprises indicated debt restructuring as the reason for applying for bank finance. See Table 7.
Working capital the main reason for majority of all finance applications
More than half, 50.1%, of all applications for bank finance indicated that the finance was to be used as working capital. Nearly 40% of applications for other types of finance and over a third of applications for equity finance specified the need for working capital. Other reasons for seeking finance included investment in property, intangibles and export growth. See Figure 7 and Table 8.
| Reason | Bank finance | Equity finance | Other finance types |
|---|---|---|---|
| Working capital | 50.1 | 33.4 | 39.3 |
| Investment (intangibles) | 14 | 23.4 | 23.1 |
| Investment (property) | 13.2 | 11 | 4.3 |
| Other finance | 11.7 | 8.4 | 9.8 |
| Investment (other) | 10.1 | 16.5 | 20.6 |
| Export growth | 1 | 7.3 | 3 |
If not applying for bank finance, 80% of SMEs indicated not needing the finance as the main reason
For SMEs not looking for bank finance, 80% of these enterprises indicated that their business did not need bank finance. Just under 7% of these SMEs did not apply for bank finance because they felt they would have loan repayment difficulties, while approximately 6% of those who did not apply believed that the banks were not lending. See Figure 8 and Table 9.
| Reasons | Reasons |
|---|---|
| The business did not need it | 80.000370165525 |
| The business was unable to repay the debts | 6.82587197116489 |
| Belief the banks were not lending | 6.18951214743457 |
| An informal approach to the bank was rejected | 2.41980944745116 |
| The cost of credit was too high | 2.40197061948973 |
| The bank lending terms and conditions were too strict | 2.16246564893462 |
In relation to SMEs who did not look for equity finance, over 81% of these enterprises indicated that their business did not need it. Just over 6% of these SMEs did not apply for equity finance as it was not relevant to the business, with a further 5% not applying due to probable rejection. See Figure 9 and Table 10.
| Reasons | Reasons |
|---|---|
| The business did not need it | 81.2741700980704 |
| Not relevant to the business | 6.05948788809692 |
| Probable rejection | 5.03228528172471 |
| Unfamiliar with the product | 4.45648787756975 |
| The director/owner did not want to cede control | 1.75842787969858 |
| Equity was too expensive a form of financing | 1.41914097483966 |
Existing relationship with a bank was the main reason SMEs chose a bank for a loan
When asked about the reason for choosing a particular bank for a loan, over 45% of SMEs indicated the enterprise already being a client of the bank was the main reason, with a further 21.5% of SMEs indicating that the branch was local to them. Only 8.9% of SMEs primarily selected their bank based on the interest related terms offered. See Figure 10 and Table 11.
| Reasons | |
| Business already a client | 45.2 |
| Bank branch local | 21.5 |
| Bank branch known for good client relationships | 9.5 |
| Bank offered best interest related terms | 8.9 |
| Bank's knowledge of the sector | 5.3 |
| Other reasons | 3.4 |
| Bank's emphasis on SMEs | 3.4 |
| Bank offered best non-interest related terms | 2.8 |
Three-quarters of loan applications required collateral
SMEs reported that collateral was requested in 73.6% of bank finance applications. When collateral was required, the personal guarantee of the owner/director of the SMEs accounted for 53.9% of cases. A further 16.5% of applications had to provide collateral in the form of a property of the business. See Figure 11 and Table 12.
| Type of collateral | Type of collateral |
|---|---|
| Personal guarantee of an owner/director of the business | 53.9 |
| Property of the business | 16.5 |
| Current assets of the business | 12.4 |
| Other fixed assets of the business | 7.2 |
| Other types of collateral | 5.5 |
| Personal guarantee of other individuals | 4.5 |
In almost 18% of unsuccessful bank finance applications, SMEs indicated they received no reason from the bank
SMEs indicated that they had not received any explanation for the refusal from their bank in 17.6% of cases. Lack of own capital was given as the reason in almost 17% of applications, while nearly 16% of SMEs reported that they were refused as the enterprise already had too much debt. See Figure 12 and Table 13.
| Reasons given, if any | |
| No reason given | 17.6 |
| Lack of own capital | 16.8 |
| Too many loans/debt | 15.9 |
| Insufficient or risky potential | 12.6 |
| Other reason | 11.6 |
| Bank seemed unfamiliar with business' sector | 11.5 |
| Insufficient collateral or guarantee | 10.4 |
| No loan history | 2.4 |
| Risky export proposal plan | 1.2 |
When unsuccessful, over 40% of SMEs forgo the additional finance
Following a bank finance application refusal, 41.7% of SMEs decided to forego the funds applied for and continue to operate without the additional finance, while 16.1% of SMEs applied for alternative financing. See Figure 13 and Table 14.
| Action | |
| Forego the funds applied for | 41.683387393796 |
| Applied for alternative financing | 16.0927494545628 |
| Sought informal finance from friends and family | 10.3122104479093 |
| New application at new bank | 9.37700954788958 |
| New application at State entity (e.g. Microfinance Ireland) | 8.9378246688394 |
| Re-applied at the same bank | 8.64954515756144 |
| Applied for trade credit facilities with suppliers | 4.50473786152532 |
| Appealed through banks official appeals process | 0.242917692784507 |
| Credit review office | 0.199617775131672 |
1 in 7 of SMEs indicate they have outstanding property debt of an owner/director
When looking at credit exposures, 14.5% of SMEs indicated that they carry outstanding property debts of the owner or director. Of these SMEs, 38.8% identified it as a major obstacle to business performance, 35.5% cited this as a minor obstacle, while the remaining 25.7% reported that this debt was no obstacle to business performance.
When asked about business debt relating to property purchase, 8.8% of SMEs reported that they had such debt, and 8.5% of SMEs carried debts of the owner relating to the purchase of business premises. Around three-quarters of these SMEs view this debt as being an obstacle, either minor or major, to business performance. See Figures 14 & 15 and Table 16.
| Outstanding business debt related to property purchase | Outstanding debt of owner/director relating to purchase of business premises | Outstanding property debts of owner/director | |
| Micro (1-9) | 7.7 | 7.7 | 14.3 |
| Small (10-49) | 19.3 | 16.4 | 16.5 |
| Medium (50-249) | 24.8 | 19 | 14.3 |
| 0 | 0 | 0 | |
| All SMEs (Under 250) | 8.8 | 8.5 | 14.5 |
| Exposure type | Major obstacle | Minor obstacle | No obstacle |
|---|---|---|---|
| Outstanding business debt related to property purchase | 41.7 | 34.7 | 23.6 |
| Outstanding debt of owner/director relating to purchase of business premises | 41 | 34 | 25.0094527096905 |
| Outstanding property debts of owner/director | 38.8 | 35.5 | 25.7 |
Almost half of SMEs expect to seek bank finance in the period 2015-17
When asked about their future finance options, 47.7% of SMEs said that they expect to seek bank finance in the period 2015-17, with a further 10.7% stating that they expect to seek finance from their owners/directors.
When asked about the purpose of any future financing 36.5% of SMEs indicated that the need for working capital will continue to be the main reason, with 17.9% of SMEs expecting to finance other investments. See Tables 17 & 18.
| Table 1 Enterprises applications for finance, by number of persons engaged and type of finance, 2014 | ||||
| % | ||||
| Number of persons engaged | Type of finance | Exporter | Non-exporter | All enterprises |
| Micro (1-9) | Bank finance | 22.6 | 20.1 | 20.0 |
| Equity finance | 2.2 | 1.7 | 1.7 | |
| Other finance types | 2.9 | 5.3 | 5.0 | |
| Small (10-49) | Bank finance | 49.3 | 32.5 | 35.0 |
| Equity finance | 3.4 | 2.3 | 2.5 | |
| Other finance types | 15.7 | 7.0 | 8.0 | |
| Medium (50-249) | Bank finance | 42.1 | 39.6 | 39.8 |
| Equity finance | 9.4 | 3.6 | 4.7 | |
| Other finance types | 10.0 | 8.9 | 9.1 | |
| All SMEs (Under 250) | Bank finance | 26.1 | 21.2 | 21.4 |
| Equity finance | 2.5 | 1.8 | 1.8 | |
| Other finance types | 4.5 | 5.4 | 5.3 | |
| Table 2 Success rates of finance applications by number of persons engaged and type of finance, 2014 | ||||
| % | ||||
| Number of persons engaged | Type of finance | Exporter | Non-exporter | All enterprises |
| Micro (1-9) | Bank finance | : | 66.0 | 69.5 |
| Equity finance | : | 28.7 | 33.6 | |
| Other finance types | : | 62.5 | 64.6 | |
| Small (10-49) | Bank finance | 85.4 | 70.8 | 74.4 |
| Equity finance | : | 16.4 | 20.4 | |
| Other finance types | : | 45.4 | 50.8 | |
| Medium (50-249) | Bank finance | 92.8 | 91.1 | 91.6 |
| Equity finance | : | : | : | |
| Other finance types | : | : | : | |
| All SMEs (Under 250) | Bank finance | 94.7 | 67.0 | 70.6 |
| Equity finance | : | 27.5 | 32.1 | |
| Other finance types | : | 60.1 | 62.3 | |
| Note 1: The success rates in this table reflect the share of finance product applications made by enterprises that were fully or partially successful | ||||
| Note 2: No exporter breakdown given due to small number of responses per category when broken down | ||||
| Table 3 Enterprises applications for finance by NACE sector and type of finance, 2014 | |||
| % | |||
| NACE Sector | Bank finance | Equity finance | Other types of finance |
| Industry (NACE 05-39) | 23.0 | 2.9 | 6.0 |
| Construction (NACE 41-43) | 22.3 | 0.8 | 8.0 |
| Selected services (NACE 45-56, 68, 77-82) | 23.7 | 2.0 | 5.1 |
| Information and communications (NACE 58-63) | 12.5 | 3.9 | 3.7 |
| Professional, scientific and technical activities (NACE 69-75) | 16.3 | 1.3 | 2.9 |
| All economic sectors (NACE 05-82 excl. 64-66) | 21.4 | 1.8 | 5.3 |
| Table 4 Success rates of bank finance applications by NACE sector, 2014 | |||
| % | |||
| NACE Sector | Successful | Partially successful | Unsuccessful |
| Industry (NACE 05-39) | 65.4 | 4.9 | 29.7 |
| Construction (NACE 41-43) | 73.0 | 0.0 | 27.0 |
| Selected services (NACE 45-56, 68, 77-82) | 61.8 | 6.6 | 31.6 |
| Information and communications (NACE 58-63) | 84.3 | 0.0 | 15.7 |
| Professional, scientific and technical activities (NACE 69-75) | 67.0 | 6.8 | 26.2 |
| All economic sectors (NACE 05-82 excl. 64-66) | 65.5 | 5.1 | 29.4 |
| Table 5 Enterprises applications for finance by growth type and type of finance, 2014 | ||||||
| % | ||||||
| Growth type | Type of finance | Exporter | Non exporter | All enterprises | ||
| High potential start-ups1 | Bank finance | 23.8 | 20.1 | 20.2 | ||
| Equity finance | 0.5 | 1.1 | 1.0 | |||
| Other finance types | 0.1 | 5.5 | 5.0 | |||
| Other high growth2 | Bank finance | 33.2 | 20.5 | 21.5 | ||
| Equity finance | 2.5 | 1.1 | 1.2 | |||
| Other finance types | 6.2 | 3.5 | 3.7 | |||
| Other enterprises3 | Bank finance | 14.6 | 23.1 | 22.2 | ||
| Equity finance | 4.0 | 3.3 | 3.3 | |||
| Other finance types | 4.8 | 8.4 | 8.0 | |||
| All growth types | Bank finance | 26.1 | 21.2 | 21.4 | ||
| Equity finance | 2.5 | 1.8 | 1.8 | |||
| Other finance types | 4.5 | 5.4 | 5.3 | |||
| Note 1: High potential start-ups: Enterprises established between 2010 and 2014 whose employment increased by 20% per annum over that period | ||||||
| Note 2: Other high growth: Enterprises established prior to 2010 whose employment increased by 20% per annum during the period 2010 to 2014 | ||||||
| Note 3: Other enterprises: Enterprises other than High potential startups and High growth enterprises | ||||||
| Table 6 Success rates of bank finance applications by growth type of enterprise 2014 | |||
| % | |||
| Growth group | Successful | Partially successful | Unsuccessful |
| High potential start-ups1 | 70.9 | 4.5 | 24.6 |
| Other high growth2 | 75.0 | 4.0 | 21.0 |
| Other enterprises3 | 47.3 | 7.2 | 45.5 |
| All growth types | 65.5 | 5.1 | 29.4 |
| Note 1: High potential start-ups: Enterprises established between 2010 and 2014 whose employment increased by 20% per annum over that period | |||
| Note 2: Other high growth: Enterprises established prior to 2010 whose employment increased by 20% per annum during the period 2010 to 2014 | |||
| Note 3: Other enterprises: Enterprises other than High potential startups and High growth enterprises | |||
| Table 7 Type of bank finance sought, 2014 | |||||||||
| % | |||||||||
| Number of persons engaged | New Lending | Renew existing facilities | Debt Restructuring | ||||||
| Micro (1-9) | 57.3 | 31.2 | 11.5 | ||||||
| Small (10-49) | 56.8 | 27.6 | 15.6 | ||||||
| Medium (50-249) | 45.5 | 34.2 | 20.3 | ||||||
| All SMEs (Under 250) | 57.1 | 30.7 | 12.2 | ||||||
| Table 8 Enterprises reasons for applications for finance, 2014 | |||
| % | |||
| Reason | Bank finance | Equity finance | Other finance types |
| Working capital | 50.1 | 33.4 | 39.3 |
| Investment (intangibles) | 14.0 | 23.4 | 23.1 |
| Investment (property) | 13.2 | 11.0 | 4.3 |
| Other finance | 11.7 | 8.4 | 9.8 |
| Investment (other) | 10.1 | 16.5 | 20.6 |
| Export growth | 1.0 | 7.3 | 3.0 |
| All reasons | 100.0 | 100.0 | 100.0 |
| Table 9 Main reasons enterprises did not apply for bank finance, 2014 | |
| % | |
| Reason | |
| The business did not need it | 80.0 |
| The business was unable to repay the debts | 6.8 |
| Belief the banks were not lending | 6.2 |
| An informal approach to the bank was rejected | 2.4 |
| The cost of credit was too high | 2.4 |
| The bank lending terms and conditions were too strict | 2.2 |
| All Reasons | 100.0 |
| Table 10 Main reasons enterprises did not seek equity finance, 2014 | ||
| % | ||
| Reason | ||
| The business did not need it | 81.3 | |
| Not relevant to the business | 6.1 | |
| Probable rejection | 5.0 | |
| Unfamiliar with the product | 4.5 | |
| The director/owner did not want to cede control | 1.8 | |
| Equity was too expensive a form of financing | 1.4 | |
| All Reasons | 100.0 | |
| Table 11 Enterprises reasons for choosing a particular bank, 2014 | ||||
| % | ||||
| Reason | ||||
| Business already a client | 45.2 | |||
| Bank branch local | 21.5 | |||
| Bank branch known for good client relationships | 9.5 | |||
| Bank offered best interest related terms | 8.9 | |||
| Bank's knowledge of the sector | 5.3 | |||
| Other reasons | 3.4 | |||
| Bank's emphasis on SMEs | 3.4 | |||
| Bank offered best non-interest related terms | 2.8 | |||
| All Reasons | 100.0 | |||
| Table 12 Collateral for bank finance, if required, by type of collateral, 2014 | |||
| % | |||
| Type of collateral | |||
| Personal guarantee of an owner/director of the business | 53.9 | ||
| Property of the business | 16.5 | ||
| Current assets of the business | 12.4 | ||
| Other fixed assets of the business | 7.2 | ||
| Other types of collateral | 5.5 | ||
| Personal guarantee of other individuals | 4.5 | ||
| All collateral types | 100.0 | ||
| Table 13 Reasons given by banks for full or partial loan refusal, 2014 | |||
| % | |||
| Reasons given, if any | |||
| No reason given | 17.6 | ||
| Lack of own capital | 16.8 | ||
| Too many loans/debt | 15.9 | ||
| Insufficient or risky potential | 12.6 | ||
| Other reason | 11.6 | ||
| Bank seemed unfamiliar with business' sector | 11.5 | ||
| Insufficient collateral or guarantee | 10.4 | ||
| No loan history | 2.4 | ||
| Risky export proposal plan | 1.2 | ||
| All Reasons | 100.0 | ||
| Table 14 Actions taken by enterprise following full or partial loan refusal by banks, 2014 | ||
| % | ||
| Action | ||
| Forego the funds applied for & continued to operate without additional/new finance | 41.7 | |
| Applied for alternative financing | 16.1 | |
| Sought informal finance from friends and family | 10.3 | |
| New application at new bank | 9.4 | |
| New application at State entity (e.g. Microfinance Ireland) | 8.9 | |
| Re-applied at the same bank | 8.6 | |
| Applied for trade credit facilities with suppliers | 4.5 | |
| Appealed through banks official appeals process | 0.2 | |
| Credit review office | 0.2 | |
| All actions taken | 100.0 | |
| Table 15 Main sources used to finance working capital and investment, 2014 | |||||
| % | |||||
| Sources of finance | Working capital | Investment | |||
| Internal funds/Retained earnings | 58.4 | 55.6 | |||
| Trade credit | 12.5 | 6.3 | |||
| Equity | 1.8 | 1.5 | |||
| Borrowed from banks | 9.5 | 15.1 | |||
| Government sources | 0.7 | * | |||
| Bonds | ** | 0.0 | |||
| Borrowed from non bank financial institutions/funds | 0.7 | 1.3 | |||
| Owner's contribution | 14.3 | 16.9 | |||
| Other | 2.1 | 3.3 | |||
| All sources | 100% | 100% | |||
| Note 1 * Government sources option not available for investment sources | |||||
| Note 2 ** Bonds option not available for working capital sources | |||||
| Table 16 Credit related exposures and obstacles to performance, 2014 | ||||||
| % | ||||||
| Exposure type | Exposure rate | Major obstacle | Minor obstacle | No obstacle | ||
| Outstanding business debt related to property purchase | Micro (1-9) | 7.7 | : | : | : | |
| Small (10-49) | 19.3 | : | : | : | ||
| Medium (50 - 249) | 24.8 | : | : | : | ||
| All SMEs (Under 250) | 8.8 | of which | 41.7 | 34.7 | 23.6 | |
| Outstanding debt of owner/director relating to purchase of business premises | Micro (1-9) | 7.7 | : | : | : | |
| Small (10-49) | 16.4 | : | : | : | ||
| Medium (50 - 249) | 19.0 | : | : | : | ||
| All SMEs (Under 250) | 8.5 | of which | 41.0 | 34.0 | 25.0 | |
| Outstanding property debts of owner/director | Micro (1-9) | 14.3 | : | : | : | |
| Small (10-49) | 16.5 | : | : | : | ||
| Medium (50 - 249) | 14.3 | : | : | : | ||
| All SMEs (Under 250) | 14.5 | of which | 38.8 | 35.5 | 25.7 | |
| Note - : Indicates that no breakdown is available due to small number of respondents in this category. | ||||||
| Table 17 Expected sources of finance between 2015 and 2017 | |||||||
| % | |||||||
| Source | |||||||
| Banks | 47.7 | ||||||
| Owners/directors of the business | 10.7 | ||||||
| Leasing companies | 9.5 | ||||||
| Family and/or friends | 8.6 | ||||||
| Government support (grants) | 5.9 | ||||||
| Other financial institutions | 4.5 | ||||||
| Venture capital funds & private equity | 3.7 | ||||||
| Loans from other finance sources | 3.2 | ||||||
| Business angels | 2.6 | ||||||
| Business to business | 2.2 | ||||||
| Other employees of the business | 1.4 | ||||||
| All sources | 100.0 | ||||||
| Table 18 Reasons enterprises expect to request finance between 2015 and 2017 | |
| % | |
| Reasons | |
| Working capital | 36.5 |
| Investment other | 17.9 |
| Refinance/restructure existing facilities | 13.2 |
| Investment in intangibles | 12.2 |
| Investment in property | 12.0 |
| Other | 6.2 |
| Export growth | 2.0 |
| All reasons | 100.0 |
Introduction
The “Access to Finance” survey was first carried out by the CSO for reference year 2010. This most recent survey was undertaken for reference year 2014 for all SMEs. Only independent SMEs are included in this survey, i.e. no subsidiary enterprises were selected on the assumption that their finance arrangements may be organised or influenced by the Group HQ.
The aim of the survey is to examine the different types of finance sought by SMEs, the reasons for which finance is sought and how successful these finance applications are. There are significant methodological differences between the 2010 and 2014 Access to Finance surveys and so the results are not comparable. Different questions were asked, and in particular the inclusion of micro sized enterprises in the 2014 Access to Finance survey introduces a significant change in the results. These micro sized enterprises were not surveyed in the 2010 Access to Finance survey. This release shows that the access to finance experience for micro sized enterprises can be quite different to larger size classes of SMEs.
Reference Period
2014, with a limited amount of estimated data for the years 2015 - 2017
Scope
The scope of the survey was enterprises in the non-financial market sectors that employed between 1 and 249 persons in the reference year 2014, and which continued to employ at least 1 person at the time of the survey. The enterprises in scope should be financially independent, i.e, not subsidiaries of another enterprise.
Size Classes
Micro 1 – 9 Persons employed
Small 10 – 49 Persons employed
Medium 50 – 249 Persons employed
All Small and Medium Enterprises Under 250 Persons employed
Growth Types
Enterprises classed as “high-potential start-ups” are SMEs established between 2010 and 2014 whose employment increased by at least 20% per annum over that period.
SMEs classed as “other high growth” are enterprises established prior to 2010 whose employment increased by at least 20% per annum between 2010 and 2014.
The remaining SMEs can be classed as “other” enterprises.
Coverage
The sample was selected from the following NACE Rev 2 Divisions:
Sector NACE Description
B to E (05-39) Industry
F (41-43) Construction
G to N (excluding J, K and M) (45-56,68,77-82) Selected services
J (58-63) Information and communications
M (69-75) Professional, scientific and technical services
Sample size 6,000
Response Rate 27.3%
Sampling errors
As with all sample surveys, the estimates in this release are subject to sampling variability. All of the published estimates come from survey data and so have a degree of statistical error associated with them. The sample error for this survey has been calculated at just + or – 2.3% at 95% significance level.
Questionnaire
The Survey Questionnaire can be found on the CSO website, under Surveys and Methodology, Business Sectors, Services, Survey Forms.
Glossary
Business Angels: A business angel, also known as an angel investor, is an affluent individual who provides capital for a business, typically an equity investment.
Equity Finance: Equity finance is the money raised for business activities by selling common or preferred stock to individual or institutional investors.
Factoring: Factoring is a financial transaction whereby a business sells its accounts receivable (i.e. invoices) to a third party (called a factor) at a discount in exchange for immediate money with which to finance continued business.
Hybrid Financing: Hybrid financing can be defined as a combined face of equity and debt. This means that the characteristics of both equity and bond can be found in hybrid financing.
Leasing: Leasing is a process by which a business can obtain the use of certain fixed assets for which it must pay a series of contractual, periodic, tax deductible payments. The lessee is the receiver of the services or the assets under the lease contract and the lessor is the owner of the assets.
Loan: A sum of money given from one party to another for use over a period of time. The money is paid back according to terms agreed upon by both parties, including the specified interest rates and the time frame over which the loan will be repaid.
Mezzanine Financing: A hybrid of debt and equity financing that is typically used to finance the expansion of existing companies. Mezzanine financing is basically debt capital that gives the lender the rights to convert to an ownership or equity interest in the business if the loan is not paid back in time and in full. It is generally subordinated to debt provided by senior lenders such as banks and venture capital companies.
Preferred Debt: Debt that takes precedence over other debts.
Subordinated Loan: A type of loan which ranks behind other debts should a business be wound up. Typical providers of subordinated loans are major shareholders or a parent business.
Venture Capital: Venture capital is money provided to a growing business for advertising, research, building infrastructure, developing products, etc. The investment business is called a venture capital business and the money that it gives is called venture capital.
Working Capital: The capital of a business which is used in its day-to-day trading operations, calculated as the current assets minus the current liabilities.
Fixed Assets: Assets which are purchased for long-term use and are not likely to be converted quickly into cash, such as land, buildings, and equipment.
Personal Assets: A type of property which, in its most general definition, can include any asset other than real estate. The distinguishing factor between personal property and real estate is that personal property is movable.
Investment: An asset or item that is purchased with the hope that it will generate income or appreciate in the future.
 Hide Background Notes
Scan the QR code below to view this release online or go to
http://www.cso.ie/en/releasesandpublications/er/atf/accesstofinance2014/
 Show Table 1 Enterprises applications for finance, by number of persons engaged and type of finance, 2014
 Hide Table 1 Enterprises applications for finance, by number of persons engaged and type of finance, 2014