
Live Births 2014
There were 67,295 live births in 2014 comprising of 34,681 males and 32,614 females. The corresponding total for 2013 was 68,954. The birth rate in 2014 was 14.6 per 1,000 population, 0.4 lower than the corresponding birth rate in 2013, which was 15.0 per 1,000 of the population. See tables 2.1a, 2.3 and 2.21.
Average age of mothers
The average age of mothers at maternity in Ireland in 2014 was 32.4 years. Thirty years earlier, in 1984, the average age was 29.1 years. While in 1964, 50 years earlier, the average age at maternity was 30.9 years. At 32.4 years, this is the highest average age of mothers at maternity, since the age of mother at birth was first recorded in 1955. Ireland had the highest average age at maternity within the EU 28 countries in 2014, followed by Spain, where the average age of mothers at birth was 31.8 years. Bulgaria had the lowest average age of mothers at birth with 27.3 years. See tables 2.22, 2.27 and fig 2.1.
| For long labels below use to display on multiple lines | Average Age of mothers |
|---|---|
| 1964 | 30.9 |
| 1974 | 28.9 |
| 1984 | 29.1 |
| 1994 | 29.9 |
| 2004 | 30.8 |
| 2014 | 32.4 |
Age at maternity
The percentage of births to teenagers continued to decrease with 1.8% (1,226) of all births in 2014 born to mothers in this age group. This is the lowest percentage of births to mothers under 20 since 1960, when it was 1.6% of all births. From 1961 onwards the percentage of births to mothers in this age group continued to increase until it reached a peak in 1999 with 6.2% (3,314) of all births to mothers under 20. This percentage has continually decreased each year since. Within the EU 28 The Netherlands had the lowest percentage of teenage births in 2014 with 1% of total births to this age group, while Romania had the highest percentage with 9.7%. Ireland ranked 9th with 1.8% of births to mothers under 20 years. See tables 2.8 and 2.28.
At the other end of the scale mothers aged 40 and over, are on the increase. In 2014 there were (4,135) 6.1% of births to mothers aged 40 and over. This was the highest percentage of births to this age group since 1969 when it was 6.6% of all births. In 1981, mothers under 30 years of age accounted for 59.1% of births. However, the proportion of births to this age group declined fairly steadily to reach 30.2% in 2014. See table 2.26 and fig 2.2.
| For long labels below use to display on multiple lines | Age-Group 2014 (%) |
|---|---|
| under 20 | 1.8 |
| 20-24 | 8.8 |
| 25-29 | 19.5 |
| 30-34 | 36.6 |
| 35-39 | 27 |
| 40 and over | 6.1 |
Births within and outside marriage/civil partnership
In 2014, 42,906 (63.8%) births occurred within marriage/civil partnership and 24,389 (36.2%) births occurred outside marriage/civil partnership. The percentage of births outside marriage/civil partnership is 0.9 percentage points higher than in 2013. The number of births within civil partnership in 2014 was 21. The highest percentage of births outside marriage/civil partnership occurred in Limerick City at 55.9% while the area with the lowest percentage was in Dun Laoghaire-Rathdown at 24.5%. See table 2.21.
The lowest ever number of births outside marriage/civil partnership was recorded in 1959 (1.6%). Since then there has been a steady increase in the percentage of births outside marriage/civil partnership, notably since 1980.
Multiple births
The number of maternities in 2014 which resulted in live births was 66,028 including 1,231 sets of twins, 24 sets of triplets and 2 sets of quadruplets. This is equivalent to a “twinning rate” of 18.6 (i.e. the number of sets of live twins per 1,000 maternities which resulted in live births). This represents a decrease of 0.1 on the 2013 rate of 18.7. Over the past 20 years, the twinning rate has increased significantly – from 11.7 in 1991, reaching an all time high of 18.7 in 2013. See table 2.20.
Births by NUTS III Regional authority areas
In 2014, 20,271 births (30.1%) took place in the Dublin regional authority area. In contrast, the smallest number of births (4,257) was in the Midland region (Laois, Longford, Offaly and Westmeath) with 6.3% of all births. See table 2.21 and background notes.
Births by Maternity hospital
The highest number of births in 2014 were recorded in the National maternity hospital, Holles Street with 13.7% (9,231) of all births. This was followed by the Rotunda Hospital (8,913) and The Coombe Womens & Infants University hospital (8,768) accounting for 13.2% and 13.0% of all births respectively. Outside of Dublin, Cork University Maternity hospital had the highest number of births with 8,028 births or 11.9% of all births in 2014. See table 2.17.
Domiciliary births
There were 259 babies born at home in 2014, 23 more than the 2013 figure when there were 236 domiciliary maternities. Such births have dropped from one in three births in the early 1950’s to almost 4 per thousand live births in 2014. See table 2.17.
Nationality of parents
In 2014, 77.7% of mothers’ were of Irish nationality, 2.2% of UK nationality, 1.6% of EU-15 (excluding Ireland and the UK) nationality, 11.8% of EU-28 (excluding EU-15) nationality and 6.4% of other nationality. The nationality of the mother was not stated for 0.2% of births. See tables 2.24a and 2.24b.
Birthweight
In 2014, babies with a birthweight of between 3,500 and 3,999 grams accounted for the highest percentage of births of known birthweight at 34.4%. The majority of babies (64.1%) in this group and of known gestation, had a gestational age of 40 weeks and over. See tables 2.13, 2.14 and 2.15.
Gestation
In 2014, babies with a gestational age of 40 weeks and over represented the majority (51.4%) of births of known gestation. Babies with a gestational age of under 28 weeks represented the lowest percentage of births of known gestation at 0.3%. See tables 2.12, 2.14 and 2.16.
Occupation of Mother
In 2014, less than a quarter (21.0%) of all mothers stated their occupation as homemaker. The number varied widely according to the age group of the mother, with 55.7% of mothers under 20 years and 45.8% of mothers in the 20-24 year age group, respectively recording their occupation as homemaker. In contrast, only 14.9% of mothers in the 30-39 year age group stated their occupation to be that of homemaker while 16.6% of mothers over 40 years were in this category. See table 2.25.
Birth order
A total of 25,470 births (38.0%) were to first time mothers in 2014. Second time mothers had 23,404 births (34.9%) and third time mothers had 12,020 births (17.9%). Mothers that already had three or more live-born children accounted for the remaining 9.2% of births. See table 2.8.
| For long labels below use to display on multiple lines | Birth Order 2014 (%) |
|---|---|
| 1st | 38 |
| 2nd | 34.9 |
| 3rd | 17.9 |
| 4th | 6.1 |
| 5th and over | 3.1 |
Total Period Fertility Rate
The total period fertility rate (TPFR) is derived from the age-specific fertility rates. It gives the theoretical average number of children who would be born alive to a woman during her lifetime if she were to pass through her childbearing years conforming to the age-specific fertility rates of a given year. A value of 2.1 is generally taken to be the level at which a generation would replace itself in the long run, ignoring migration.
The TPFR has fallen by just over 25% in the past 30 years, from 2.59 in 1984 to 1.94 in 2014. In Ireland, it dropped below the replacement level in 1989 and again in 1991 and has remained there since. If Ireland's TPFR had been 2.1 for 2014 then the natural increase in population would have been 41,181 (the actual natural increase was 38,043). See table 2.1.
France had the highest fertility rate in the EU 28 in 2014 with 2.01; Ireland is next with a fertility rate of 1.94 followed by Sweden with a rate of 1.88. Portugal had the lowest fertility rate at 1.23 (estimated). See Fig 2.4.
| Country | Fertility rate | ||
|---|---|---|---|
| France | 2.01 | ||
| Ireland | 1.94 | ||
| Sweden | 1.88 | ||
| United Kingdom | 1.81 | ||
| Belgium | 1.74 | ||
| Finland | 1.71 | ||
| Netherlands | 1.71 | ||
| Denmark | 1.69 | ||
| Latvia | 1.65 | ||
| Lithuania | 1.63 | ||
| Slovenia | 1.58 | ||
| Estonia | 1.54 | ||
| Bulgaria | 1.53 | ||
| Czech Republic | 1.53 | ||
| Romania | 1.52 | ||
| Luxembourg | 1.5 | ||
| Austria | 1.47 | ||
| Germany | 1.47 | ||
| Croatia | 1.46 | ||
| Hungary | 1.44 | ||
| Malta | 1.42 | ||
| Italy | 1.37 | ||
| Slovakia | 1.37 | ||
| Poland | 1.32 | ||
| Spain | 1.32 | ||
| Cyprus | 1.31 | ||
| Greece | 1.3 | ||
| Portugal | 1.23 |
Technical notes:
This report contains upward revisions to previously published figures for the number of births occurring in 2008. These revisions were first published in the Report on Vital Statistics 2009.
Live Births:
The terms used in relation to live births are defined as follows:
Parity: Parity is the number of previous live born children to a woman.
Birth Order: Birth order is the number of live born children a woman has in the order in which they are born.
Parity and Birth order: A first birth relates to parity 0 or birth order 1 i.e. birth order = parity + 1.
Crude birth rate (CBR): The number of live births divided by the total population at that age (or age-group), multiplied by 1,000.
Age specific fertility rate (ASFR): The number of live births at a certain age (or age-group) divided by the female population at that age (or age-group) multiplied by 1,000.
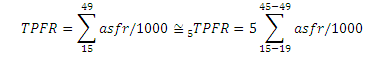
Total period fertility rate (TPFR): The sum of the ASFRs, divided by 1,000 i.e. the expected number of children a woman will have in her lifetime based on the fertility of that year.
Age specific reproduction rate (ASFR): The number of female live births at a certain age (or age-group) divided by the female population at that age (or age-group), multiplied by 1,000.
Gross reproduction rate (GRR): The sum of the ASRRs divided by 1,000 i.e. the expected number of daughters a woman will have in her lifetime based on the fertility of that year.
Net reproduction rate (NRR): The sum of the products of the ASRR's and the expected number of female years to be lived at that age, divided by 1,000 i.e. the GRR adjusted for female mortality.
The difference between the gross and the net reproduction rates is an indicator of female mortality.
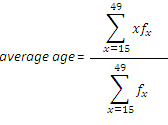
Average age at maternity: The sum of the products of the ages at maternity of live births and their ages divided by the number of live births.
Average age at maternity of first birth: The sum of the products of the ages at maternity of first live births and their ages divided by the number of first live births.
Childbearing years are regarded as between 15 and 49.
Live birth to mothers less than 15 are included in the age 15 category and are divided by the age 15 population. Similarly, live births to mothers aged greater than 49 are included in the age 49 category and are divided by the age 49 population.
Average of mean ages: Live births where the age at maternity is not stated are excluded from the calculation.
Learn about our data and confidentiality safeguards, and the steps we take to produce statistics that can be trusted by all.