
| Table 1 MIP Scoreboard Indicators for Ireland | |||||||||||
| Thresholds | 2004 | 2005 | 2006 | 2007 | 2008 | 2009 | 2010 | 2011 | 2012 | 2013 | |
| External Imbalances and Competitiveness | |||||||||||
| 1. Current Account Balance as % of GDP (3 year average) | -4%/6% | -0.6 | -2.1 | -4.2 | -6.7 | -8.1 | -8.4 | -6.4 | -4.2 | -1.5 | 1.1 |
| 2. Net International Investment Position as % of GDP | -35% | -17.9 | -24.5 | -5.3 | -19.5 | -75.6 | -92.4 | -88.0 | -112.2 | -112.0 | -104.9 |
| 3. Real Effective Exchange Rate (% change From 3 years ago) | ±5% | 18.4 | 12.1 | 2.7 | 3.1 | 7.3 | 5.0 | -5.4 | -9.6 | -12.2 | -3.9 |
| 4. Export Market shares % change (from 5 years ago) | -6% | 12.6 | 5.9 | -12.5 | -15.4 | -21.2 | -5.3 | -13.0 | -13.1 | -14.3 | -4.9 |
| 5. Nominal Unit Labour Costs ( % change from 3 years ago) | 9% | 10.7 | 14.8 | 12.8 | 14.3 | 17.0 | 10.1 | -3.2 | -12.8 | -10.0 | 1.3 |
| Internal Imbalances | |||||||||||
| 6. % y-o-y change in Deflated House Prices | 6% | 9.3 | 6.5 | 11.9 | 4.3 | -8.5 | -12.7 | -10.4 | -15.3 | -11.9 | 0.3 |
| 7. Private Sector Credit Flow as % of GDP, consolidated | 14% | 23.7 | 33.8 | 41.0 | 24.9 | 22.4 | -5.0 | 2.6 | 16.3 | -1.8 | -5.7 |
| 8. Private Sector Debt as % of GDP, consolidated | 133% | 150.1 | 171.2 | 191.7 | 198.1 | 237.4 | 258.5 | 261.1 | 277.9 | 281.5 | 266.3 |
| 9. General Government Sector Debt as % of GDP | 60% | 28.3 | 26.2 | 23.8 | 24.0 | 42.6 | 62.2 | 87.4 | 111.1 | 121.7 | 123.3 |
| 10. Unemployment Rate ( 3 year average) | 10% | 4.5 | 4.5 | 4.5 | 4.5 | 5.2 | 7.7 | 10.8 | 13.5 | 14.4 | 14.2 |
| 11. % y-o-y Change in Total Financial Sector Liabilities | 16.5% | 20.0 | 35.1 | 21.3 | 9.6 | 6.2 | 3.5 | 6.3 | -2.4 | -1.5 | 1.0 |
Introduction
Table 1 above provides the Macroeconomic Imbalance Procedure (MIP) Scoreboard for Ireland for the years 2004-2013 Where indicative thresholds are exceeded, cells are highlighted.
In 2013, four out of the eleven MIP indicators for Ireland exceeded their indicative threshold. The four indicators for Ireland whose thresholds were breached are:
Supplementary analysis is provided in this release for some of the indicators and, in particular, for those indicators which break their indicative thresholds.
The MIP is an annual process undertaken by the European Commission, where the cut off for inclusion of 2013 data for each country was 1 November 2014. Some data may have been updated/revised since this date as part of the regular production cycle of each statistical domain. However the information shown in the MIP scoreboard is based on the data available for the Alert Mechanism Report 2015 published in November 2014.
The recent financial crisis has highlighted the importance of the early detection and correction of macroeconomic imbalances across EU countries and the euro area. This has led the European Commission to develop the MIP which came into force in December 2011 as part of the 'six-pack' of legislative acts which strengthens the monitoring and surveillance of macroeconomic policies in the EU and the euro area.
Under the MIP, any potential macroeconomic vulnerabilities of EU countries are assessed by the European Commission using defined standard indicators related to both internal and external macroeconomic imbalances.
The MIP is built around a “two-step” approach with the first step consisting of an MIP scoreboard which acts as an alert mechanism. The MIP scoreboard is made up of 11 indicators which monitor any potential internal or external macroeconomic imbalances. The MIP scoreboard indicators are accompanied by indicative thresholds which are used to identify any potential economic imbalances. The indicators are mostly compiled by Eurostat with Irish data being provided by the CSO.
The aim of the scoreboard is to trigger in-depth studies undertaken by the Commission which act as the second step of the MIP. If such imbalances are problematic then the Commission may substantiate policy recommendation if appropriate.
The purpose of this release is to explain the source of the 2013 Irish data and to present details of the latest round of the annual MIP Scoreboard which was published in November 2014. Where indicative thresholds have been breached, further analysis and additional details are provided on the Irish MIP indicators.
Indicator 1 : Current Account Balance
| 3 year average | Lower MIP threshold | Upper MIP threshold | |
| 2004 | -0.6 | -4 | 6 |
| 2005 | -2.1 | -4 | 6 |
| 2006 | -4.2 | -4 | 6 |
| 2007 | -6.7 | -4 | 6 |
| 2008 | -8.1 | -4 | 6 |
| 2009 | -8.4 | -4 | 6 |
| 2010 | -6.4 | -4 | 6 |
| 2011 | -4.2 | -4 | 6 |
| 2012 | -1.5 | -4 | 6 |
| 2013 | 1.1 | -4 | 6 |
Source Publication: Balance of Payments
Source Data:
The current account provides information about all economic transactions of a country with the rest of the world. It covers all transactions in goods, services and income which occur between resident and non-resident units. For the MIP indicator above, it is expressed as a percentage of GDP.
In 2013, the current account balance as a percentage of GDP was 1.1 per cent which was within the indicative thresholds (between -4 and 6 per cent). From 2006 to 2011, this indicator was below the – 4 per cent threshold. A negative current account balance indicates that a country is a net borrower from the rest of the world.
Indicator 2 : International Investment Position
| Net International Investment Position as % of GDP | MIP Threshold | |
| 2004 | -17.9 | -35 |
| 2005 | -24.5 | -35 |
| 2006 | -5.3 | -35 |
| 2007 | -19.5 | -35 |
| 2008 | -75.6 | -35 |
| 2009 | -92.4 | -35 |
| 2010 | -88 | -35 |
| 2011 | -112.2 | -35 |
| 2012 | -112 | -35 |
| 2013 | -104.9 | -35 |
Source Publication: International Investment Position and External Debt
Source Data: Statbank Table BPA01
The international investment position (IIP) is a point in time statistical statement of the value and composition of the balance sheet stock of an economy's foreign financial assets (i.e. the economy's financial claims on the rest of the world) and its foreign financial liabilities (or obligations to the rest of the world).
The Net international investment position (IIP) for Ireland has been at and below -75.6 per cent of GDP since 2008. This is outside the set MIP threshold of -35 per cent of GDP.
Supplementary Analysis: International Investment Position Detailed Breakdown
| Central Bank | General government | Other sectors and monetary financial institutions | MIP threshold | NIIP as % of GDP | |
| 2008 | -12.6093005832932 | -23.6731417563012 | -36.6420506234281 | -35 | -72.9250280943972 |
| 2009 | -22.1212986425878 | -38.5196949688902 | -28.5806060173454 | -35 | -89.2204099599082 |
| 2010 | -77.4622865735351 | -41.8540211486224 | 35.0019402405898 | -35 | -84.3155801319364 |
| 2011 | -59.2947930917552 | -57.4677564574783 | 10.1308450556004 | -35 | -106.632289145356 |
| 2012 | -35.6493299759775 | -67.4012329599722 | -3.21264218112356 | -35 | -106.263205117073 |
| 2013 | -21.2734065255076 | -66.865570881796 | -10.3483588971972 | -35 | -98.4856199689915 |
Source Data: Statbank Table BPQ15
By breaking down the components of the IIP by institutional sector it can be seen that, from 2010 to 2013, the largest contributing components to the negative IIP came from the General government and Central Bank sectors.
In the period 2008-2013 both the General Government and Central Bank sectors have had a net deficit in the IIP. For General Government this deficit has increased from €44bn in 2008 to €117bn in 2013. The Central Bank deficit increased until 2010, at which point this trend reversed. At the end of 2013 the Central Bank deficit was €37bn.
Indicator 3: Real Effective Exchange Rate
| % change (from 3 years ago) | Lower threshold | Upper threshold | |
| 2004 | 18.4 | -5 | 5 |
| 2005 | 12.1 | -5 | 5 |
| 2006 | 2.7 | -5 | 5 |
| 2007 | 3.1 | -5 | 5 |
| 2008 | 7.3 | -5 | 5 |
| 2009 | 5 | -5 | 5 |
| 2010 | -5.4 | -5 | 5 |
| 2011 | -9.6 | -5 | 5 |
| 2012 | -12.2 | -5 | 5 |
| 2013 | -3.9 | -5 | 5 |
Source Data: Eurostat database
The REER (Real Effective Exchange Rate) aims to assess a country's price or cost competitiveness relative to its principal competitors in international markets. Changes in cost and price competitiveness depend not only on exchange rate movements but also on cost and price trends. The specific REER for the Macroeconomic Imbalances Procedure is deflated by the consumer price indices relative to a panel of 42 countries (double export weights are used to calculate REERs, reflecting not only competition in the home markets of the various competitors, but also competition in export markets elsewhere).
The lower indicative threshold of -5% was exceeded in 2010, 2011 and 2012. A negative value means improving country competitiveness relative to its principal trading partners. A positive value means real appreciation and a loss of country competitiveness relative to principal trading partners. In 2013, Ireland’s REER indicator (percentage change from 3 years ago) was -3.9 per cent which was within the indicative threshold.
Indicator 4: Export Market Share
| % change (from 5 years ago) | MIP Threshold | |
| 2004 | 12.6 | -6 |
| 2005 | 5.9 | -6 |
| 2006 | -12.5 | -6 |
| 2007 | -15.4 | -6 |
| 2008 | -21.2 | -6 |
| 2009 | -5.3 | -6 |
| 2010 | -13 | -6 |
| 2011 | -13.1 | -6 |
| 2012 | -14.3 | -6 |
| 2013 | -4.9 | -6 |
Source Publication: Balance of Payments
Source Data: Eurostat database
The export market share is calculated by dividing the exports of the country by the total exports of the world. This indicator aims at capturing structural losses in competitiveness. The indicator measures the degree of importance of a country within the total exports of the world. For the calculation at current prices, the market share refers to world trade (world export market share). A country might experience a loss of export market share not only if its exports decline but, most importantly, if its exports do not grow at the same rate of world exports and its relative position at the global level deteriorates - as is the case for Ireland since 2006. To capture the structural losses in competitiveness that can accumulate over longer time periods, the indicator is calculated as a five years percentage change (comparing year Y with year Y-5) of export market shares of goods and services.
For Ireland this indicator was within the threshold for 2013 where the percentage change was -4.9 from the level 5 years earlier. For every year from 2006 to 2012 (excluding 2009) this indicator has been outside the indicative threshold.
Indicator 5: Nominal Unit Labour Costs
| % change (from 3 years ago) | MIP Threshold | |
| 2004 | 10.7 | 9 |
| 2005 | 14.8 | 9 |
| 2006 | 12.8 | 9 |
| 2007 | 14.3 | 9 |
| 2008 | 17 | 9 |
| 2009 | 10.1 | 9 |
| 2010 | -3.2 | 9 |
| 2011 | -12.8 | 9 |
| 2012 | -10 | 9 |
| 2013 | 1.3 | 9 |
Source Publication: National Income & Expenditure (NIE)
Source Data: StatBank Table N1302
This indicator compares remuneration (compensation per employee) and productivity (GDP per person employed including self-employed) to show how the remuneration of employee’s is related to the productivity of their labour. The indicator is expressed as a percentage change over three years. The unit labour cost (ULC) is defined as the ratio of labour costs to labour productivity. A rise in an economy’s nominal unit labour costs corresponds to a rise in labour costs that exceeds the increase in labour productivity. This can potentially be a threat to an economy’s cost competitiveness, if out of line with other costs (e.g. cost of capital).
Ireland’s nominal unit labour cost indicator was below the 9 per cent threshold at 1.3 per cent in 2013 after several years of improvement in competitiveness. Prior to 2010 compensation of employees had an increasing share of GDP.
Indicator 6: Deflated House Price Index
| % y-o-y change in Deflated House Prices | MIP Threshold | |
| 2004 | 9.3 | 6 |
| 2005 | 6.5 | 6 |
| 2006 | 11.9 | 6 |
| 2007 | 4.3 | 6 |
| 2008 | -8.5 | 6 |
| 2009 | -12.7 | 6 |
| 2010 | -10.4 | 6 |
| 2011 | -15.3 | 6 |
| 2012 | -11.9 | 6 |
| 2013 | 0.3 | 6 |
Source Publication: Residential Property Price Index
Source Data:
The deflated house price index (or real house price index) is the ratio between the Residential Property Price Index and the national accounts deflator for private final consumption expenditure for households and non-profit institutions serving households (NPISH). This indicator measures inflation in the housing market relative to inflation in the final consumption expenditure of Households and NPISH. The Residential Property Price Index (RPPI) captures price changes of all residential properties purchased by households (flats, detached houses, terraced houses, etc.), both new and existing, independently of their final use and their previous owners. The land component is included.
The national accounts deflator for private final consumption expenditure is obtained by dividing final consumption expenditure of Households and NPISH at current market prices (NIE item 79a) by final consumption expenditure of Households and NIPSH at constant market prices (NIE item 92a). This data can be found in the links provided to the National Accounts section of Statbank.
In 2013, this indicator did not exceed its indicative threshold; a small increase of 0.3 per cent was recorded. The threshold has not been exceeded since 2006, when the year on year change in the deflated house price index was 11.9 per cent.
Indicator 7: Private Sector Credit Flow, Consolidated
| Private Sector Credit Flow as % of GDP, consolidated | MIP Threshold | |
| 2004 | 23.7 | 14 |
| 2005 | 33.8 | 14 |
| 2006 | 41 | 14 |
| 2007 | 24.9 | 14 |
| 2008 | 22.4 | 14 |
| 2009 | -5 | 14 |
| 2010 | 2.6 | 14 |
| 2011 | 16.3 | 14 |
| 2012 | -1.8 | 14 |
| 2013 | -5.7 | 14 |
Source Publication: Annual Institutional Sector Accounts Non-Financial and Financial
Source Data: StatBank Table IFI04
The private sector credit flow represents the net amount of liabilities (loans and debt securities) which the sectors Non-Financial Corporations (S.11- NFCs) and Households and Non-Profit institutions serving Households (S.14+S.15) have incurred during the year. Transactions between units within both sectors are eliminated to produce a consolidated presentation. The indicator is expressed as a percentage of GDP. Definitions regarding sectors and instruments are in line with the European System of Accounts, 2010 edition (ESA 2010).
The relatively large positive flows of credit in the period 2004-2008 were predominantly related to investment in both residential and commercial property. Apart from 2011 the indicator has been below the MIP threshold since 2009. The threshold breach in 2011 was caused principally by refinancing operations for a large multinational group during this period.
Indicator 8: Private Sector Debt, Consolidated
| Private Sector Debt as % of GDP, consolidated | MIP Threshold | |
| 2004 | 150.1 | 133 |
| 2005 | 171.2 | 133 |
| 2006 | 191.7 | 133 |
| 2007 | 198.1 | 133 |
| 2008 | 237.4 | 133 |
| 2009 | 258.5 | 133 |
| 2010 | 261.1 | 133 |
| 2011 | 277.9 | 133 |
| 2012 | 281.5 | 133 |
| 2013 | 266.3 | 133 |
Source Publication: Annual Institutional Sector Accounts Non-Financial and Financial
Source Data: StatBank Table IFI05
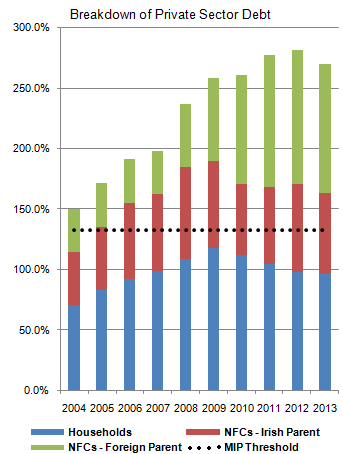
The private sector debt is the stock of liabilities in the form of loans and debt securities held by the sectors Non-Financial Corporations (S.11-NFCs) and Households (S.14+S.15). Transactions between units within both sectors are eliminated to produce a consolidated presentation. The indicator is expressed as a percentage of GDP. For Ireland, this indicator has exceeded the threshold for all years since 2001 (the first year of the available time series). A more detailed breakdown of total private sector debt is shown in Figure 10.
Supplementary Analysis: Private Sector Debt, Consolidated
| NFCs - Foreign Parent | NFCS - Irish Parent | Households | MIP Threshold | |
| 2001 | 29.1837738962218 | 62.6594640754373 | 48.3560360884662 | 133 |
| 2002 | 41.8342917509637 | 43.1679912723898 | 53.2298803977509 | 133 |
| 2003 | 34.8007662314725 | 46.2854731716614 | 60.9216741335367 | 133 |
| 2004 | 36.0832931539488 | 43.6415158476635 | 70.4073150946067 | 133 |
| 2005 | 36.1441650294529 | 51.9318356265179 | 83.0944138004265 | 133 |
| 2006 | 36.7308547181651 | 62.9034957137419 | 92.1078653895853 | 133 |
| 2007 | 35.5967151379348 | 63.7384389396462 | 98.7625093128526 | 133 |
| 2008 | 52.5859504449356 | 76.3411293227178 | 108.481331632595 | 133 |
| 2009 | 68.590612400089 | 72.3195197744709 | 117.603411850553 | 133 |
| 2010 | 90.2499927117576 | 58.8003812518267 | 112.096352633319 | 133 |
| 2011 | 109.498966110129 | 63.8961576318002 | 104.48216430114 | 133 |
| 2012 | 110.539112697552 | 72.7812414674813 | 98.1966301538323 | 133 |
| 2013 | 106.811051965063 | 67.5460105324511 | 95.9634816034494 | 133 |
This analysis uses the residency of the ultimate controlling parent as the basis for distinguishing between Irish-controlled and Foreign-controlled enterprises. It is clear from Table 2 and Figure 10 that the MIP threshold is first breached in 2005 if the influence of foreign NFCs is excluded. The subsequent threshold breaches, in the period 2005 to 2009, are driven primarily by the growth in property related investment by the Irish private sector. In the period following the initial financial crisis (roughly 2009 onwards), the contribution to overall private sector debt by Irish entities (NFCs and Households) has been decreasing, whereas the contribution from foreign NFCs has been steadily increasing. In the period since 2009 several large multinational corporations have relocated their head offices to Ireland, thus becoming an Irish Parent in this analysis. However, their impact on the scale of Private sector debt during this time is relatively small due to the fact that the debt instruments (debt securities and loans) play a minor role in the structure of their balance sheets which are predominately composed of equity liabilities vis-à-vis the rest of the world.
| Table 2 Breakdown of Private Sector Debt, Consolidated, % of GDP | ||||
| Households | NFCS - Irish Parent | NFCs - Foreign Parent | Total Private Sector Debt | |
| 2001 | 48.4% | 62.7% | 29.2% | 140.2% |
| 2002 | 53.2% | 43.2% | 41.8% | 138.2% |
| 2003 | 60.9% | 46.3% | 34.8% | 142.0% |
| 2004 | 70.4% | 43.6% | 36.1% | 150.1% |
| 2005 | 83.1% | 51.9% | 36.1% | 171.2% |
| 2006 | 92.1% | 62.9% | 36.7% | 191.7% |
| 2007 | 98.8% | 63.7% | 35.6% | 198.1% |
| 2008 | 108.5% | 76.3% | 52.6% | 237.4% |
| 2009 | 117.6% | 72.3% | 68.6% | 258.5% |
| 2010 | 112.1% | 58.8% | 90.2% | 261.1% |
| 2011 | 104.5% | 63.9% | 109.5% | 277.9% |
| 2012 | 98.2% | 72.8% | 110.5% | 281.5% |
| 2013 | 96.0% | 67.5% | 106.8% | 270.3% |
Indicator 9: General Government Debt
| General Government Sector Debt as % of GDP | MIP Threshold | |
| 2004 | 28.3 | 60 |
| 2005 | 26.2 | 60 |
| 2006 | 23.8 | 60 |
| 2007 | 24 | 60 |
| 2008 | 42.6 | 60 |
| 2009 | 62.2 | 60 |
| 2010 | 87.4 | 60 |
| 2011 | 111.1 | 60 |
| 2012 | 121.7 | 60 |
| 2013 | 123.3 | 60 |
Source Publication: Government Finance Statistics
Source Data: StatBank Table GFQ13
Public debt is defined in the Maastricht Treaty as consolidated general government gross debt at nominal value, outstanding at the end of the year. It is comprised of the financial instruments Currency and Deposits (AF.2), Debt Securities (AF.3) and Loans (AF.4). The scoreboard indicator is obtained by expressing the debt as a percentage of GDP.
General government debt has grown steadily since 2007 and breached the MIP threshold for the first time in 2009. The debt level stood at 123.3% at the end of 2013 – its highest level during the period of interest. The rise in General Government debt since 2007 has occurred as a result of the financial crisis, the most significant factor being the state interventions in the banking sector from 2010 onwards.
Supplementary Analysis: General Government Debt (% of GDP)
| Debt Securities | Loans | Currency and Deposits | MIP Threshold | |
| 2004 | 22 | 1.1 | 5.2 | 60 |
| 2005 | 20.1 | 1.2 | 4.9 | 60 |
| 2006 | 18.3 | 1.1 | 4.4 | 60 |
| 2007 | 19 | 1.1 | 3.9 | 60 |
| 2008 | 36.4 | 1.5 | 4.7 | 60 |
| 2009 | 54.4 | 1.7 | 6.1 | 60 |
| 2010 | 58.4 | 20.7 | 8.3 | 60 |
| 2011 | 55 | 22.1 | 34.1 | 60 |
| 2012 | 50.5 | 35.2 | 35.9 | 60 |
| 2013 | 64.5 | 40.9 | 17.9 | 60 |
Source Data: Eurostat database
A breakdown of General Government debt into its constituent debt instruments is shown in Figure 12. The impact of the financial crisis is clearly seen from 2008 onwards with the significant growth in the issuance of debt securities to fund state financing. The impact of the interventions in the financial sector is also evident with the growth in the loans and currency and deposits instruments during this period. The growth in the currency and deposit component of debt liabilities in 2011 and 2012 is due mainly to a combination of the classification of IBRC into the Government sector in 2011 and the growing participation of the Household sector in state savings schemes since 2008. The significant increase in loan liabilities during the years 2010-2013 is predominantly as a result of Ireland’s Programme of Financial Support from the EU and the IMF.
Indicator 10: Unemployment Rate
| Unemployment rate (3 year average) | MIP threshold | |
| 2004 | 4.5 | 10 |
| 2005 | 4.5 | 10 |
| 2006 | 4.5 | 10 |
| 2007 | 4.5 | 10 |
| 2008 | 5.2 | 10 |
| 2009 | 7.7 | 10 |
| 2010 | 10.8 | 10 |
| 2011 | 13.5 | 10 |
| 2012 | 14.4 | 10 |
| 2013 | 14.2 | 10 |
Source Publication: Quarterly National Household Survey
Source Data: StatBank Table QNQ20
The unemployment rate is the number of unemployed persons as a percentage of the labour force based on the International Labour Office definition. The labour force is the total number of people employed and unemployed. The indicator monitors rates of unemployment and it helps to better understand the potential severity of macroeconomic imbalances. The indicator is derived as a three-year average based on the reference year plus the previous two years.
This indicator has exceeded the indicative threshold from 2010. The rate of unemployment has decreased from 14.4 per cent in 2012 to 14.2 per cent in 2013. This trend has continued into 2014.
Supplementary Analysis: Contribution to Unemployment Rate, by Broad Age Group
| Total 15-24 (Youths) | Over 25 | MIP Threshold | |
| 2004 | 1.50204834482089 | 3.00628498851244 | 10 |
| 2005 | 1.47484193639709 | 3.00849139693624 | 10 |
| 2006 | 1.44284934497817 | 3.00715065502183 | 10 |
| 2007 | 1.44898304358996 | 3.05935028974337 | 10 |
| 2008 | 1.66192960990356 | 3.51307039009644 | 10 |
| 2009 | 2.30711253678067 | 5.37622079655267 | 10 |
| 2010 | 2.92821547057796 | 7.8134511960887 | 10 |
| 2011 | 3.31208173636944 | 10.1795849302972 | 10 |
| 2012 | 3.24669624324059 | 11.1366370900927 | 10 |
| 2013 | 3.00732280452484 | 11.1176771954752 | 10 |
Source Data: StatBank Table QNQ24
According to the QNHS, from 2007 to 2012, the unemployment rate increased for both those aged 15-24 and those aged over 25. The rate of increase in youth unemployment has been higher relative to the increase in unemployment of those 25 and over. In 2013 the contribution to the unemployment rate (3 year average) has decreased for the 15-24 age group but has remained relatively stable during this period for the over 25 group.
Supplementary Analysis: Unemployment by Previous Sector of Employment
| Industry | Construction | Wholesale and retail Trade | Other Service Activities + Agriculture, Forestry and Fishing | Not stated/Not previously worked | MIP Treshold | |
| 2004 | 0.651237743908358 | 0.519502151894638 | 0.648174125489435 | 1.08058198233181 | 1.60883732970909 | 10 |
| 2005 | 0.604998269950615 | 0.526729262998962 | 0.668882702651694 | 1.1067660658677 | 1.57595703186436 | 10 |
| 2006 | 0.573658114992722 | 0.556654839883552 | 0.702397197962154 | 1.10561772197962 | 1.51167212518195 | 10 |
| 2007 | 0.553648197310953 | 0.603067283263395 | 0.74784976163969 | 1.0949416231338 | 1.5088264679855 | 10 |
| 2008 | 0.599292860227436 | 0.899870447675256 | 0.86001691377573 | 1.18182488844105 | 1.63399488988052 | 10 |
| 2009 | 0.871328766903028 | 1.80936922161658 | 1.21081713376103 | 1.69892431624138 | 2.09289389481131 | 10 |
| 2010 | 1.2108992491706 | 2.79016995518305 | 1.69931028461673 | 2.40416768523369 | 2.6371194924626 | 10 |
| 2011 | 1.49235688385376 | 3.46530971705557 | 2.18093225115545 | 3.09687817044302 | 3.25618964415887 | 10 |
| 2012 | 1.54300718924553 | 3.43313333511505 | 2.44174929399293 | 3.44543433911502 | 3.5200091758648 | 10 |
| 2013 | 1.46043499644789 | 3.01697155582272 | 2.43997622820919 | 3.55035452756981 | 3.65726269195038 | 10 |
Source Data: Table 11 QNHS Unemployment Thematic Report
Figure 15 augments the trend in the unemployment rate with the percentage of unemployed persons who cited their previous sector of employment. From 2004 to 2008, the unemployment rate, according to the QNHS, was at or below 6.4 per cent. The percentage of people unemployed who classified their previous sector of employment to be in the construction sector, other service activities or sector not stated/not previously worked is clearly shown in Figure 15. The not stated/not previously worked category in Figure 15 includes persons who have never worked previously and those who have worked previously but not during the past eight years.
During the period under review the total unemployment rate from the CSO QNHS increased from 4.5 per cent in 2004 to 14.7 per cent in 2012, before decreasing slightly to 13.1 per cent in 2013.
Indicator 11: Change in Total Financial Sector Liabilities
| % y-o-y Change in Total Financial Sector Liabilities | MIP threshold | |
| 2004 | 20 | 16.5 |
| 2005 | 35.1 | 16.5 |
| 2006 | 21.3 | 16.5 |
| 2007 | 9.6 | 16.5 |
| 2008 | 6.2 | 16.5 |
| 2009 | 3.5 | 16.5 |
| 2010 | 6.3 | 16.5 |
| 2011 | -2.4 | 16.5 |
| 2012 | -1.5 | 16.5 |
| 2013 | 1 | 16.5 |
Source Publication: Annual Institutional Sector Accounts Non-Financial and Financial
Source Data: StatBank Table IFI03
This Indicator measures the evolution of the sum of all liabilities of the financial sector. The MIP indicator is expressed as a year over year growth rate, with an indicative threshold 16.5 per cent.
The indicator breached the MIP threshold from 2004 to 2006 and this growth in financial sector liabilities was mainly related to bank lending to fund investment in both residential and commercial property by the private sector. Since 2007 the indicator has fallen below the threshold which has corresponded with a period of deleveraging in the banking sector. It should be noted that the positive year-on-year growth in total financial sector liabilities from 2004 to 2010 has also been heavily influenced by the expansion of the investment funds sector in Ireland. Despite a contraction in this indicator in 2011 and 2012 the investments funds sector has continued to expand during these years as can be seen in the following chart.
Supplementary Analysis: Changes in Financial Sector Liabilities
| Central Bank | Banks + Money Market Funds | Investment Funds | Other | Total Financial Sector | |
| 2004 | 0.184999999999999 | 179.5375 | 20.66185260195 | 93.5571623505223 | 293.941514952472 |
| 2005 | 4.6908 | 263.1165 | 128.63594499789 | 220.606378524204 | 617.049623522094 |
| 2006 | 7.397161 | 304.813 | 82.9077364231 | 112.279133381995 | 507.397030805095 |
| 2007 | 13.246039 | 189.525 | 24.8889747319599 | 53.3575956007068 | 281.017609332667 |
| 2008 | 62.611 | 59.183 | -125.05180052568 | 208.236872068786 | 204.979071543106 |
| 2009 | 8.187 | -117.288 | 109.4768964 | 116.457570186166 | 116.833466586166 |
| 2010 | 79.122 | -126.124 | 186.212992 | 82.2997159091544 | 221.510707909154 |
| 2011 | -28.15 | -266.451788753134 | 173.074345 | 32.3589123290189 | -89.1685314241155 |
| 2012 | -38.537 | -145.816185593866 | 199.627479115882 | -71.5826562102473 | -56.308362688231 |
| 2013 | -32.837 | -93.867825653 | 162.462267025444 | -9.53314771480223 | 26.2242936576417 |
Source Publication Annual Institutional Sector Accounts Non-Financial and Financial
Source Data: StatBank Table IFI03
Apart from a contraction in 2008, due to the financial crisis, the Investment Funds sector has shown continuous growth in balance-sheet size since 2004. Figure 17 clearly shows the effect of this growth on the total financial sector in helping to offset the deleveraging which has been occurring in the banking sector since 2009.
The MIP Scoreboard is just one component in the preventive arm of the economic surveillance framework which the European Commission has in place to monitor economic developments in member states. Details of this surveillance framework, and the functioning of the MIP Scoreboard within it, can also be found on the European Commission website at
http://ec.europa.eu/economy_finance/economic_governance/index_en.htm
Documentation outlining the scoreboard indicators can be found on the European Commission website at
http://ec.europa.eu/economy_finance/publications/occasional_paper/2012/op92_en.htm
| Table 3 MIP Scoreboard Indicators | ||
| Indicator | Source | |
| Institution | Statistical domain | |
| 1. Current account balance as % of GDP | CSO | BOP |
| 2. Net international investment position as % of GDP | CSO | BOP |
| 3. Real effective exchange rate | DG ECFIN | |
| 4. Share of world exports | CSO, Eurostat, IMF | BOP |
| 5. Nominal unit labour cost | CSO | NA |
| 6. House prices - deflated | CSO | Price statistics |
| 7. Private credit flow as % of GDP | CSO | FA |
| 8. Private debt as % of GDP | CSO | FA |
| 9. General government gross debt (EDP) as % of GDP | CSO | GFS |
| 10. Unemployment rate | CSO | LFS |
| 11. Total financial sector liabilities | CSO | FA |
Set out in Table 3 are the 11 headline indicators from the latest round of the MIP Scoreboard, along with the Irish institution and Statistical domain which supplied the data.
The statistical areas in the CSO providing the data for compilation of the MIP scoreboard are:
 Hide Background Notes
Scan the QR code below to view this release online or go to
http://www.cso.ie/en/releasesandpublications/ep/p-macip/macroeconomicimbalanceprocedurescoreboard2013/
 Show Table 2 Breakdown of private sector debt, consolidated
 Hide Table 2 Breakdown of private sector debt, consolidated