CSO statistical release, 06 November 2020, 11am
Online ISSN 2009-681X

CensusAtSchool is an online educational project that takes place every year with the aim of bringing statistics to life in the classroom. Schools are invited to participate on a voluntary basis. Supervised by teachers, students connect to the internet using a variety of digital devices and answer questions about their lives and opinions. The data is then collated and made available for class exercises on the CensusAtSchool website so that students can see the real-life relevance of statistics.
From an estimated 371,455 secondary school students, 1,560 (0.4%) students completed the Phase 19 questionnaire of the CensusAtSchool survey. It was available to students and schools between September 2019 and June 2020. The Phase 19 questionnaire covered a variety of topics including:
Please note: the CensusAtSchool survey is voluntary. It is not part of a representative sampling process. As representative sampling process was not used to gain responses to the survey, the results of the survey are not reliable in providing inferences about the overall secondary school student population. Comparisons with international data are also not representative.
Students were asked about their opinion of climate change, how concerned they are about it and if their behaviour has changed to address climate change.
Students were asked to rank how concerned they were about climate behaviour from 0 to 500, with 0 equivalent to ‘Not at all’ and 500 equivalent to ‘Very much’.

Generally, students were concerned about climate change, with 39% rating their concern as above 400. Approximately 10% of students rated their concern about climate change as less than 100. Female students tended to rate themselves as more concerned about climate change than males, with 74 % of female students rating their concern as above 300, in comparison to 58% of male students rating their concern as above 300. See Figure 1.
| X-axis label | Male students | Female students | All students |
|---|---|---|---|
| 0 to 100 | 15 | 5 | 10 |
| 101 to 200 | 11 | 7 | 9 |
| 201 to 300 | 16 | 14 | 15 |
| 301 to 400 | 27 | 28 | 27 |
| 401 to 500 | 31 | 46 | 39 |
Students were also asked about their opinion of climate change. Almost seven in ten students believe that climate change is an urgent problem that needs to be managed now. Only 2% of students believed that climate change is not a problem. All female students believed that climate change is a problem. See Figure 2.
| X-axis label | Male | Female |
|---|---|---|
| I do not know or have no opinion | 6 | 4 |
| It is a problem that needs to be managed in the future | 11 | 7 |
| It is an urgent problem that needs to be managed now | 28 | 41 |
| It is not a problem | 2 | 0 |
When students were asked whether they have changed their own behaviour to address climate change, there was an almost equal split of responses, with 51% agreeing with the statement that they had changed their behaviour and 49% disagreeing with the statement. See Figure 3.
| Have you changed any of your own behaviour to address climate change? | |
| Yes | 51 |
| No | 49 |
Students were also asked about recycling in school and the availability of climate-friendly initiatives in schools, such as reusable water bottles, cups and flasks, water fountains and community gardens.

Most schools have a water fountain, with 88% of female students and 85% of male students having access to one at school. It was found that 84% of female students and 75% of male students brought a water bottle to school.
There are community gardens at 40% of the schools attended by the students surveyed, with 41% of female students and 39% of male students having a community garden at their school. See Figure 4.
| X-axis label | Yes - Male | Yes - Female |
|---|---|---|
| Do your bring a cup/ flask to school? | 18 | 26 |
| Do you bring a reuseable water bottle to school? | 75 | 84 |
| Does your school have a community garden? | 39 | 41 |
| Does your school have a water fountain to refill a water container? | 85 | 88 |
In 2017, students were asked what they recycled at home. This question differs from that posed in 2019, with students being asked about the availability of recycling in schools.
In 2019, it was found that 91% of students had access to paper/cardboard recycling at school recycling, while 13% had access to recycling of electrical items. In 2017, 69% of students recycled paper and cardboard at home while 29% recycled electrical items in their homes. Students were not asked about recycling food at home in 2017. See Figure 5.
| X-axis label | 2019 - What does your school recycle? | 2017 - What does your family recycle? |
|---|---|---|
| Paper/ Cardboard | 91 | 69 |
| Plastics | 79 | 64 |
| Food | 39 | 0 |
| Metal | 37 | 53 |
| Batteries | 22 | 41 |
| Glass | 16 | 55 |
| Electrical items | 13 | 29 |
Every year the CensusAtSchool questionnaire asks students to take different measurements such as the circumference of their wrist, height and arm span.
Similar questions are also asked in the international versions of CensusAtSchool. An example taken from Canada shows the Canadian survey was answered by 10,366 elementary and secondary students across Canada during the 2018/2019 school year. This reference year differs from the Irish Census at Schools reference year, which is 2019/2020. It must be noted that these comparisons are not statistically accurate and do not represent the populations of Canada or Ireland.
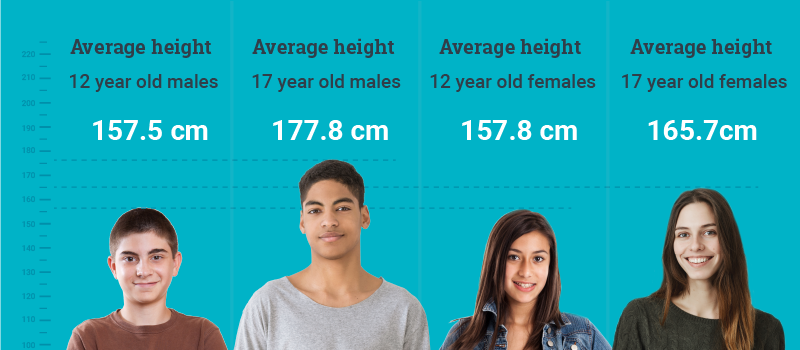
The heights of Irish and Canadian male students are very similar, with the largest variance seen for 13-year old males, where Canadian students are 3.8 cm taller than Irish students. The converse is true at age 15, where Irish students are 1.6 cm taller than their Canadian counterparts. See Figure 6.
| Ireland | Canada | |
| 12 | 157.5 | 157.1 |
| 13 | 160.4 | 164.2 |
| 14 | 170.5 | 170.9 |
| 15 | 175 | 173.4 |
| 16 | 176.8 | 177.4 |
| 17 | 177.8 | 177.6 |
For female students, a slightly larger difference is seen between Irish and Canadian students. Canadian female students are on average 1.9 cm taller than Irish female students aged 14. The converse is true at age 16, with Irish female students being on average 2 cm taller. See Figure 7.
| Aged | Ireland | Canada |
|---|---|---|
| 12 | 157.8 | 157 |
| 13 | 159.7 | 160.8 |
| 14 | 160.6 | 162.5 |
| 15 | 164.2 | 164.1 |
| 16 | 165.2 | 163.2 |
| 17 | 165.7 | 165.3 |
The following questions were asked in response to the highly acclaimed book by Hans Rosling entitled Factfulness (2018). Factfulness looks at how we all carry misconceptions about many different things in the world, from levels of poverty and healthcare in different countries, to population size and education. For example, extreme poverty has halved over the past 20 years, yet in surveys less than 10% of people know this, with 90% believing that it has either stayed the same or increased.
Full detail available at these links:
Poverty and Equity Data Portal
The three questions below were not included as a test of students’ knowledge but were designed more to help students explore these misconceptions and examine how statistics and facts can help us more accurately understand the world we live in.
The first question was: “There are 2 billion children in the world today, aged 0 to 15 years old. How many children will there be in the year 2100, according to the United Nations? “.
The answer to this is 2 billion and 28% of students answered this question correctly. See Figure 8.
| Answer | How many children will there be in the world in 2100? |
|---|---|
| 2 billion | 28 |
| 3 billion | 38 |
| 4 billion | 34 |
The second question was: “In all low-income countries across the world, what percentage of girls finish primary school?”
The answer is 60% of girls and interestingly 28% of students also answered this question correctly. See Figure 9.
| Answer | In all low-income countries across the world, what percentage of girls finish primary school? |
|---|---|
| 20 | 35 |
| 40 | 37 |
| 60 | 28 |
Finally, students were asked to rank 5 countries in order of geographical size, referencing the Mercator Projection of the true size of countries. The five countries were USA, India, Brazil, Australia and Greenland. The most popular ranked responses were in the correct order.
| Rank | Country | Correct responses (%) |
|---|---|---|
| 1 | USA | 57% |
| 2 | Brazil | 30% |
| 3 | Australia | 35% |
| 4 | India | 30% |
| 5 | Greenland | 55% |
Students were asked various questions about the Olympics, prior to their postponement. In the 2016 Summer Olympics, Ireland won two silver medals. In the 2012 Summer Olympics, Ireland won one gold, one silver and four bronze medals.

For the Tokyo Olympics, 46% of students predicted that Ireland would win one gold medal, 34% of students predicted two silver medals and 26% of students predicted three bronze models. Approximately 2% of students were optimistic, predicting over ten gold, silver and bronze medals for Ireland. Conversely, 21% of students predict no gold medal for Ireland. See Figure 10.
| Number of medals in Olympics 2020 | Gold | Silver | Bronze |
|---|---|---|---|
| 0 | 21 | 6 | 6 |
| 1 | 46 | 23 | 13 |
| 2 | 23 | 34 | 22 |
| 3 | 5 | 26 | 26 |
| 4 | 2 | 5 | 16 |
| 5 | 0 | 2 | 9 |
| 6 to 10 | 0 | 2 | 6 |
| Over 10 | 2 | 2 | 2 |
Students were asked what the most popular make and model of car was in 2018. They were also encouraged to research the questions on the CSO website. The students’ aggregated choice of most popular makes and colours of cars closely aligned to the CSO data for 2018.
For students, the most popular car make was a Volkswagen and the most popular colour was black. In 2018, the most popular car make registered was a Volkswagen with the most popular colour being silver/grey, with black coming in second.
There were some gender differences seen in the students’ responses on makes and colours of cars, with 43% of female students and 36% of male students choosing Volkswagen as the most popular make of car. See Figure 11.
| Most popular car make | Male | Female |
|---|---|---|
| Volkswagon | 36 | 43 |
| Toyota | 19 | 17 |
| Ford | 14 | 11 |
| Hyundai | 13 | 8 |
| Nissan | 5 | 4 |
| Audi | 3 | 2 |
| BMW | 1 | 4 |
| Other | 11 | 11 |
Both male and female students had similar responses for the most popular colour of car, with 50% of both male and female students choosing black as the most popular colour. See Figure 12.
| Most popular car colour | Male | Female |
|---|---|---|
| Black | 50 | 50 |
| White | 18 | 20 |
| Silver/grey | 18 | 18 |
| Blue | 6 | 6 |
| Red | 6 | 5 |
| Other | 2 | 1 |
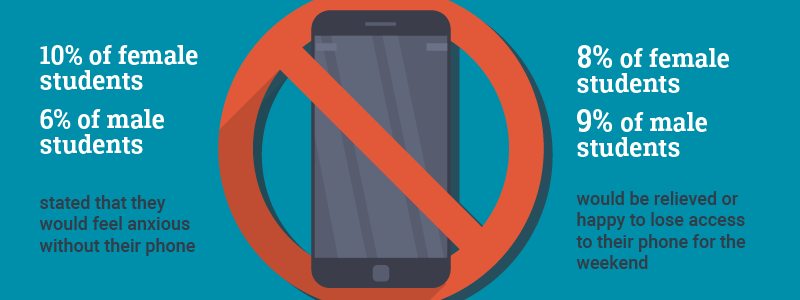
Students were asked how they would feel if they had to spend the weekend without their phone. Male and female students had very similar feelings on this, with 41% of female students and 44% of male students feeling neutral at the thought of losing access to their phone. There was a 4% difference in feelings of anxiety between genders, with 10% of female students and 6% of male students stating that they would feel anxious without their phone. On a more positive note, 9% of students would be relieved or happy to lose access to their phone for the weekend. See Figure 13.
| Without phone for weekend | Male | Female |
|---|---|---|
| Neutral | 44 | 41 |
| Frustrated | 15 | 16 |
| Annoyed | 11 | 9 |
| Anxious | 6 | 10 |
| Lonely | 6 | 7 |
| Unhappy | 6 | 6 |
| Happy | 5 | 4 |
| Relieved | 4 | 4 |
| Bored | 3 | 2 |
| Mixed emotions | 1 | 1 |
CensusAtSchool is a non-profit making international project. It is funded by organisations interested in promoting good use of statistics, mathematics and data handling. Ireland became involved in CensusAtSchool in 2009. Four Irish bodies are collaborating in this project:
The Irish website, www.censusatschool.ie, has been in place since 2009.
The Royal Statistical Society Centre for Statistical Education (RSSCSE) started the CensusAtSchool project in 2000 in conjunction with the Office of National Statistics (ONS) in the United Kingdom. The project, originally planned as a one-off survey, was linked to the UK population census of 2001. It has now developed into a dynamic, ongoing and exciting initiative being conducted in several countries. Further information on its operation in countries can be found here:
1,560 secondary school attendees from 101 secondary schools completed the Phase 19 questionnaire of the CensusAtSchool survey between September 2019 and June 2020. Because the survey is not part of a representative sampling process, the results of the survey are less reliable in providing inferences about the overall secondary school student population.
The CensusAtSchool Phase 19 questionnaire and more results from the survey can be found on the CensusAtSchool website at Census At School Questionnaire
Email: Information@cso.ie
Sarah Crilly (+353) 21 453 5085
Aeidin Sheppard (+353) 21 453 5025