| Pension coverage1 for persons in employment (ILO) aged 20 to 69 years | ||||||
| Q4 2009 | Q4 2015 | |||||
| % | % | |||||
| State | 51.2 | 46.7 | ||||
| Sex | Male | 53.1 | 47.2 | |||
| Female | 49.0 | 46.2 | ||||
| 1Includes occupational pension, personal pension, or both. | ||||||
A module on the topic of pension coverage among workers aged 20 to 69 years was included in the Quarterly National Household Survey (QNHS) in the fourth quarter (October – December) of 2015. This report presents the results of that module.
Summary of main results
Rates of pension cover
Nearly half of all workers (47%) had a pension (occupational pension, personal pension or both) in Quarter 4 2015. This represents a drop in pension coverage when compared to a pension coverage rate of 51% in Quarter 4 in 2009 and 54% in Quarter 1 2008. See table 1.1. However, the fall in pension rates was more significant in certain groups:
Workers with the lowest rate of pension cover in each classification group in Quarter 4 2015 were:
| Table 1.1 Pension coverage1 in the State for persons in employment (ILO) aged 20 to 69 years, 2005-2015 | ||||||||||||||
| % of persons aged 20 to 69 in employment | ||||||||||||||
| Q1 2005 | Q4 2005 | Q1 2007 | Q1 2008 | Q4 2009 | Q4 2015 | |||||||||
| State | 51.9 | 55.9 | 53.0 | 53.6 | 51.2 | 46.7 | ||||||||
| Sex | ||||||||||||||
| Male | 55.0 | 59.5 | 55.4 | 56.3 | 53.1 | 47.2 | ||||||||
| Female | 47.7 | 51.0 | 49.8 | 50.0 | 49.0 | 46.2 | ||||||||
| Age group | ||||||||||||||
| 20-24 | 22.2 | 27.8 | 22.6 | 27.8 | 18.6 | 14.1 | ||||||||
| 25-34 | 50.4 | 53.5 | 50.1 | 48.9 | 49.4 | 36.1 | ||||||||
| 35-44 | 61.4 | 66.3 | 63.2 | 61.1 | 57.7 | 55.3 | ||||||||
| 45-54 | 60.2 | 64.8 | 63.5 | 65.5 | 60.5 | 54.4 | ||||||||
| 55-69 | 52.3 | 54.4 | 53.5 | 55.2 | 48.7 | 49.3 | ||||||||
| 20-292 | 34.5 | 39.1 | 34.9 | 36.6 | 32.6 | 22.1 | ||||||||
| 30-652 | 58.9 | 62.8 | 60.7 | 60.6 | 57.5 | 52.1 | ||||||||
| Nationality | ||||||||||||||
| Irish nationals | 54.0 | 58.0 | 57.1 | 28.2 | 54.8 | 49.4 | ||||||||
| Non-Irish nationals | 27.5 | 32.1 | 26.1 | 53.6 | 28.1 | 29.2 | ||||||||
| ILO Employment Status | ||||||||||||||
| Self employed and Assisting relative | 44.8 | 48.4 | 45.7 | 45.8 | 36.4 | 29.9 | ||||||||
| Employee | 53.5 | 57.4 | 54.6 | 55.5 | 54.5 | 50.2 | ||||||||
| Hours of work | ||||||||||||||
| Full-time | 57.5 | 61.2 | 58.4 | 58.5 | 59.6 | 55.0 | ||||||||
| Part-time | 26.5 | 29.9 | 28.2 | 31.7 | 23.7 | 22.3 | ||||||||
| NACE Economic Sector | ||||||||||||||
| A | Agriculture, forestry and fishing | 36.8 | 35.7 | 36.0 | 44.9 | 24.1 | 28.5 | |||||||
| B-E | Industry | 60.7 | 66.0 | 59.7 | 61.2 | 58.1 | 52.1 | |||||||
| F | Construction | 41.6 | 46.1 | 44.8 | 47.5 | 44.0 | 34.1 | |||||||
| G | Wholesale and retail trade; repair of motor vehicles and motorcycles | 35.1 | 39.3 | 38.9 | 36.2 | 29.6 | 26.5 | |||||||
| H | Transportation and storage | 59.6 | 60.6 | 55.3 | 53.3 | 54.7 | 42.6 | |||||||
| I | Accommodation and food service activities | 20.8 | 23.7 | 19.9 | 22.7 | 17.3 | 13.1 | |||||||
| J | Information and communication | 60.9 | 67.3 | 61.5 | 63.5 | 58.3 | 58.9 | |||||||
| K-L | Financial, insurance and real estate activities | 78.0 | 78.2 | 76.5 | 80.5 | 82.8 | 75.2 | |||||||
| M | Professional, scientific and technical activities | 55.7 | 59.5 | 56.3 | 56.0 | 61.5 | 49.5 | |||||||
| N | Administrative and support service activities | 30.2 | 37.2 | 35.8 | 37.9 | 29.1 | 24.9 | |||||||
| O | Public administration and defence; compulsory social security | 91.0 | 93.4 | 93.0 | 93.6 | 93.3 | 89.1 | |||||||
| P | Education | 67.4 | 72.2 | 74.0 | 76.1 | 75.0 | 72.6 | |||||||
| Q | Human health and social work activities | 61.0 | 63.0 | 59.7 | 56.7 | 57.3 | 58.5 | |||||||
| R-U | Other NACE activities | 34.2 | 34.2 | 29.0 | 30.2 | 27.0 | 23.3 | |||||||
| Broad occupational group3 | ||||||||||||||
| 1. | Managers, directors and senior officials | : | : | : | 65.4 | 63.9 | 53.1 | |||||||
| 2. | Professionals | : | : | : | 75.3 | 77.1 | 74.8 | |||||||
| 3. | Associate professional and technical | : | : | : | 64.8 | 62.6 | 60.0 | |||||||
| 4. | Administrative and secretarial | : | : | : | 61.3 | 62.2 | 57.1 | |||||||
| 5. | Skilled trades | : | : | : | 47.4 | 39.5 | 33.1 | |||||||
| 6. | Caring, leisure and other services | : | : | : | 36.3 | 38.8 | 32.3 | |||||||
| 7. | Sales and customer service | : | : | : | 28.9 | 24.2 | 17.8 | |||||||
| 8. | Process, plant and machine operatives | : | : | : | 50.4 | 40.6 | 37.6 | |||||||
| 9. | Elementary | : | : | : | 33.2 | 28.5 | 22.3 | |||||||
| Other/Not stated | : | : | : | * | * | * | ||||||||
| 1Pension coverage includes persons with either an occupational pension, a personal pension, or both. | ||||||||||||||
| 2These age categories relate to the targets set by the National Pensions Policy Initiative. | ||||||||||||||
| 3'Broad occupational group' is classified in accordance with the UK SOC2010 occupation classification. This breakdown is available in this table from Q1 2008 onwards. See Background Notes for more details. | ||||||||||||||
| : Not available. | ||||||||||||||
| * Sample occurrence too small for estimation. | ||||||||||||||
| Data may be subject to sampling or other survey errors, which are greater in respect of smaller values or estimates of change. | ||||||||||||||
Types of pension cover
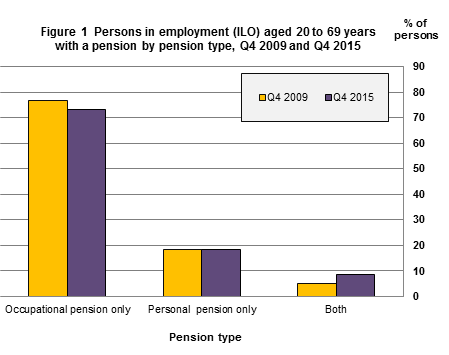
Of those workers who had a pension in Quarter 4 2015, almost three quarters (73%) had an occupational pension, 18% had a personal pension and 9% had both types of pension. See table 2.1 and figure 1. When compared with the same period in 2009, there was an overall decrease in occupational pension coverage which fell from 77% to 73% while personal pension coverage decreased marginally from 19% in Q4 2009 to 18% in Q4 2015. The fall in occupational pensions was particularly notable among the following:
Occupational pensions
In Quarter 4 2015, the economic sectors with the highest rate of occupational pension cover were Public administration and defence; compulsory social security (91%), Education (84%) and Human health and social work activities (81%). See table 2.1.
Personal pensions
| Table 2.1 Persons in employment (ILO) aged 20 to 69 years with a pension classified by type of pension,Q4 2009 and Q4 2015 | |||||||||||||||||||
| % of persons aged 20 to 69 in employment with a pension | |||||||||||||||||||
| Pension type | Occupational | Personal | Both | Total | Unweighted | ||||||||||||||
| pension only | pension only | sample1 | |||||||||||||||||
| Q4 2009 | Q4 2015 | Q4 2009 | Q4 2015 | Q4 2009 | Q4 2015 | Q4 2009 | Q4 2015 | ||||||||||||
| State | 76.5 | 73.2 | 18.5 | 18.2 | 4.9 | 8.6 | 100.0 | 2,632 | 3,120 | ||||||||||
| Sex | |||||||||||||||||||
| Male | 70.4 | 67.6 | 24.4 | 24.5 | 5.2 | 7.9 | 100.0 | 1,181 | 1,398 | ||||||||||
| Female | 84.2 | 79.8 | 11.2 | 10.8 | 4.6 | 9.4 | 100.0 | 1,451 | 1,722 | ||||||||||
| Age group | |||||||||||||||||||
| 20-24 | [91.6] | [89.7] | [5.5] | [5.2] | [2.8] | [5.1] | 100.0 | 47 | 32 | ||||||||||
| 25-34 | 85.4 | 84.9 | 11.7 | 8.2 | 3.0 | 6.9 | 100.0 | 721 | 495 | ||||||||||
| 35-44 | 75.6 | 75.9 | 20.3 | 15.9 | 4.2 | 8.2 | 100.0 | 845 | 1,079 | ||||||||||
| 45-54 | 72.1 | 67.0 | 20.5 | 22.1 | 7.4 | 10.9 | 100.0 | 679 | 905 | ||||||||||
| 55-69 | 63.6 | 62.7 | 29.6 | 29.3 | 6.8 | 8.0 | 100.0 | 340 | 609 | ||||||||||
| Nationality | |||||||||||||||||||
| Irish nationals | 76.1 | 73.2 | 18.9 | 18.1 | 5.1 | 8.7 | 100.0 | 2,458 | 2,884 | ||||||||||
| Non-Irish nationals | 82.4 | 72.2 | 14.3 | 20.1 | 3.4 | 7.7 | 100.0 | 174 | 236 | ||||||||||
| ILO Employment Status | |||||||||||||||||||
| Self employed and Assisting relative | 6.0 | 1.4 | 93.2 | 98.1 | 0.7 | 0.5 | 100.0 | 307 | 324 | ||||||||||
| Employee | 86.9 | 82.0 | 7.6 | 8.4 | 5.6 | 9.6 | 100.0 | 2,325 | 2,796 | ||||||||||
| Hours of Work | |||||||||||||||||||
| Full-time | 77.1 | 73.3 | 17.8 | 17.9 | 5.1 | 8.7 | 100.0 | 2,276 | 2,676 | ||||||||||
| Part-time | 71.8 | 71.7 | 24.9 | 20.7 | 3.3 | 7.6 | 100.0 | 356 | 444 | ||||||||||
| NACE Economic Sector | |||||||||||||||||||
| A | Agriculture, forestry and fishing | 20.9 | 12.1 | 79.1 | 85.8 | 0.0 | 2.1 | 100.0 | 57 | 87 | |||||||||
| B-E | Industry | 78.2 | 78.9 | 16.3 | 13.0 | 5.6 | 8.1 | 100.0 | 358 | 392 | |||||||||
| F | Construction | 52.7 | 46.0 | 43.7 | 47.2 | 3.5 | 6.8 | 100.0 | 127 | 101 | |||||||||
| G | Wholesale and retail trade; repair of motor | ||||||||||||||||||
| vehicles and motorcycles | 61.0 | 65.6 | 35.0 | 29.6 | 4.1 | 4.9 | 100.0 | 198 | 231 | ||||||||||
| H | Transportation and storage | 79.5 | 69.9 | 16.8 | 20.5 | 3.7 | 9.6 | 100.0 | 117 | 118 | |||||||||
| I | Accommodation and food service activities | 43.1 | 52.7 | 55.3 | 43.6 | 1.6 | 3.7 | 100.0 | 64 | 55 | |||||||||
| J | Information and communication | 79.4 | 74.7 | 17.0 | 15.8 | 3.6 | 9.6 | 100.0 | 110 | 161 | |||||||||
| K-L | Financial, insurance and real estate activities | 88.4 | 78.9 | 6.5 | 11.0 | 5.1 | 10.1 | 100.0 | 207 | 251 | |||||||||
| M | Professional, scientific and technical activities | 57.6 | 53.3 | 36.7 | 42.3 | 5.6 | 4.4 | 100.0 | 143 | 193 | |||||||||
| N | Administrative and support service activities | 68.6 | 66.9 | 28.1 | 31.5 | 3.3 | 1.6 | 100.0 | 54 | 57 | |||||||||
| O | Public administration and defence; compulsory | ||||||||||||||||||
| social security | 92.5 | 90.6 | 2.6 | 0.9 | 4.9 | 8.4 | 100.0 | 279 | 320 | ||||||||||
| P | Education | 88.5 | 84.0 | 4.7 | 3.3 | 6.7 | 12.7 | 100.0 | 386 | 476 | |||||||||
| Q | Human health and social work activities | 87.2 | 81.3 | 7.3 | 7.3 | 5.4 | 11.4 | 100.0 | 457 | 596 | |||||||||
| R-U | Other NACE activities | 55.8 | 53.9 | 37.7 | 41.4 | 6.5 | 4.8 | 100.0 | 75 | 82 | |||||||||
| Broad occupational group2 | |||||||||||||||||||
| 1. | Managers, directors and senior officials | 59.5 | 57.9 | 34.0 | 35.1 | 6.5 | 7.0 | 100.0 | 464 | 278 | |||||||||
| 2. | Professionals | 79.2 | 76.6 | 14.4 | 11.1 | 6.5 | 12.3 | 100.0 | 542 | 981 | |||||||||
| 3. | Associate professional and technical | 82.9 | 75.2 | 11.9 | 17.0 | 5.3 | 7.8 | 100.0 | 374 | 493 | |||||||||
| 4. | Administrative and secretarial | 90.8 | 84.1 | 6.8 | 7.9 | 2.5 | 8.0 | 100.0 | 420 | 459 | |||||||||
| 5. | Skilled trades | 51.8 | 48.4 | 44.9 | 45.6 | 3.3 | 6.0 | 100.0 | 182 | 284 | |||||||||
| 6. | Caring, leisure and other services | 84.7 | 83.6 | 10.1 | 10.8 | 5.2 | 5.6 | 100.0 | 278 | 220 | |||||||||
| 7. | Sales and customer service | 74.7 | 72.1 | 21.6 | 20.1 | 3.7 | 7.8 | 100.0 | 103 | 91 | |||||||||
| 8. | Process, plant and machine operatives | 78.3 | 72.1 | 15.7 | 21.7 | 6.0 | 6.1 | 100.0 | 141 | 166 | |||||||||
| 9. | Elementary | 81.3 | 86.2 | 14.5 | 7.7 | 4.2 | 6.2 | 100.0 | 128 | 137 | |||||||||
| Other/Not stated | 41.4 | 93.6 | 58.6 | 6.4 | 0.0 | 0.0 | 100.0 | 10 | 11 | ||||||||||
| 1Number of persons aged 20 to 69 years in employment with a pension. | |||||||||||||||||||
| 2'Broad occupational group' is classified in accordance with the UK SOC2010 occupation classification. This breakdown is available in this table from Q12008 onwards. See Background Notes for more details. | |||||||||||||||||||
| Figures in parentheses [ ] indicate percentages based on small numbers, and are, therefore, subject to a wide margin of error. | |||||||||||||||||||
| Data may be subject to sampling or other survey errors, which are greater in respect of smaller values or estimates of change. | |||||||||||||||||||
| Table 2.2 Persons with an occupational pension, classified by type of occupational pension, Q4 2015 | |||||||||
| % of persons aged 20 to 69 in employment | |||||||||
| Defined Benefit | Defined Contribution | Don't know1 | Total | Unweighted sample2 | |||||
| State | 46.0 | 53.8 | 0.3 | 100.0 | 2,574 | ||||
| Sex | |||||||||
| Male | |||||||||
| Age Group | |||||||||
| 20-24 | * | * | * | * | 17 | ||||
| 25-34 | 38.4 | 61.6 | 0.0 | 100.0 | 178 | ||||
| 35-44 | 40.2 | 59.4 | 0.4 | 100.0 | 338 | ||||
| 45-54 | 41.4 | 58.6 | 0.0 | 100.0 | 301 | ||||
| 55-69 | 48.9 | 49.7 | 1.4 | 100.0 | 206 | ||||
| Total | 41.4 | 58.2 | 0.4 | 100.0 | 1,040 | ||||
| Female | |||||||||
| Age Group | |||||||||
| 20-24 | * | * | * | * | 13 | ||||
| 25-34 | 41.9 | 58.1 | 0.0 | 100.0 | 276 | ||||
| 35-44 | 52.9 | 46.8 | 0.3 | 100.0 | 585 | ||||
| 45-54 | 56.0 | 43.8 | 0.2 | 100.0 | 426 | ||||
| 55-69 | 54.3 | 45.7 | 0.0 | 100.0 | 234 | ||||
| Total | 50.5 | 49.5 | 0.2 | 100.0 | 1,534 | ||||
| 1Includes those who answered 'Don't know' or 'Not stated'. | |||||||||
| 2Number of persons aged 20 to 69, in employment with an occupational pension. | |||||||||
| *Sample occurrence too small for estimation. | |||||||||
| Data may be subject to sampling or other survey errors, which are greater in respect of smaller values or estimates of change. | |||||||||
| Type of occupational pension | Type of occupational pension Q4 2015 |
|---|---|
| Defined contribution | 53.8 |
| Defined benefit | 46 |
| Don't know | 0.3 |
| Table 2.3 Persons with a pension, classified by type of pension and length of time in scheme, Q4 2015 | |||||||||||
| % of persons aged 20 to 69 in employment | |||||||||||
| Length of time in scheme | |||||||||||
| Less than 5 years | 5 to 9 years | 10 to 14 years | 15 to 19 years | 20 years or more | Don't know1 | Total | Unweighted | ||||
| sample2 | |||||||||||
| Occupational pension | |||||||||||
| State | 24.1 | 21.8 | 20.7 | 15.7 | 17.7 | 0.0 | 100.0 | 2,574 | |||
| Sex | |||||||||||
| Male | 24.7 | 20.6 | 19.8 | 15.3 | 19.6 | 0.0 | 100.0 | 1,040 | |||
| Female | 23.5 | 23.1 | 21.6 | 16.1 | 15.7 | 0.0 | 100.0 | 1,534 | |||
| Age group | |||||||||||
| 20-24 | [92.9] | [7.1] | 0.0 | 0.0 | 0.0 | 0.0 | 100.0 | 30 | |||
| 25-34 | 49.1 | 35.8 | 13.6 | 1.4 | 0.0 | 0.0 | 100.0 | 454 | |||
| 35-44 | 21.1 | 24.0 | 27.2 | 22.3 | 5.4 | 0.0 | 100.0 | 923 | |||
| 45-54 | 12.2 | 14.9 | 21.5 | 20.2 | 31.3 | 0.0 | 100.0 | 727 | |||
| 55-69 | 5.7 | 11.1 | 17.4 | 15.3 | 50.5 | 0.0 | 100.0 | 440 | |||
| Personal pension | |||||||||||
| State | 17.9 | 23.8 | 23.8 | 13.5 | 19.0 | 2.1 | 100.0 | 824 | |||
| Sex | |||||||||||
| Male | 15.0 | 22.2 | 22.4 | 15.5 | 22.8 | 2.1 | 100.0 | 471 | |||
| Female | 23.2 | 26.8 | 26.4 | 9.7 | 11.9 | 2.0 | 100.0 | 353 | |||
| Age group | |||||||||||
| 20-24 | * | * | * | * | * | * | 100.0 | 4 | |||
| 25-34 | 51.5 | 38.1 | 9.4 | 0.0 | 0.0 | 1.1 | 100.0 | 78 | |||
| 35-44 | 21.4 | 33.4 | 28.7 | 10.5 | 3.9 | 2.0 | 100.0 | 246 | |||
| 45-54 | 12.6 | 20.3 | 26.6 | 17.9 | 20.4 | 2.3 | 100.0 | 279 | |||
| 55-69 | 3.2 | 10.6 | 20.9 | 17.6 | 45.5 | 2.3 | 100.0 | 217 | |||
| 1Includes those who answered 'Don't know' or 'Not stated'. | |||||||||||
| 2Number of persons aged 20 to 69 in employment. | |||||||||||
| * Sample occurrence too small for estimation. | |||||||||||
| Figures in parentheses [ ] indicate percentages based on small numbers, and are, therefore, subject to a wide margin of error. | |||||||||||
| The 'Occupational Pension' and 'Personal Pension' categories in this table include respondents with both types of pension. | |||||||||||
Workers without a pension
Reasons for not having a pension
All respondents who did not have an occupational or a personal pension were asked to indicate the main reason they did not have a pension. The most common reason, reported by 39% of respondents, was that they could not afford a pension. Just over one fifth (22%) of respondents said that they never got around to organising a pension, 9% said that there was no scheme available through work and 13% did not identify any reason for not having a pension. See table 3.1 and figure 3.
While affordability was the most common reason given by all age groups for not having a pension, a high proportion of workers in the 20 to 24 and the 25 to 34 year age groups who did not have a pension (36% and 31% respectively) reported that the main reason was that they never got around to organising it. See table 3.1.
Among other notable points:
Employees without an occupational pension
| Table 3.1 Persons in employment (ILO) aged 20 to 69 years without a pension classified by main reason for not having a pension, Q4 2015 | ||||||||||||||||
| % of persons in employment aged 20-69 without a pension | ||||||||||||||||
| Reason for not having a pension | ||||||||||||||||
| Never got around to organising a pension | Too much financial risk involved | No scheme available through work | Have a pension from previous job | Other sources will be adequate | Spouse / partner has a good pension | Better return from other sources | ||||||||||
| Don't understand pensions | Can't afford a pension | Don't know1 | Unweighted sample2 | |||||||||||||
| Other | Total | |||||||||||||||
| State | 22.1 | 4.9 | 38.9 | 3.8 | 9.3 | 2.6 | 2.3 | 1.5 | 1.2 | 9.3 | 4.1 | 100.0 | 3,246 | |||
| Sex | ||||||||||||||||
| Male | 23.0 | 4.6 | 38.9 | 5.0 | 7.0 | 3.3 | 2.7 | 0.5 | 1.7 | 8.7 | 4.7 | 100.0 | 1,452 | |||
| Female | 21.0 | 5.2 | 38.8 | 2.5 | 11.9 | 1.9 | 1.8 | 2.7 | 0.7 | 10.0 | 3.5 | 100.0 | 1,794 | |||
| Age group | ||||||||||||||||
| 20-24 | 36.0 | 10.1 | 28.9 | 1.3 | 7.0 | 0.9 | 0.6 | 0.0 | 0.0 | 11.1 | 4.1 | 100.0 | 196 | |||
| 25-34 | 30.9 | 6.2 | 33.9 | 2.3 | 9.3 | 0.6 | 0.9 | 0.6 | 0.8 | 10.2 | 4.3 | 100.0 | 799 | |||
| 35-44 | 19.7 | 4.2 | 42.6 | 4.4 | 10.4 | 1.9 | 2.4 | 1.8 | 0.8 | 7.1 | 4.6 | 100.0 | 842 | |||
| 45-54 | 14.0 | 2.6 | 45.3 | 4.2 | 10.2 | 4.9 | 2.8 | 2.5 | 2.0 | 7.8 | 3.5 | 100.0 | 765 | |||
| 55-69 | 10.4 | 2.9 | 40.6 | 6.7 | 8.1 | 5.8 | 5.0 | 2.7 | 2.2 | 11.8 | 3.8 | 100.0 | 644 | |||
| Nationality | ||||||||||||||||
| Irish nationals | 22.2 | 4.1 | 39.4 | 4.3 | 9.4 | 2.8 | 2.4 | 1.7 | 1.3 | 8.8 | 3.7 | 100.0 | 2,719 | |||
| Non-Irish nationals | 21.4 | 8.4 | 36.5 | 1.5 | 9.2 | 2.0 | 1.5 | 0.7 | 0.9 | 11.7 | 6.1 | 100.0 | 527 | |||
| ILO Employment Status | ||||||||||||||||
| Self employed and Assisting relative | 18.3 | 3.6 | 41.5 | 8.4 | 2.5 | 3.9 | 4.7 | 2.3 | 2.8 | 7.7 | 4.4 | 100.0 | 788 | |||
| Employee | 23.2 | 5.2 | 38.1 | 2.5 | 11.3 | 2.3 | 1.5 | 1.3 | 0.7 | 9.8 | 4.0 | 100.0 | 2,458 | |||
| Hours of work | ||||||||||||||||
| Full-time | 25.6 | 4.5 | 35.7 | 5.1 | 7.8 | 2.8 | 2.6 | 0.8 | 1.6 | 9.0 | 4.5 | 100.0 | 1,936 | |||
| Part-time | 16.1 | 5.5 | 44.4 | 1.5 | 11.9 | 2.5 | 1.6 | 2.7 | 0.5 | 9.8 | 3.5 | 100.0 | 1,310 | |||
| NACE economic sector | ||||||||||||||||
| A | Agriculture, forestry and fishing | 14.0 | 6.5 | 40.7 | 15.0 | 1.4 | 2.3 | 6.1 | 2.3 | 1.5 | 8.4 | 1.9 | 100.0 | 245 | ||
| B-E | Industry | 27.8 | 4.0 | 35.6 | 3.0 | 8.0 | 3.6 | 1.4 | 1.9 | 0.9 | 7.6 | 6.3 | 100.0 | 328 | ||
| F | Construction | 18.2 | 3.6 | 47.7 | 3.2 | 8.6 | 2.9 | 0.9 | 0.8 | 3.6 | 7.1 | 3.4 | 100.0 | 187 | ||
| G | Wholesale and retail trade; repair of motor | |||||||||||||||
| vehicles and motorcycles | 26.5 | 7.4 | 37.5 | 2.8 | 8.8 | 1.3 | 1.3 | 1.1 | 0.8 | 8.8 | 3.7 | 100.0 | 584 | |||
| H | Transportation and storage | 19.3 | 5.3 | 47.5 | 3.6 | 6.3 | 1.4 | 1.0 | 0.0 | 1.1 | 8.2 | 6.4 | 100.0 | 147 | ||
| I | Accommodation and food | |||||||||||||||
| service activities | 23.6 | 6.9 | 40.7 | 0.5 | 9.7 | 1.5 | 3.1 | 1.0 | 0.6 | 8.0 | 4.2 | 100.0 | 341 | |||
| J | Information and communication | 20.7 | 1.1 | 30.3 | 5.2 | 8.6 | 3.4 | 1.2 | 1.3 | 4.2 | 16.1 | 7.8 | 100.0 | 104 | ||
| K-L | Financial, insurance and real | |||||||||||||||
| estate activities | 20.6 | 1.9 | 13.8 | 8.8 | 10.6 | 7.4 | 6.8 | 2.9 | 3.5 | 13.4 | 10.1 | 100.0 | 82 | |||
| M | Professional, scientific and | |||||||||||||||
| technical activities | 26.6 | 2.5 | 28.0 | 4.1 | 10.9 | 3.9 | 3.2 | 1.7 | 0.9 | 13.4 | 4.8 | 100.0 | 185 | |||
| N | Administrative and support | |||||||||||||||
| service activities | 16.1 | 3.6 | 44.8 | 2.5 | 13.7 | 3.2 | 0.6 | 0.0 | 0.7 | 9.4 | 5.5 | 100.0 | 169 | |||
| O | Public administration and defence; | |||||||||||||||
| compulsory social security | [9.0] | [1.9] | [46.4] | [1.4] | [4.9] | [10.5] | [6.4] | [2.5] | [2.1] | [14.9] | 0.0 | 100.0 | 39 | |||
| P | Education | 15.3 | 2.9 | 38.7 | 1.7 | 17.8 | 2.5 | 3.3 | 3.1 | 2.1 | 11.0 | 1.5 | 100.0 | 173 | ||
| Q | Human health and social work activities | 18.8 | 5.4 | 39.8 | 3.0 | 11.4 | 3.1 | 2.2 | 1.8 | 0.2 | 10.7 | 3.6 | 100.0 | 403 | ||
| R-U | Other NACE activities | 24.7 | 2.3 | 43.4 | 3.8 | 10.6 | 2.4 | 1.3 | 2.8 | 0.2 | 7.2 | 1.2 | 100.0 | 259 | ||
| Broad occupational group3 | ||||||||||||||||
| 1. | Managers, directors and senior officials | 25.9 | 2.8 | 31.2 | 3.9 | 5.7 | 6.5 | 3.6 | 1.7 | 4.4 | 10.7 | 3.8 | 100.0 | 236 | ||
| 2. | Professionals | 26.6 | 2.1 | 22.4 | 4.6 | 10.9 | 3.6 | 4.3 | 2.4 | 2.5 | 15.3 | 5.1 | 100.0 | 295 | ||
| 3. | Associate professional and technical | 31.4 | 2.6 | 27.3 | 4.4 | 10.5 | 4.7 | 1.8 | 1.8 | 1.4 | 10.1 | 3.9 | 100.0 | 316 | ||
| 4. | Administrative and secretarial | 15.8 | 4.1 | 34.8 | 2.3 | 18.5 | 3.5 | 1.2 | 3.2 | 0.2 | 11.4 | 5.1 | 100.0 | 330 | ||
| 5. | Skilled trades | 20.1 | 3.9 | 43.0 | 7.1 | 6.2 | 2.8 | 2.9 | 1.5 | 1.5 | 7.4 | 3.5 | 100.0 | 577 | ||
| 6. | Caring, leisure and other services | 19.3 | 4.9 | 45.6 | 3.2 | 12.1 | 0.2 | 2.2 | 2.2 | 0.0 | 6.8 | 3.6 | 100.0 | 410 | ||
| 7. | Sales and customer service | 24.6 | 8.4 | 36.3 | 1.7 | 9.5 | 2.3 | 1.4 | 0.9 | 0.4 | 10.3 | 4.2 | 100.0 | 362 | ||
| 8. | Process, plant and machine operatives | 17.3 | 3.4 | 54.1 | 4.8 | 4.9 | 2.1 | 1.3 | 0.0 | 0.7 | 6.8 | 4.5 | 100.0 | 246 | ||
| 9. | Elementary | 20.4 | 8.6 | 45.3 | 1.2 | 8.2 | 0.6 | 1.7 | 0.8 | 0.8 | 8.3 | 4.2 | 100.0 | 468 | ||
| Other/Not stated | * | * | * | * | * | * | * | * | * | * | * | 100.0 | 6 | |||
| 1Includes those who answered 'Don't know' or 'Not stated'. | ||||||||||||||||
| 2Number of persons aged 20-69 in employment without a pension. | ||||||||||||||||
| 3'Broad occupational group' is classified in accordance with the UK SOC2010 occupation classification. This breakdown is available in this table from Q1 2008 onwards. See Background Notes for more details. | ||||||||||||||||
| * Sample occurrence too small for estimation | ||||||||||||||||
| Figures in parentheses [ ] indicate percentages based on small numbers, and are, therefore, subject to a wide margin of error. | ||||||||||||||||
| Data may be subject to sampling or other survey errors, which are greater in respect of smaller values. | ||||||||||||||||
| Reasons for not having a pension | Main reason for not having a pension |
|---|---|
| Never got around to organising a pension | 22.2 |
| Don't understand pensions | 4.7 |
| Can't afford a pension | 38.9 |
| Too much financial risk involved | 3.7 |
| No scheme available through work | 9.2 |
| Have pension from previous job | 2.7 |
| Other sources will be adequate | 2.2 |
| Spouse/partner has pension | 1.5 |
| Better return from other sources | 1.2 |
| Other | 9.4 |
| Don't know/not stated | 4.2 |
| Table 3.2 Employees aged 20 to 69 years who do not have an occupational pension classified by availability of a scheme and their eligibility to join, Q4 2015 | ||||||||||||
| % of employees aged 20-69 who do not have an occupational pension | ||||||||||||
| Eligibile to join employer's | ||||||||||||
| pension scheme | ||||||||||||
| Don't know | ||||||||||||
| Don't | Employer does | if employer | Unweighted sample2 | |||||||||
| Yes | No | know1 | not offer scheme | offers scheme | Total | |||||||
| State | 15.5 | 5.9 | 0.7 | 67.9 | 9.9 | 100.0 | 2,563 | |||||
| Sex | ||||||||||||
| Male | 17.7 | 5.3 | 0.6 | 66.5 | 9.9 | 100.0 | 1,007 | |||||
| Female | 13.5 | 6.5 | 0.9 | 69.2 | 10.0 | 100.0 | 1,556 | |||||
| Age group | ||||||||||||
| 20-24 | 7.1 | 6.1 | 1.1 | 69.1 | 16.6 | 100.0 | 181 | |||||
| 25-34 | 16.9 | 6.0 | 0.7 | 65.6 | 10.8 | 100.0 | 721 | |||||
| 35-44 | 20.4 | 5.7 | 0.5 | 64.7 | 8.7 | 100.0 | 717 | |||||
| 45-54 | 14.1 | 5.7 | 0.8 | 72.2 | 7.2 | 100.0 | 564 | |||||
| 55-69 | 11.5 | 6.0 | 0.6 | 74.2 | 7.8 | 100.0 | 380 | |||||
| Nationality | ||||||||||||
| Irish nationals | 16.3 | 6.2 | 0.9 | 67.4 | 9.2 | 100.0 | 2,100 | |||||
| Non-Irish nationals | 12.2 | 4.5 | 0.0 | 70.1 | 13.2 | 100.0 | 463 | |||||
| Hours of work | ||||||||||||
| Full-time | 20.3 | 5.9 | 0.6 | 63.3 | 9.9 | 100.0 | 1,488 | |||||
| Part-time | 7.8 | 5.8 | 1.0 | 75.4 | 10.0 | 100.0 | 1,075 | |||||
| Number of people working in the organisation | ||||||||||||
| 1-4 | 3.1 | 2.2 | 0.2 | 91.9 | 2.6 | 100.0 | 336 | |||||
| 5-49 | 7.9 | 4.0 | 0.4 | 78.8 | 8.9 | 100.0 | 1,124 | |||||
| 50-99 | 18.0 | 4.3 | 0.2 | 60.6 | 16.8 | 100.0 | 277 | |||||
| 100-499 | 29.3 | 7.9 | 2.2 | 48.9 | 11.8 | 100.0 | 340 | |||||
| 500+ | 31.5 | 13.0 | 1.1 | 44.4 | 9.9 | 100.0 | 434 | |||||
| Don't know/Not stated | 8.4 | 3.1 | 0.0 | 61.1 | 27.4 | 100.0 | 52 | |||||
| 1Includes those who answered 'Don't know' and 'Not stated'. | ||||||||||||
| 2Number of employees aged 20-69 who do not have an occupational pension | ||||||||||||
| Data may be subject to sampling or other survey errors, which are greater in respect of smaller values or estimates of change. | ||||||||||||
| Table 3.3 Employees aged 20 to 69 years who do not have an occupational pension classified by availability of a scheme and their eligibility to join, by industry and profession type, Q4 2015 | ||||||||||||||
| % of employees aged 20-69 who do not have an occupational pension | ||||||||||||||
| Eligibile to join employer's | ||||||||||||||
| pension scheme | ||||||||||||||
| Employer does not offer scheme | Don't know if employer offers scheme | Unweighted sample2 | ||||||||||||
| Don't | ||||||||||||||
| Yes | No | know1 | Total | |||||||||||
| State | 15.5 | 5.9 | 0.7 | 67.9 | 9.9 | 100.0 | 2,563 | |||||||
| NACE economic sector | ||||||||||||||
| A | Agriculture, forestry and fishing | * | * | * | * | * | 100.0 | 24 | ||||||
| B-E | Industry | 21.3 | 6.4 | 0.8 | 58.7 | 12.8 | 100.0 | 287 | ||||||
| F | Construction | 8.2 | 2.6 | 0.0 | 83.8 | 5.4 | 100.0 | 110 | ||||||
| G | Wholesale and retail trade; repair of motor | |||||||||||||
| vehicles and motorcycles | 16.8 | 4.0 | 0.9 | 65.9 | 12.5 | 100.0 | 523 | |||||||
| H | Transportation and storage | 21.1 | 14.7 | 1.1 | 53.0 | 10.1 | 100.0 | 91 | ||||||
| I | Accommodation and food service activities | 5.6 | 2.5 | 0.6 | 77.1 | 14.1 | 100.0 | 305 | ||||||
| J | Information and communication | 33.1 | 7.0 | 0.0 | 55.1 | 4.8 | 100.0 | 93 | ||||||
| K-L | Financial, insurance and real estate activities | 27.2 | 13.8 | 1.0 | 51.1 | 6.8 | 100.0 | 78 | ||||||
| M | Professional, scientific and technical activities | 25.1 | 6.6 | 0.4 | 62.2 | 5.7 | 100.0 | 165 | ||||||
| N | Administrative and support service activities | 11.7 | 3.5 | 0.6 | 74.8 | 9.4 | 100.0 | 156 | ||||||
| O | Public administration and defence; compulsory | |||||||||||||
| social security | [24.7] | [20.4] | [0.0] | [48.0] | [6.9] | 100.0 | 39 | |||||||
| P | Education | 14.2 | 12.6 | 1.1 | 68.3 | 3.8 | 100.0 | 134 | ||||||
| Q | Human health and social work activities | 12.5 | 7.6 | 1.1 | 70.2 | 8.6 | 100.0 | 374 | ||||||
| R-U | Other NACE activities | 8.2 | 3.0 | 0.3 | 79.5 | 8.8 | 100.0 | 184 | ||||||
| Broad occupational group3 | ||||||||||||||
| 1. | Managers, directors and senior officials | 28.2 | 5.8 | 0.0 | 61.2 | 4.9 | 100.0 | 133 | ||||||
| 2. | Professionals | 26.7 | 9.5 | 0.4 | 54.2 | 9.2 | 100.0 | 260 | ||||||
| 3. | Associate professional and technical | 23.2 | 8.3 | 0.0 | 63.1 | 5.4 | 100.0 | 265 | ||||||
| 4. | Administrative and secretarial | 16.0 | 8.6 | 1.6 | 64.7 | 9.1 | 100.0 | 322 | ||||||
| 5. | Skilled trades | 13.3 | 3.5 | 0.3 | 74.7 | 8.1 | 100.0 | 257 | ||||||
| 6. | Caring, leisure and other services | 6.8 | 7.2 | 1.0 | 75.0 | 10.0 | 100.0 | 348 | ||||||
| 7. | Sales and customer service | 14.5 | 2.8 | 1.2 | 67.4 | 14.2 | 100.0 | 344 | ||||||
| 8. | Process, plant and machine operatives | 14.0 | 7.0 | 0.5 | 68.4 | 10.1 | 100.0 | 185 | ||||||
| 9. | Elementary | 9.6 | 3.6 | 0.8 | 73.3 | 12.7 | 100.0 | 445 | ||||||
| Other/Not stated | * | * | * | * | * | * | 4 | |||||||
| 1Includes those who answered 'Don't know' or 'Not stated'. | ||||||||||||||
| 2Number of employees aged 20-69 who do not have an occupational pension. | ||||||||||||||
| 3'Broad occupational group' is classified in accordance with the UK SOC2010 occupation classification. This breakdown is available in this table from Q1 2008 onwards. See Background Notes for more details. | ||||||||||||||
| * Sample occurrence too small for estimation. | ||||||||||||||
| Figures in parentheses [ ] indicate percentages based on small numbers, and are, therefore, subject to a wide margin of error. | ||||||||||||||
| Data may be subject to sampling or other survey errors, which are greater in respect of smaller values or estimates of change. | ||||||||||||||
Retirement
Expected retirement age
The majority of workers (68%) expected to retire when they will be aged between 60 and 69 years, 13% of respondents did not know when they would retire, while 8% said that they had no intention of ever retiring. See table 4.1.
Respondents who gave their expected retirement age were asked to indicate the main reason they expected to retire at that age. The most common reason given by one fifth (21%) of respondents was that it was the age at which people usually retire. See table 4.2.
There were some differences between employees and self-employed workers in the reasons they gave for the age they expected to retire. Employees were most likely to cite employer’s rules on retirement age (18%) or usual retirement age (23%) and less likely to give affordability (16%) as the main reason for their expected retirement age. However, affordability was the most common reason given by one fifth (20%) of self-employed workers for their expected retirement age. See table 4.2.
The most common reason given by over one fifth (21%) of full-time workers for their expected retirement age was that it was the age when people usually retire. One in five (20%) of part-time workers also stated that this was the reason for their expected age of retirement. A further one fifth (20%) of part-time workers said that it was the age at which they would receive the State social welfare pension, compared with 11% of full-time workers, who gave this reason for their expected retirement age. See table 4.2.
One in five workers who did not have a pension reported that their main reason for their expected retirement age was because that was when they would receive the State social welfare pension. This compares with only 6% of workers who had a pension. See table 4.2.
Expected main source of retirement income
In Quarter 4 2015, 42% of workers expected that an occupational or personal pension would be their main source of income when they retired compared to 41% of workers in the same period of 2009. See table 4.3 and figure 5.
Between Quarter 4 of 2009 and 2015:
In Quarter 4 2015, over three quarters (76%) of workers who were members of an occupational or personal pension scheme expected their pension to be their main source of retirement income while 12% of workers without a pension did not know what their main source of retirement income would be. There was a substantial increase in the percentage of workers without a pension who expected that the State social welfare pension would be their main source of income when they retired, from 43% in Q4 2009 to 57% in Q4 2015. This compares with 12% of workers who had pension coverage. See table 4.3.
| Table 4.1 Age of expected retirement of persons in employment (ILO) aged 20 to 69 years, Q4 2015 | |||||||||||
| % of persons aged 20-69 in employment | |||||||||||
| Age of expected retirement from paid work | |||||||||||
| Age Group | No intention to ever retire | Don't know1 | Unweighted sample2 | ||||||||
| <50 | 50-59 | 60-69 | 70+ | Total | |||||||
| State | 0.4 | 5.0 | 67.9 | 5.8 | 8.1 | 12.7 | 100.0 | 6,366 | |||
| Pension status | |||||||||||
| Has occupational or personal pension or both | 0.6 | 7.4 | 78.8 | 4.1 | 3.6 | 5.5 | 100.0 | 3,123 | |||
| Does not have an occupational or personal pension | 0.3 | 2.9 | 58.3 | 7.3 | 12.0 | 19.1 | 100.0 | 3,243 | |||
| Sex | |||||||||||
| Male | 0.5 | 3.9 | 66.6 | 7.9 | 10.3 | 10.8 | 100.0 | 2,850 | |||
| Female | 0.3 | 6.3 | 69.4 | 3.4 | 5.5 | 15.0 | 100.0 | 3,516 | |||
| Age group | |||||||||||
| 20-24 | 0.0 | 3.2 | 53.2 | 7.4 | 4.1 | 32.1 | 100.0 | 228 | |||
| 25-34 | 0.9 | 5.7 | 67.3 | 4.2 | 5.7 | 16.1 | 100.0 | 1,294 | |||
| 35-44 | 0.6 | 6.7 | 69.5 | 5.5 | 5.6 | 12.0 | 100.0 | 1,921 | |||
| 45-54 | 0.0 | 5.3 | 71.3 | 4.7 | 9.7 | 8.9 | 100.0 | 1,670 | |||
| 55-69 | 0.0 | 1.1 | 66.9 | 9.7 | 15.2 | 7.1 | 100.0 | 1,253 | |||
| Nationality | |||||||||||
| Irish nationals | 0.4 | 5.2 | 68.8 | 5.9 | 8.1 | 11.6 | 100.0 | 5,603 | |||
| Non-Irish nationals | 0.6 | 3.5 | 61.7 | 5.5 | 8.4 | 20.4 | 100.0 | 763 | |||
| ILO Employment Status | |||||||||||
| Self employed and Assisting relative | 0.2 | 2.8 | 44.4 | 13.8 | 25.2 | 13.6 | 100.0 | 1,112 | |||
| Employee | 0.5 | 5.5 | 72.8 | 4.1 | 4.6 | 12.6 | 100.0 | 5,254 | |||
| Hours of work | |||||||||||
| Full-time | 0.5 | 5.2 | 69.8 | 5.8 | 7.7 | 10.9 | 100.0 | 4612 | |||
| Part-time | 0.1 | 4.3 | 62.1 | 5.9 | 9.3 | 18.2 | 100.0 | 1754 | |||
| NACE Economic Sector | |||||||||||
| A | Agriculture, forestry and fishing | 0.9 | 1.5 | 34.3 | 14.9 | 34.6 | 13.7 | 100.0 | 332 | ||
| B-E | Industry | 0.2 | 3.0 | 74.3 | 5.4 | 5.5 | 11.6 | 100.0 | 720 | ||
| F | Construction | 1.6 | 2.3 | 62.7 | 7.8 | 12.4 | 13.1 | 100.0 | 288 | ||
| G | Wholesale and retail trade; repair of motor | ||||||||||
| vehicles and motorcycles | 0.5 | 3.0 | 66.2 | 6.4 | 6.9 | 17.0 | 100.0 | 815 | |||
| H | Transportation and storage | 0.0 | 2.2 | 70.0 | 5.3 | 13.9 | 8.5 | 100.0 | 265 | ||
| I | Accommodation and food service activities | 0.0 | 3.0 | 59.3 | 4.6 | 8.9 | 24.2 | 100.0 | 396 | ||
| J | Information and communication | 0.8 | 6.0 | 72.0 | 6.0 | 5.7 | 9.5 | 100.0 | 265 | ||
| K-L | Financial, insurance and real estate activities | 0.2 | 8.9 | 74.5 | 6.4 | 3.5 | 6.5 | 100.0 | 333 | ||
| M | Professional, scientific and technical activities | 0.5 | 2.2 | 71.5 | 8.2 | 8.4 | 9.1 | 100.0 | 378 | ||
| N | Administrative and support service activities | 0.0 | 4.6 | 66.4 | 4.7 | 7.7 | 16.7 | 100.0 | 226 | ||
| O | Public administration and defence; compulsory | ||||||||||
| social security | 1.4 | 16.3 | 75.1 | 1.6 | 0.3 | 5.3 | 100.0 | 359 | |||
| P | Education | 0.1 | 11.0 | 71.7 | 4.9 | 3.8 | 8.4 | 100.0 | 649 | ||
| Q | Human health and social work activities | 0.2 | 5.0 | 76.9 | 2.6 | 3.3 | 12.0 | 100.0 | 999 | ||
| R-U | Other NACE activities | 0.4 | 3.3 | 56.3 | 7.5 | 14.4 | 18.1 | 100.0 | 341 | ||
| 1Includes those who answered 'Don't know' or 'Not stated'. | |||||||||||
| 2Number of persons aged 20-69 in employment. | |||||||||||
| Data may be subject to sampling or other survey errors, which are greater in respect of smaller values or estimates of change. | |||||||||||
| Age Group | Employer rules on retirement age | Will receive social welfare pension | Will be able to afford to retire | That is when people usually retire | That is when partner/spouse receives pension | Personal reasons | Other | Don't know |
|---|---|---|---|---|---|---|---|---|
| 20-24 age group | 4.2 | 8.8 | 10 | 24.5 | 0 | 10.6 | 4.3 | 37.6 |
| 25-34 age group | 12.1 | 13.2 | 15.5 | 26.4 | 0.3 | 6.3 | 3.6 | 22.6 |
| 35-44 age group | 16.2 | 10.4 | 20.2 | 23.4 | 1 | 8 | 2.6 | 18.2 |
| 45-54 age group | 17.5 | 15.2 | 17.9 | 17.3 | 1.1 | 8.7 | 3.1 | 19 |
| 55-69 age group | 19.1 | 17.8 | 12.9 | 12.9 | 0.9 | 10.4 | 3.7 | 22.4 |
| Table 4.2 Reason for expected age of retirement of persons in employment (ILO) aged 20 to 69 years, Q4 2015 | |||||||||||||
| % of persons aged 20-69 in employment | |||||||||||||
| Reason for expected age of retirement from paid work | |||||||||||||
| Employer rules on retirement age | Will receive social welfare pension | Will be able to afford to retire | It is when people usually retire | It's when partner/spouse receives pension | |||||||||
| Personal reasons | Other | Don't know1 | Unweighted | ||||||||||
| Total | sample2 | ||||||||||||
| State | 15.2 | 13.4 | 16.6 | 21.1 | 0.8 | 8.3 | 3.3 | 21.4 | 100.0 | 6,366 | |||
| Expected age of retirement | |||||||||||||
| <50 | * | * | * | * | * | * | * | * | 100.0 | 22 | |||
| 50-59 | 8.7 | 1.6 | 43.1 | 4.0 | 0.8 | 30.3 | 11.3 | 0.2 | 100.0 | 340 | |||
| 60-69 | 21.2 | 19.0 | 18.0 | 29.6 | 1.1 | 7.5 | 2.8 | 0.8 | 100.0 | 4,389 | |||
| 70+ | 5.2 | 6.8 | 35.2 | 12.8 | 0.0 | 26.5 | 12.7 | 0.8 | 100.0 | 359 | |||
| No intention to ever retire | 0.0 | 0.0 | 0.3 | 0.0 | 0.0 | 0.1 | 0.7 | 98.9 | 100.0 | 518 | |||
| Don't know1 | 0.0 | 0.0 | 0.0 | 0.0 | 0.0 | 0.0 | 0.0 | 100.0 | 100.0 | 738 | |||
| Sex | |||||||||||||
| Male | 16.0 | 13.1 | 15.8 | 22.0 | 0.9 | 8.2 | 3.0 | 21.0 | 100.0 | 3,516 | |||
| Female | 14.6 | 13.6 | 17.4 | 20.2 | 0.7 | 8.4 | 3.5 | 21.7 | 100.0 | 2,850 | |||
| Age group | |||||||||||||
| 20-24 | 4.2 | 8.8 | 10.0 | 24.5 | 0.0 | 10.6 | 4.3 | 37.6 | 100.0 | 228 | |||
| 25-34 | 12.1 | 13.2 | 15.5 | 26.4 | 0.3 | 6.3 | 3.6 | 22.6 | 100.0 | 1,294 | |||
| 35-44 | 16.2 | 10.4 | 20.2 | 23.4 | 1.0 | 8.0 | 2.6 | 18.2 | 100.0 | 1,921 | |||
| 45-54 | 17.5 | 15.2 | 17.9 | 17.3 | 1.1 | 8.7 | 3.1 | 19.0 | 100.0 | 1,670 | |||
| 55-69 | 19.1 | 17.8 | 12.9 | 12.9 | 0.9 | 10.4 | 3.7 | 22.4 | 100.0 | 1,253 | |||
| Nationality | |||||||||||||
| Irish nationals | 16.2 | 13.7 | 17.4 | 20.1 | 0.8 | 8.3 | 3.2 | 20.2 | 100.0 | 5,603 | |||
| Non-Irish nationals | 8.6 | 11.3 | 11.3 | 27.2 | 0.4 | 7.8 | 3.9 | 29.5 | 100.0 | 763 | |||
| ILO Employment Status | |||||||||||||
| Self employed and Assisting relative | 0.7 | 13.4 | 19.5 | 10.7 | 1.1 | 11.1 | 4.2 | 39.3 | 100.0 | 1,112 | |||
| Employee | 18.2 | 13.3 | 16.0 | 23.2 | 0.7 | 7.7 | 3.1 | 17.7 | 100.0 | 5,254 | |||
| Hours of work | |||||||||||||
| Full-time | 17.7 | 11.3 | 18.5 | 21.3 | 0.6 | 8.3 | 3.1 | 19.2 | 100.0 | 4,612 | |||
| Part-time | 7.8 | 19.5 | 11.2 | 20.3 | 1.2 | 8.3 | 3.7 | 28.1 | 100.0 | 1,754 | |||
| Pension status | |||||||||||||
| Has occupational or personal pension or both | 27.5 | 6.2 | 22.7 | 21.4 | 0.8 | 9.0 | 3.0 | 9.5 | 100.0 | 3,123 | |||
| Does not have a pension | 4.5 | 19.6 | 11.4 | 20.7 | 0.8 | 7.7 | 3.5 | 31.8 | 100.0 | 3,243 | |||
| 1Includes those who answered 'Don't know' or 'Not stated'. | |||||||||||||
| 2Number of persons aged 20-69 in employment. | |||||||||||||
| *Sample occurrence too small for estimation. | |||||||||||||
| Data may be subject to sampling or other survey errors, which are greater in respect of smaller values or estimates of change. | |||||||||||||
| Table 4.3 Persons in employment (ILO) aged 20 to 69 years classified by main expected source of income on retirement, Q4 2009 and Q4 2015 | |||||||||||||||||
| % of persons aged 20-69 in employment | |||||||||||||||||
| Occupational or personal pension | Spouse or partner's occupational or personal pension | State social welfare pension | Savings or investments, sale of business, farm or other property | ||||||||||||||
| Don’t know1 | Unweighted sample2 | ||||||||||||||||
| Other | |||||||||||||||||
| Expected main source of income on retirement | Q4 2009 | Q4 2015 | Q4 2009 | Q4 2015 | Q4 2009 | Q4 2015 | Q4 2009 | Q4 2015 | Q4 2009 | Q4 2015 | Q4 2009 | Q4 2015 | Q4 2009 | Q4 2015 | |||
| State | 40.8 | 41.6 | 5.4 | 5.5 | 25.8 | 36.2 | 7.1 | 6.8 | 0.8 | 2.0 | 20.2 | 7.8 | 5,017 | 6,366 | |||
| Pension status | |||||||||||||||||
| Has occupational or personal pension or both | 72.5 | 75.8 | 4.9 | 4.4 | 9.6 | 12.3 | 4.1 | 4.1 | 0.5 | 0.5 | 8.5 | 3.0 | 2,632 | 3,123 | |||
| Does not have an occupational or personal pension | 7.6 | 11.6 | 5.9 | 6.4 | 42.7 | 57.2 | 10.3 | 9.2 | 1.2 | 3.4 | 32.5 | 12.1 | 2,385 | 3,243 | |||
| Sex | |||||||||||||||||
| Male | 44.3 | 43.8 | 1.6 | 2.1 | 24.0 | 36.3 | 9.1 | 8.7 | 1.1 | 2.1 | 19.9 | 7.0 | 2,830 | 2,850 | |||
| Female | 36.8 | 39.1 | 9.7 | 9.3 | 27.8 | 36.1 | 4.7 | 4.6 | 0.5 | 1.9 | 20.5 | 8.9 | 2,187 | 3,516 | |||
| Age group | |||||||||||||||||
| 20-24 | 24.8 | 23.6 | 1.7 | 1.5 | 16.0 | 29.1 | 5.5 | 7.3 | 0.0 | 4.2 | 52.1 | 34.4 | 252 | 228 | |||
| 25-34 | 42.2 | 40.3 | 4.2 | 4.0 | 18.9 | 33.2 | 7.4 | 8.2 | 0.6 | 2.7 | 26.7 | 11.6 | 1,434 | 1,294 | |||
| 35-44 | 43.9 | 48.1 | 6.5 | 6.4 | 25.0 | 31.7 | 7.2 | 6.8 | 0.9 | 1.5 | 16.6 | 5.4 | 1,468 | 1,921 | |||
| 45-54 | 45.6 | 43.0 | 7.1 | 7.0 | 28.7 | 38.6 | 6.8 | 5.9 | 0.9 | 2.0 | 10.9 | 3.5 | 1,150 | 1,670 | |||
| 55-69 | 34.3 | 37.1 | 5.4 | 5.4 | 44.1 | 47.8 | 7.6 | 5.8 | 1.5 | 1.2 | 7.1 | 2.6 | 713 | 1,253 | |||
| Nationality | |||||||||||||||||
| Irish nationals | 43.6 | 43.6 | 5.6 | 5.8 | 26.9 | 35.8 | 7.2 | 6.5 | 0.7 | 1.5 | 16.0 | 6.7 | 4,405 | 5,603 | |||
| Non-Irish nationals | 22.8 | 28.6 | 3.6 | 3.1 | 18.0 | 38.6 | 6.6 | 8.9 | 1.2 | 5.6 | 47.8 | 15.3 | 612 | 763 | |||
| Hours of work | |||||||||||||||||
| Full-time | 48.0 | 49.5 | 3.8 | 3.6 | 20.7 | 30.4 | 7.6 | 7.5 | 0.7 | 1.9 | 19.2 | 7.1 | 3,701 | 4,612 | |||
| Part-time | 17.1 | 18.2 | 10.5 | 11.0 | 42.3 | 53.5 | 5.5 | 4.9 | 1.1 | 2.5 | 23.4 | 9.9 | 1,316 | 1,754 | |||
| ILO Employment Status | |||||||||||||||||
| Self employed and Assisting relative | 27.7 | 25.2 | 4.7 | 6.5 | 28.4 | 42.7 | 18.8 | 16.1 | 1.3 | 3.2 | 19.1 | 6.3 | 850 | 1,112 | |||
| Employee | 43.7 | 45.0 | 5.5 | 5.3 | 25.2 | 34.9 | 4.5 | 4.9 | 0.7 | 1.8 | 20.4 | 8.2 | 4,167 | 5,254 | |||
| 1Includes those who answered 'Don't know' or 'Not stated'. | |||||||||||||||||
| 2Number of persons aged 20-69 in employment. | |||||||||||||||||
| Data may be subject to sampling or other survey errors, which are greater in respect of smaller values or estimates of change. | |||||||||||||||||
| Expected source of income on retirement | Q4 2015 |
|---|---|
| Occupational or personal pension | 41.6 |
| Spouse/partner's occupational or personal pension | 5.5 |
| State social welfare pension | 36.2 |
| Savings/investments/sale of business, farm or property | 6.8 |
| Other | 2 |
| Don't know | 7.8 |
| Annex 1.1 Unweighted sample for persons in employment (ILO) aged 20 to 69 years, 2005-20151 | |||||||||
| Q1 2005 | Q4 2005 | Q1 2007 | Q1 2008 | Q4 2009 | Q4 2015 | ||||
| State | 15,901 | 15,152 | 12,718 | 5,855 | 5,017 | 6,366 | |||
| Sex | |||||||||
| Male | 7,820 | 7,246 | 5,994 | 2,678 | 2,187 | 2,850 | |||
| Female | 8,081 | 7,906 | 6,724 | 3,177 | 2,830 | 3,516 | |||
| Age group | |||||||||
| 20-24 | 1,304 | 959 | 803 | 328 | 252 | 228 | |||
| 25-34 | 3,943 | 3,590 | 3,011 | 1,306 | 1,434 | 1,294 | |||
| 35-44 | 4,604 | 4,514 | 3,597 | 1,707 | 1,468 | 1,921 | |||
| 45-54 | 3,823 | 3,799 | 3,217 | 1,494 | 1,150 | 1,670 | |||
| 55-69 | 2,227 | 2,290 | 2,090 | 1,020 | 713 | 1,253 | |||
| 20-292 | 3,067 | 2,431 | 2,153 | 928 | 872 | 665 | |||
| 30-652 | 12,668 | 12,583 | 10,412 | 4,849 | 4,103 | 5,587 | |||
| Nationality | |||||||||
| Irish nationals | 14,786 | 14,100 | 11,441 | 5,241 | 4,405 | 5,603 | |||
| Non-Irish nationals | 1,115 | 1,052 | 1,277 | 614 | 612 | 763 | |||
| ILO Employment Status | |||||||||
| Self employed and Assisting relative | 2,814 | 2,563 | 2,263 | 1,219 | 850 | 1,112 | |||
| Employee | 13,087 | 12,589 | 10,455 | 4,636 | 4,167 | 5,254 | |||
| Hours of work | |||||||||
| Full-time | 12,434 | 11,873 | 9,835 | 4,451 | 3,701 | 4,612 | |||
| Part-time | 3,467 | 3,279 | 2,883 | 1,404 | 1,316 | 1,754 | |||
| NACE Economic Sector | |||||||||
| A | Agriculture, forestry and fishing | 881 | 770 | 749 | 386 | 230 | 332 | ||
| B-E | Industry | 2,231 | 2,015 | 1,723 | 746 | 600 | 720 | ||
| F | Construction | 1,287 | 1,200 | 1,151 | 471 | 283 | 288 | ||
| G | Wholesale and retail trade; repair of motor vehicles and motorcycles | 1,957 | 1,890 | 1,582 | 750 | 634 | 815 | ||
| H | Transportation and storage | 740 | 714 | 567 | 246 | 211 | 265 | ||
| I | Accommodation and food service activities | 902 | 773 | 666 | 312 | 338 | 396 | ||
| J | Information and communication | 559 | 545 | 348 | 146 | 180 | 265 | ||
| K-L | Financial, insurance and real estate activities | 793 | 799 | 555 | 277 | 251 | 333 | ||
| M | Professional, scientific and technical activities | 860 | 718 | 564 | 300 | 239 | 378 | ||
| N | Administrative and support service activities | 551 | 549 | 437 | 242 | 176 | 226 | ||
| O | Public administration and defence; compulsory social security | 873 | 982 | 732 | 358 | 300 | 359 | ||
| P | Education | 1,347 | 1,416 | 1,240 | 549 | 509 | 649 | ||
| Q | Human health and social work activities | 1,936 | 1,928 | 1,791 | 783 | 790 | 999 | ||
| R-U | Other NACE activities | 984 | 853 | 613 | 289 | 276 | 341 | ||
| Broad occupational group | |||||||||
| 1. | Managers, directors and senior officials | : | : | : | 382 | 349 | 514 | ||
| 2. | Professionals | : | : | : | 1,044 | 996 | 1,276 | ||
| 3. | Associate professional and technical | : | : | : | 557 | 491 | 809 | ||
| 4. | Administrative and secretarial | : | : | : | 843 | 724 | 789 | ||
| 5. | Skilled trades | : | : | : | 1,023 | 711 | 861 | ||
| 6. | Caring, leisure and other services | : | : | : | 507 | 490 | 630 | ||
| 7. | Sales and customer service | : | : | : | 411 | 381 | 453 | ||
| 8. | Process, plant and machine operatives | : | : | : | 420 | 294 | 412 | ||
| 9. | Elementary | : | : | : | 656 | 571 | 605 | ||
| Other/Not stated | 12 | 10 | 17 | ||||||
| 1Results from 2005 to 2008 are based on seasonal QNHS quarters. The 2009 survey was conducted after the introduction of calendar | |||||||||
| quarters to the QNHS. | |||||||||
| 2These age categories relate to the targets set by the National Pensions Policy Initiative. | |||||||||
| 3'Broad occupational group' is classified in accordance with the UK SOC2010 occupation classification. This breakdown is available in this table | |||||||||
| from Q1 2008 onwards. See Background Notes for more details. | |||||||||
| : Not available. | |||||||||
Reference period
A module on pensions was included in the Quarterly National Household Survey (QNHS) in the three months from October to December 2015 (Quarter 4).
Prior to the Quarter 4 2015 module, the most recent module on pension provision was carried out in 2009 (Quarter 4). In 2009, the QNHS moved from seasonal to calendar quarters and the Quarter 4 2009 pensions module was conducted from October to December 2009. Questions on pension provision were also included in the QNHS in 2005, 2007 and 2008 when the QNHS was carried out on a seasonal quarter basis. Questions on pension provision were included in the QNHS in the three months from December to February 2005, 2007 and 2008. A module on pensions was also included in the three months from September to November 2005.
Purpose of survey
The QNHS began in September 1997, replacing the annual April Labour Force Survey (LFS). The purpose of the survey is the production of quarterly labour force estimates and occasional reports on special social topics. The survey meets the requirements of Council Regulation (EC) No. 577/98, adopted in March 1998, which requires the introduction of quarterly labour force surveys in EU member states.
For further details on the QNHS, see: http://www.cso.ie/en/qnhs/abouttheqnhs/
Questionnaire
The Pensions questionnaire was answered by all persons aged 20 to 69 years who were in employment in the reference week. The module was included on waves 2 to 5 of the QNHS sample. The section on 'Sample Design' below details how the sample was selected.
The module results are based on responses from 6,366 respondents.
A copy of the questionnaire used in this module is available on the CSO website at Pensions Module Q4 2015 (PDF 447KB) .
Individual reference person
The QNHS Pensions Module was asked of one reference person in each participating household, who was in employment, and aged between 20 and 69 years on waves 2 to 5.
Data collection
Information is collected on laptop computers, using computer-assisted personal interview (CAPI) software.
Sample design
A two-stage sample design is used. A new sample was introduced in Q4 2012 following the 2011 Census of Population. The sample frame of households is clustered into blocks (small areas) with each block containing a minimum of 60 occupied households on the night of the 2011 Census of Population. The sample frame is stratified using administrative county and population density. In the first stage, 1,300 blocks are selected using Probability Proportional to Size (PPS) sampling and in the second stage, 20 households are selected using Simple Random Sampling (SRS). This ensures that each household in the sample frame has an equal probability of selection and results in a total quarterly sample of 26,000 households. The actual achieved sample varies over time depending on the level of response.
Each household selected for the QNHS is surveyed for five consecutive quarters. The first quarter that a household is surveyed is referred to as wave one, the second wave two etc. When households have been surveyed for five consecutive quarters, they are then replaced by other households in the same block. Thus, one fifth of the households in the survey are replaced each quarter and the QNHS sample involves an overlap of 80% between consecutive quarters and 20% between the same quarter in consecutive years. As the new sample based on the 2011 Census of Population was introduced incrementally across each quarter from Q4 2012 to Q4 2013, the new sample is fully effective from Q4 2013.
Householders are not asked to participate in the module in their first quarter participating in the survey. This is primarily to minimise response burden on the householders.
The survey results are weighted to agree with population estimates broken down by age, sex and region and are also calibrated to nationality control totals. The population estimates for April of each year are published in a separate release: http://www.cso.ie/en/releasesandpublications/er/pme/populationandmigrationestimatesapril2015/
Statistical significance
All estimates based on sample surveys are subject to error, some of which is measurable. Where an estimate is statistically significantly different from another estimate, it means that we can be 95% confident that differences between those two estimates are not due to sampling error. Unless otherwise stated, changes and differences mentioned in the text have been found to be statistically significant at the 95% confidence level.
Reliability of estimates presented
In general for QNHS modules, estimates of the number of persons where there are fewer than 30 persons in a cell are too small to be considered reliable. These estimates are presented with an asterisk (*) in the relevant tables.
Where there are 30-49 persons in a cell, estimates are considered to have a wide margin of error and should be treated with caution. These cells are presented with parentheses [ ].
Note on tables
The row or column percentages in tables may not add to 100% due to rounding.
Through the State Social Welfare system, people are entitled to a basic flat rate pension. See the note on 'State Pensions' below. However, in many cases, there is a need for additional pension cover if the standard of living enjoyed while at work is to be maintained into retirement. This additional or supplementary cover is provided through occupational pension schemes and/or personal pension arrangements. It is this additional cover which is the focus of this survey. The survey results presented in this statistical release do not cover pensions paid through the State Social Welfare system.
State pensions
The State currently provides two types of retirement pension: State Pension (Contributory) and State Pension (Non-Contributory).
The State pension age is currently age 66, but this is changing in the coming years. The Social Welfare and Pensions Act 2011 made a number of changes to the qualifying age for State pensions. The qualifying age will rise to 67 in 2021 and 68 in 2028.
The State Pension (Contributory) is payable at age 66 (age 67 from 2021, age 68 from 2028) to people who have enough Irish social insurance contributions and is not means-tested.
The State Pension (Non-Contributory) previously known as the Old Age (Non-Contributory) Pension is payable at age 66 (age 67 from 2021, age 68 from 2028). The means-tested State Pension (Non-Contributory) is a payment for people aged 66 and over who do not qualify for a State Pension (Contributory) or who only qualify for a reduced contributory pension based on their PRSI contribution record.
Occupational pension scheme
Occupational pension schemes refer to employer-sponsored occupational pension schemes or relevant public sector scheme. There are two types of occupational pension scheme:
Defined contribution - employee's pension contributions are put into a fund, the value of which changes over time. The pension will depend on the size of this fund when the person retires. These type of pensions are sometimes called ‘defined contribution’ or ‘money purchase’.
Defined benefit - the employee's pension is based on a formula involving age, years of service and salary. These type of pensions are sometimes called ‘defined benefit‘.
The corresponding question asked on the QNHS Pensions Module questionnaire was as follows:
Please look at the pensions described on this showcard. Is your pension more like Type A or Type B?
It should be noted that in previous pension modules, a small number of self-employed respondents who had an occupational pension were not included in the overall rate of pension cover. The series has been revised from 2005 to include these cases in the overall pension rate. Previously published figures for 2002 and 2004 are not directly comparable to the revised series.
Personal pension scheme
If a person is not covered by an occupational pension scheme, s/he may be able to take out a personal private pension scheme, also known as a retirement annuity contract (RAC)1. In fact, persons with occupational pension coverage may also have a personal private pension.
1A Retirement Annuity Contract “RAC” is the formal name for what is more commonly called a personal pension. An RAC is an individual defined contribution pension arrangement.
National Pensions Policy Initiative (NPPI)
The National Pensions Policy Initiative was launched in October 1996 to facilitate debate on how to achieve a fully developed national pension system and to formulate a strategy and make recommendations for actions needed to achieve this system. For more information, please refer to:
http://www.pensionsauthority.ie/en/publications/information_booklets/securing_retirement_income1.pdf
One of the targets of this Initiative was that supplementary pension coverage would be needed for 70% of the working population aged 30 years and over by the year 2013.
National Pensions Framework
The National Pensions Framework was published on 3 March 2010 and sets out the Government’s plans for reform of the Irish pension system. It encompasses all aspects of pensions, from social welfare to private occupational pensions and public sector pension reform and is available at: http://www.welfare.ie/en/Pages/234_National-Pensions-Framework.aspx
Development of the Framework was informed by the range of views raised during the Green Paper consultation process. The Green Paper (published in October 2007) sets out the position in relation to social welfare, occupational, personal and public service pensions and is available at: http://www.welfare.ie/en/downloads/greenpaper.pdf
Pensions Authority
The Pensions Authority (formerly known as the Pensions Board) provides for the proper administration of pension schemes and the protection of pension rights for people living in Ireland. The Authority is the regulatory body for occupational pension schemes and Personal Retirement Savings Accounts (PRSAs) and also has a role in the development of pension policy in general. Under the Social Welfare and Pensions (Miscellaneous Provisions) Act 2013, the Pensions Board was renamed the Pensions Authority and its Chief Executive became the Pensions Regulator. These changes took effect from 7 March 2014.
NACE industrial classification
The QNHS sectoral employment figures are based on the EU NACE Rev. 2 (Nomenclature statistique des activités économiques dans la Communauté européenne) classification as defined in Council Regulation (EC) no 1893/2006. Fourteen NACE sub-categories are distinguished in this release. From Q1 2009, NACE Rev. 2 has been adopted as the primary classification of industrial sectors for use in QNHS outputs. From Q4 1997 to Q4 2008, the NACE Rev. 1.1 classification had been in use.
NACE Rev. 2 classification is more detailed than the NACE Rev. 1.1 classification. In particular more sections are now identified for services activities with the aim of better capturing economic activity within services. In cases where there is a direct one to one correspondence (e.g. section H ‘Hotels and restaurants’ in NACE Rev. 1.1 directly corresponds to section I ‘Accommodation and food service activities’ sector in NACE Rev. 2) then the two different series can be expected to be broadly comparable.
However, the series will not be exactly the same, as the process of applying NACE Rev. 2 involved a very detailed recoding process whereby the new NACE classification was applied to each record in each quarter. The detailed nature of this process means it should be expected that even in the case of a one-to-one correspondence between a NACE Rev. 2 and NACE Rev. 1.1 section; minor differences in the level of the estimates may be seen.
Occupation classification
As a result of changes to the European regulations governing the Quarterly Labour Force Survey (implemented in Ireland using the QNHS), the CSO is obliged to report occupational coding data to Eurostat based on the new Europe-wide classification ISCO-08 from Q1 2011 onwards. To allow this requirement to be met, the CSO has changed to using UK SOC2010 as the primary classification used in collecting the data. ISCO-08 is then derived from UK SOC2010.
The previously used classification for publication purposes in Ireland was UK SOC1990 and this cannot be directly compared to the new UK SOC2010 classification as all occupations have been reclassified accordingly. This newer classification reflects the evolution over a period of time of certain occupational areas which were developing rapidly, both in terms of their scale and the complexity of work organisation.
Further information regarding SOC 2010 is available at the following link: http://www.cso.ie/shorturl.aspx/104
ILO labour force classification
The primary classification used for the QNHS results is the ILO (International Labour Office) labour force classification. Labour Force Survey data on this basis have been published since 1988. The ILO classification distinguishes the following main subgroups of the population aged 15 or over as follows:
Persons who worked in the week before the survey for one hour or more for payment or profit, including work on the family farm or business and all persons who had a job but were not at work because of illness, holidays etc. in the week.
The ILO classification distinguishes the following main subgroups of the population aged 15 or over:
In employment: Persons who worked in the week before the survey for one hour or more for payment or profit, including work on the family farm or business and all persons who had a job but were not at work because of illness, holidays etc. in the week.
Unemployed: Persons aged 15 to 74 years who, in the week before the survey, were without work and available for work within the next two weeks, and had taken specific steps, in the preceding four weeks, to find work. It should be noted that as per Eurostat’s operational implementation, the upper age limit for classifying a person as unemployed is 74 years.
Inactive population (not in labour force): All other persons.
The labour force comprises persons employed plus unemployed.
Full-time / part-time employment
Whether a respondent is described as in full-time or part-time employment is self determined. The respondent's answer to the following question is used:
“Thinking about the hours of work in the job, would you describe it as full-time or part-time?”
While the main purpose of the QNHS is the production of quarterly labour force estimates, there is also a provision for the collection of data on social topics through the inclusion of special survey modules. The selection of the major national modules undertaken to date has been largely based on the results of a canvass of users (over 100 organisations) that was conducted by the CSO in 1996, 2002, 2006, 2008 and most recently 2011. The results of the canvass are presented to the National Statistics Board and they are asked to indicate their priorities for the years ahead.
The schedule for social modules in any given year is based on the following structure:
Quarter 1 Accidents and Illness module and Information, Communication and Technology (ICT) Survey
Quarter 2 EU module (always covered under EU legislation)
Quarter 3 National module
Quarter 4 National module
The table below outlines the social modules published to date in the QNHS
Reference quarter Social module
Q3 2014 Equality Module
Q2 2014 Environment Module
Q3 2013 Volunteering and Wellbeing Module
Q2 2013 Sports Module
Q2 2012 Retirement Planning
Q2 2012 Parental Involvement in Children’s Education
Q3 2012 Effect on Households of the Economic Downturn
Q2 2010 Cross Border Shopping
Q2 2010 Educational Attainment
Q1 2010 Crime and Victimisation
Q3 2009 Caring
Q2 2009 Union Membership
Q2 2009 Cross Border Shopping
Q3 2008 Lifelong learning
Q1 2008 Pension provision
Q4 2007 Childcare
Q3 2007 Health
Q2 2007 Union Membership
Q1 2007 Work-related Accidents and Illnesses (Q1 2003 – Q1 2007)
Q1 2007 ICT household survey
Q4 2006 Crime and Victimisation
Q3 2006 Sport and physical exercise
Q1 2006 ICT household survey
Q4 2005 Pension provision
Q4 2005 Special Saving Incentive Accounts (SSIAs)
Q3 2005 ICT household survey
Q3 2005 Recycling and energy conservation
Q2 2005 Reconciliation between work and family life
Q2 2005 Educational attainment
Q1 2005 Childcare
Q4 2004 Equality
Q3 2004 ICT household survey
Q2 2004 Union Membership
Q2 2004 Work organisation and working time
Q4 2003 Crime and Victimisation
Q3 2003 Housing
Q3 2003 ICT household survey
 Hide Background Notes
Scan the QR code below to view this release online or go to
http://www.cso.ie/en/releasesandpublications/er/q-penp/qnhsmoduleonpensionsq42015/
 Show Table 1.1 Pension coverage in the State for persons in employment (ILO) aged 20 to 69 years, 2005-2015
 Hide Table 1.1 Pension coverage in the State for persons in employment (ILO) aged 20 to 69 years, 2005-2015