| General Government Debt, Deficit and Net Worth | ||||||
| General Government Gross Debt | General Government Deficit | Net Worth | ||||
| End of year | €m | % GDP | €m | % GDP | €m | % GDP |
| 2009 | 104,544 | 64.8 | -22,368 | -13.9 | 19,919 | 12.4 |
| 2010 | 144,164 | 92.1 | -48,274 | -30.8 | -14,242 | -9.1 |
| 2011 | 169,226 | 106.4 | -21,268 | -13.4 | -47,232 | -29.7 |
| 2012 | 192,461 | 117.6 | -12,461 | -7.6 | -77,283 | -47.2 |

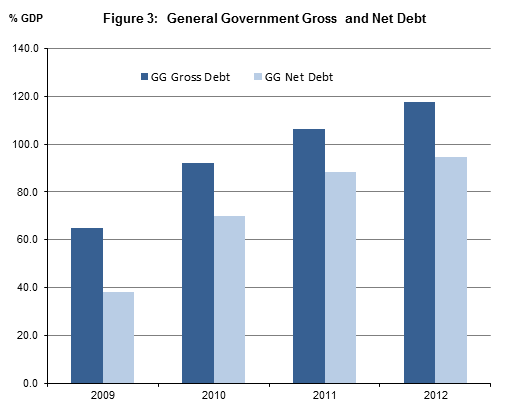
The General Government Deficit for Ireland was €12,461 million, representing 7.6% of GDP in 2012. This compares with the 2009 level of €22,368 million (13.9% of GDP). General Government Debt rose over the same period from 64.8% of GDP in 2009 to 117.6% of GDP by 2012. The net worth of General Government decreased from €19,919 million in 2009 to -€77,283 million in 2012.
General Government Deficit
Ireland’s General Government Deficit has been in excess of the Stability and Growth Pact limit of 3% of GDP since 2008. The very large government interventions related to the banking crisis caused the deficit to peak in 2010 at nearly 31% of GDP. Since then the level of the deficit has been decreasing, reaching 7.6% of GDP in 2012.
Government revenue (the main component of which is taxes and social contributions) has remained fairly stable over the period 2009-2012, while there has been greater variation in government expenditure in these years. In particular, capital transfers (to financial institutions) represented an unusually large element of expenditure in 2010, resulting in the spike in the deficit for that year. The overall impact of the financial crisis on the deficit for the period is shown in Figure 2 and Table 1.

General Government Gross Debt (GG Debt) has risen from 64.8% of GDP (higher than the Stability and Growth Pact limit of 60% of GDP) in 2009 to 117.6% of GDP in 2012. GG Debt as reported under the Excessive Deficit Procedure comprises specific financial instruments (currency and deposits, securities other than shares, excluding financial derivatives, and loans), recorded at face value. As it is a gross figure, no financial assets are deducted in its calculation. A Net General Government Debt figure (obtained by deducting the corresponding financial assets to those liabilities used in the calculation of GG Debt) is reported in Table 2. This shows that Ireland’s net government debt rose from 38.8% of GDP in 2009 to 93.1% in 2012. The movement between National Debt and General Government Gross Debt is shown in Table 9.
General Government net worth (non-financial assets plus financial assets less liabilities) fell from +€19,919 million in 2009 to -€77,283 million in 2012, largely caused by the rapid increase in GG Debt.
At the end of 2012 the value of government assets stood at €130.5 billion (including financial assets of €72.9billion), while liabilities amounted to €207.7 billion (Table 2).
The cumulative impact on government net worth of the banking interventions over the period 2009-2012 was -€46.5 billion.
| Table 1 General Government transactions: revenue, expenditure, financing and deficit | |||||
| €million | |||||
| Description | ESA code | 2009 | 2010 | 2011 | 2012 |
| General Government transactions | |||||
| Revenue | TR | 56,020 | 55,120 | 55,414 | 56,594 |
| Taxes and social contributions | 47,910 | 46,318 | 47,877 | 49,202 | |
| Taxes | D2 + D5 + D91 | 35,924 | 34,843 | 37,626 | 39,694 |
| Social contributions | D61 | 11,986 | 11,475 | 10,251 | 9,508 |
| Sales of goods and services | P1O | 4,543 | 5,241 | 5,086 | 4,868 |
| Investment income | D4 | 1,985 | 2,113 | 2,000 | 2,256 |
| Current transfer revenue | D7 | 151 | 126 | 65 | 65 |
| Capital transfer revenue | D9n | 1,431 | 1,323 | 386 | 203 |
| Expenditure | TE | 78,384 | 103,404 | 76,548 | 68,833 |
| Expense | 74,936 | 100,553 | 74,922 | 68,447 | |
| Compensation of employees | D1 | 20,705 | 19,284 | 19,113 | 18,784 |
| Use of goods and services plus taxes payable | P2 + D5 + D29 | 10,363 | 9,347 | 8,892 | 8,564 |
| Depreciation (Consumption of fixed capital) | K1 | 2,636 | 2,575 | 2,517 | 2,313 |
| Interest (excluding FISIM) | D41 | 3,290 | 4,984 | 5,190 | 5,912 |
| Subsidies | D3 | 893 | 879 | 639 | 639 |
| Social benefits | D62 + D631 | 28,344 | 28,181 | 28,768 | 28,666 |
| Other current transfers | D7 | 3,089 | 2,439 | 2,323 | 2,251 |
| Capital transfers | D9 | 5,617 | 32,864 | 7,478 | 1,317 |
| Net operating balance | -18,915 | -45,433 | -19,508 | -11,853 | |
| Net acquisition of non-financial assets | P5 + NP - K1 | 3,448 | 2,851 | 1,627 | 387 |
| Net lending (+) / net borrowing (-) | B9 | -22,363 | -48,284 | -21,134 | -12,240 |
| equals | |||||
| Net acquisition of financial assets | 3,109 | -7,614 | 3,121 | 10,337 | |
| Debt instruments | F2 + F33 + F4 | 5,044 | -8,872 | -681 | 8,605 |
| Shares and other equity | F5 | -2,357 | 1,430 | 3,583 | 1,815 |
| Other financial assets | F34 + F61 + F62 + F7 | 422 | -172 | 219 | -83 |
| less | |||||
| Net incurrence of liabilities | 25,472 | 40,670 | 24,255 | 22,577 | |
| Debt instruments | F2 + F33 + F4 | 26,064 | 41,199 | 24,428 | 22,692 |
| Other liabilities | F34 + F5 + F61 + F62 + F7 | -592 | -529 | -173 | -115 |
| General Government Deficit | |||||
| Net lending / net borrowing | B9 | -22,363 | -48,284 | -21,134 | -12,240 |
| Adjustment for swaps | -4 | 9 | -134 | -221 | |
| General Government Surplus/Deficit | EDP_B9 | -22,368 | -48,274 | -21,268 | -12,461 |
| Deficit impact of banking crisis interventions | -3,767 | -31,545 | -5,732 | 1,603 | |
| Underlying deficit excluding banking crisis interventions | -18,601 | -16,730 | -15,537 | -14,064 | |
| Table 2 General Government: Net Worth, Gross and Net Debt | |||||
| €million | |||||
| Description | ESA code | 2009 | 2010 | 2011 | 2012 |
| General Government net worth | |||||
| Net worth at market value, excluding pension liabilities | 19,919 | -14,242 | -47,232 | -77,283 | |
| equals | |||||
| Non-financial assets at market value | 61,020 | 58,425 | 57,148 | 57,535 | |
| plus | |||||
| Financial net worth at market value, excluding pension liabilities | -41,101 | -72,667 | -104,380 | -134,818 | |
| equals | |||||
| Financial assets at market value | 72,657 | 65,407 | 62,743 | 72,926 | |
| EDP debt instruments | AF2 + AF33 + AF4 | 41,950 | 32,908 | 30,839 | 40,088 |
| Shares and other equity | AF5 | 21,712 | 23,750 | 22,581 | 23,895 |
| Other financial assets | AF34 + AF61 + AF62 + AF7 | 8,995 | 8,749 | 9,323 | 8,943 |
| less | |||||
| Liabilities at market value | 113,758 | 138,074 | 167,123 | 207,744 | |
| EDP debt instruments | AF2 + AF33 + AF4 | 107,816 | 132,639 | 161,089 | 201,105 |
| Other liabilities | AF34 + AF61 + AF62 + AF7 | 5,942 | 5,435 | 6,034 | 6,639 |
| Memo: Estimated pension liabilities of government | 116,000 | 116,000 | 116,000 | 116,000 | |
| Memo: Net worth, including pension liabilities | -96,081 | -130,242 | -163,232 | -193,283 | |
| Contingent liabilities | 286,263 | 162,076 | 147,241 | 119,306 | |
| Memo: Net worth, including pension liabilities and contingent liabilities | -382,344 | -292,318 | -310,473 | -312,589 | |
| General Government: changes in net worth | |||||
| Opening net worth | 46,683 | 19,919 | -14,242 | -47,232 | |
| Net acquisition of non-financial assets | 3,448 | 2,851 | 1,627 | 387 | |
| Net lending/net borrowing | -22,363 | -48,284 | -21,134 | -12,240 | |
| Change in net worth due to other economic flows | -7,849 | 11,273 | -13,483 | -18,198 | |
| Other changes in non-financial assets | -11,725 | -5,445 | -2,904 | 0 | |
| Other changes in financial assets | 3,333 | 364 | -5,785 | -154 | |
| Other changes in liabilities | 543 | 16,354 | -4,794 | -18,044 | |
| Closing net worth | 19,919 | -14,242 | -47,232 | -77,283 | |
| General Government Debt (GGDebt) | |||||
| Debt instrument liabilities at market value | 107,816 | 132,639 | 161,089 | 201,105 | |
| + Difference between face value and market value | -3,272 | 11,525 | 8,137 | -8,644 | |
| Gross General Government Debt (face value) | 104,544 | 144,164 | 169,226 | 192,461 | |
| less EDP debt instrument assets | -41,950 | -32,908 | -30,839 | -40,088 | |
| Net General Government Debt (face value) | 62,594 | 111,256 | 138,387 | 152,373 | |
| Table 3 General Government: detailed classification of revenue | |||||
| €million | |||||
| Description | ESA code | 2009 | 2010 | 2011 | 2012 |
| Total Revenue | 56,020 | 55,120 | 55,414 | 56,594 | |
| Taxes and social contributions | 47,910 | 46,318 | 47,877 | 49,202 | |
| Taxes | D.2 + D.5 + D.91 | 35,924 | 34,843 | 37,626 | 39,694 |
| Indirect taxes (taxes on production and imports) | D.2 | 18,275 | 17,926 | 17,682 | 18,032 |
| Taxes on products | D.21 | 16,086 | 15,661 | 15,437 | 15,713 |
| Other taxes on production | D.29 | 2,188 | 2,264 | 2,244 | 2,319 |
| Direct taxes (current taxes on income, wealth, etc.) | D.5 | 17,393 | 16,680 | 19,237 | 20,903 |
| Capital taxes | D.91 | 256 | 237 | 707 | 759 |
| Social contributions | D.61 | 11,986 | 11,475 | 10,251 | 9,508 |
| Actual social contributions | D.611 | 9,333 | 9,084 | 7,918 | 7,172 |
| Imputed social contributions | D.612 | 2,653 | 2,391 | 2,333 | 2,335 |
| Sales of goods and services | 4,543 | 5,241 | 5,086 | 4,868 | |
| Investment income | 1,985 | 2,113 | 2,000 | 2,256 | |
| Interest (excluding FISIM) | 981 | 853 | 920 | 896 | |
| Dividends | 1,004 | 1,260 | 1,081 | 1,360 | |
| Current transfer revenue | 151 | 126 | 65 | 65 | |
| Subsidies | 0 | 0 | 0 | 0 | |
| Other current transfers | P.11 + P.12 + P.131 | 151 | 126 | 65 | 65 |
| Capital transfer revenue | P.11 | 1,431 | 1,323 | 386 | 203 |
| Table 4 General Government: detailed classification of expenditure | |||||
| €million | |||||
| Description | ESA code | 2009 | 2010 | 2011 | 2012 |
| Total Expenditure | 78,384 | 103,404 | 76,548 | 68,833 | |
| Expense | 74,936 | 100,553 | 74,922 | 68,447 | |
| Compensation of employees | D1 | 20,705 | 19,284 | 19,113 | 18,784 |
| Of which: Related to production of own-use capital assets | 0 | 0 | 0 | 0 | |
| Use of goods and services plus taxes payable | P2 + D5 + D29 | 10,363 | 9,347 | 8,892 | 8,564 |
| Use of goods and services [Intermediate consumption] | P2 | 10,363 | 9,347 | 8,891 | 8,563 |
| Of which: Intermediate consumption of market establishments | |||||
| Taxes, payable | D29 + D5 | 0 | 1 | 1 | 1 |
| Depreciation (Consumption of fixed capital) | K1 | 2,636 | 2,575 | 2,517 | 2,313 |
| Interest (excluding FISIM) | D41 | 3,290 | 4,984 | 5,190 | 5,912 |
| Subsidies | D3 | 893 | 879 | 639 | 639 |
| Product subsidies | D31 | 347 | 347 | 347 | 345 |
| Other subsidies on production | D39 | 546 | 533 | 293 | 295 |
| Social benefits | D62 + D631 | 28,344 | 28,181 | 28,768 | 28,666 |
| Social benefits in cash | D62 | 24,591 | 24,320 | 24,956 | 24,606 |
| Social benefits in kind (via market producers) | D631 | 3,753 | 3,861 | 3,812 | 4,060 |
| Other current transfers | D7 | 3,089 | 2,439 | 2,323 | 2,251 |
| Capital transfers | D9 | 5,617 | 32,864 | 7,478 | 1,317 |
| Net acquisition of non-financial assets | P5 + NP - K1 | 3,448 | 2,851 | 1,627 | 387 |
| = Gross investment in non-financial assets | P5 + NP | 6,084 | 5,425 | 4,144 | 2,700 |
| Gross fixed capital formation | P51 | 6,085 | 5,506 | 4,033 | 3,348 |
| Net acquisition of stocks | P52 | -1 | -80 | 111 | 83 |
| Net acquisition of unproduced assets | K2 | 0 | 0 | 0 | -732 |
| - Consumption of fixed capital | K1 | -2,636 | -2,575 | -2,517 | -2,313 |
| Table 5 General Government financial transactions | |||||
| €million | |||||
| Description | ESA code | 2009 | 2010 | 2011 | 2012 |
| Net lending (+) / net borrowing (-) | B.9 | -22,363 | -48,284 | -21,134 | -12,240 |
| equals | |||||
| Net acquisition of financial assets | 3,109 | -7,614 | 3,121 | 10,337 | |
| EDP debt instruments | F2 + F33 + F4 | 5,044 | -8,872 | -681 | 8,605 |
| Currency and deposits | F2 | 789 | -11,052 | -389 | 5,494 |
| Securities other than shares, excluding financial derivatives | F33 | 4,124 | 1,858 | -1,336 | 1,118 |
| Short-term | F331 | 44 | -36 | -36 | 1,034 |
| Long-term | F332 | 4,080 | 1,894 | -1,300 | 84 |
| Loans | F4 | 131 | 322 | 1,044 | 1,993 |
| Short-term loans | F41 | 0 | 0 | 885 | 1,408 |
| Long-term loans | F42 | 131 | 322 | 159 | 585 |
| Shares and other equity | F5 | -2,357 | 1,430 | 3,583 | 1,815 |
| Other financial assets | F34 + F61 + F62 + F7 | 422 | -172 | 219 | -83 |
| Financial derivatives | F34 | 16 | 254 | -271 | 0 |
| Insurance: reserves and premium prepayments | F61 + F62 | ||||
| Net equity of households in life insurance reserves and in pension funds reserves | F61 | 0 | 0 | 0 | 0 |
| Prepay. of ins. premiums and reserves for outstanding claims | F62 | 1 | 0 | 0 | -1 |
| Other accounts receivable/payable | F7 | 406 | -426 | 490 | -83 |
| less | |||||
| Net incurrence of liabilities | 25,472 | 40,670 | 24,255 | 22,577 | |
| EDP debt instruments | F2 + F33 + F4 | 26,064 | 41,199 | 24,428 | 22,692 |
| Currency and deposits | F2 | 1,464 | 3,402 | 1,507 | 2,258 |
| Securities other than shares, excluding financial derivatives | F33 | 24,642 | 6,186 | -9,355 | 238 |
| Short-term | F331 | -4,889 | -13,122 | -3,370 | -1,246 |
| Long-term | F332 | 29,531 | 19,308 | -5,985 | 1,484 |
| Loans | F4 | -42 | 31,611 | 32,276 | 20,196 |
| Short-term loans | F41 | 238 | 58 | -164 | 1,305 |
| Long-term loans | F42 | -280 | 31,553 | 32,440 | 18,891 |
| Other liabilities | F34 + F5 + F61 + F62 + F7 | -592 | -529 | -173 | -115 |
| Financial derivatives | F34 | 0 | 0 | 3 | 0 |
| Shares and other equity | F5 | 0 | 0 | 0 | 0 |
| Insurance: reserves and premium prepayments | F61 + F62 | 0 | 0 | 0 | 1 |
| Net equity of households in life insurance reserves and in pension funds reserves | F61 | 0 | 0 | 0 | 1 |
| Prepay. of ins. premiums and reserves for outstanding claims | F62 | 0 | 0 | 0 | 0 |
| Other accounts receivable/payable | F7 | -592 | -529 | -176 | -116 |
| Table 6 General Government: detailed breakdown of net worth | |||||
| €million | |||||
| Description | ESA code | 2009 | 2010 | 2011 | 2012 |
| General Government balance sheet | |||||
| Net worth at market value, excluding pension liabilities | 19,919 | -14,242 | -47,232 | -77,283 | |
| equals | |||||
| Non-financial assets at market value | 61,020 | 58,425 | 57,148 | 57,535 | |
| plus | |||||
| Financial net worth at market value, excluding pension liabilities | -41,101 | -72,667 | -104,380 | -134,818 | |
| equals | |||||
| Financial assets at market value | 72,657 | 65,407 | 62,743 | 72,926 | |
| EDP debt instruments | F2 + F33 + F4 | 41,950 | 32,908 | 30,839 | 40,088 |
| Currency and deposits | F2 | 29,919 | 19,126 | 18,753 | 24,246 |
| Securities other than shares, excluding financial derivatives | F33 | 8,700 | 10,114 | 7,334 | 9,097 |
| Short-term | F331 | 85 | 49 | 13 | 1,046 |
| Long-term | F332 | 8,615 | 10,065 | 7,321 | 8,051 |
| Loans | F4 | 3,331 | 3,668 | 4,752 | 6,745 |
| Short-term loans | F41 | 0 | 0 | 885 | 2,293 |
| Long-term loans | F42 | 3,331 | 3,668 | 3,867 | 4,452 |
| Shares and other equity | F5 | 21,712 | 23,750 | 22,581 | 23,895 |
| Other financial assets | F34 + F61 + F62 + F7 | 8,995 | 8,749 | 9,323 | 8,943 |
| Financial derivatives | F34 | 410 | 606 | 704 | 642 |
| Insurance: reserves and premium prepayments | F61 + F62 | ||||
| Net equity of households in life insurance reserves and in pension funds reserves | F61 | 0 | 0 | 0 | 0 |
| Prepayment of insurance premiums and reserves for outstanding claims | F62 | 1 | 1 | 1 | 0 |
| Other accounts receivable/payable | F7 | 8,585 | 8,143 | 8,619 | 8,301 |
| less | |||||
| Liabilities at market value | 113,758 | 138,074 | 167,123 | 207,744 | |
| EDP debt instruments | F2 + F33 + F4 | 107,816 | 132,639 | 161,089 | 201,105 |
| Currency and deposits | F2 | 10,308 | 13,711 | 15,218 | 17,477 |
| Securities other than shares, excluding financial derivatives | F33 | 94,643 | 84,017 | 79,657 | 96,527 |
| Short-term | F331 | 20,439 | 7,200 | 3,778 | 2,542 |
| Long-term | F332 | 74,204 | 76,817 | 75,879 | 93,985 |
| Loans | F4 | 2,865 | 34,911 | 66,214 | 87,101 |
| Short-term loans | F41 | 706 | 732 | 571 | 1,901 |
| Long-term loans | F42 | 2,159 | 34,179 | 65,643 | 85,200 |
| Other liabilities | F34 + F61 + F62 + F7 | 5,942 | 5,435 | 6,034 | 6,639 |
| Financial derivatives | F34 | 16 | 38 | 813 | 1,572 |
| Shares and other equity | F5 | 0 | 0 | 0 | 0 |
| Insurance: reserves and premium prepayments | F61 + F62 | 0 | 0 | 0 | 1 |
| Net equity of households in life insurance reserves and in pension funds reserves | F61 | 0 | 0 | 0 | 1 |
| Prepay. of ins. premiums and reserves for outstanding claims | F62 | 0 | 0 | 0 | 0 |
| Other accounts receivable/payable | F7 | 5,926 | 5,397 | 5,221 | 5,066 |
| Memo: Estimated pension liabilities of government | 116,000 | 116,000 | 116,000 | 116,000 | |
| Memo: Net worth, including pension liabilities | -96,081 | -130,242 | -163,232 | -193,283 | |
| Contingent liabilities | 286,263 | 162,076 | 147,241 | 119,306 | |
| Guarantees | 281,321 | 157,027 | 142,192 | 114,257 | |
| Off-balance sheet PPPs | 4,942 | 5,049 | 5,049 | 5,049 | |
| Memo: Net worth, including pension liabilities and contingent liabilities | -382,344 | -292,318 | -310,473 | -312,589 | |
| Change in net worth of government | |||||
| Opening net worth | 46,683 | 19,919 | -14,242 | -47,232 | |
| Change in net worth due to transactions | -18,915 | -45,433 | -19,508 | -11,853 | |
| Net acquisition of non-financial assets | 3,448 | 2,851 | 1,627 | 387 | |
| Net lending/net borrowing | -22,363 | -48,284 | -21,134 | -12,240 | |
| = Net acquisition of financial assets | 3,109 | -7,614 | 3,121 | 10,337 | |
| - Net incurrence of liabilities | -25,472 | -40,670 | -24,255 | -22,577 | |
| Change in net worth due to other economic flows | -7,849 | 11,273 | -13,483 | -18,198 | |
| Other changes in non-financial assets | -11,725 | -5,445 | -2,904 | 0 | |
| Other changes in financial net worth | 3,876 | 16,718 | -10,579 | -18,198 | |
| = Other changes in financial assets | 3,333 | 364 | -5,785 | -154 | |
| EDP debt instruments | 5 | -170 | -1,388 | 644 | |
| Shares and other equity | 3,221 | 608 | -4,752 | -501 | |
| Other financial assets | 107 | -74 | 355 | -297 | |
| - Other changes in liabilities | 543 | 16,354 | -4,794 | -18,044 | |
| EDP debt instruments | 531 | 16,376 | -4,022 | -17,324 | |
| Other liabilities | 12 | -22 | -772 | -720 | |
| Closing net worth | 19,919 | -14,242 | -47,232 | -77,283 |
| Table 7 General Government Gross and Net Debt | |||||
| €million | |||||
| Description | ESA code | 2009 | 2010 | 2011 | 2012 |
| General Government Debt | |||||
| Debt instrument liabilities at market value | 107,816 | 132,639 | 161,089 | 201,105 | |
| + Difference between face value and market value | -3,272 | 11,525 | 8,137 | -8,644 | |
| Gross General Government Debt (face value) | 104,544 | 144,164 | 169,226 | 192,461 | |
| By category: | |||||
| Currency and deposits | F2 | 10,307 | 13,707 | 15,216 | 17,477 |
| Securities other than shares, exc. financial derivatives | F33 | 91,391 | 96,317 | 88,550 | 89,289 |
| Short-term | F331 | 20,443 | 7,203 | 3,777 | 2,535 |
| Long-term | F332 | 70,948 | 89,114 | 84,773 | 86,754 |
| Loans | F4 | 2,845 | 34,140 | 65,459 | 85,695 |
| Short-term | F41 | 707 | 735 | 574 | 1,901 |
| Long-term | F42 | 2,138 | 33,405 | 64,886 | 83,793 |
| less EDP debt instrument assets | 41,950 | 32,908 | 30,839 | 40,088 | |
| By category: | |||||
| Currency and deposits | F2 | 29,919 | 19,126 | 18,753 | 24,246 |
| Securities other than shares, exc. financial derivatives | F33 | 8,700 | 10,114 | 7,334 | 9,097 |
| Short-term | F331 | 85 | 49 | 13 | 1,046 |
| Long-term | F332 | 8,615 | 10,065 | 7,321 | 8,051 |
| Loans | F4 | 3,331 | 3,668 | 4,752 | 6,745 |
| Short-term | F41 | 0 | 0 | 885 | 2,293 |
| Long-term | F42 | 3,331 | 3,668 | 3,867 | 4,452 |
| Net General Government Debt (face value) | 62,594 | 111,256 | 138,387 | 152,373 | |
| By category: | |||||
| Currency and deposits | F2 | -19,612 | -5,419 | -3,537 | -6,769 |
| Securities other than shares, exc. financial derivatives | F33 | 82,691 | 86,203 | 81,216 | 80,192 |
| Short-term | F331 | 20,358 | 7,154 | 3,764 | 1,489 |
| Long-term | F332 | 62,333 | 79,049 | 77,452 | 78,703 |
| Loans | F4 | -486 | 30,472 | 60,707 | 78,950 |
| Short-term | F41 | 707 | 735 | -311 | -392 |
| Long-term | F42 | -1,193 | 29,737 | 61,019 | 79,341 |
| Memo: Cumulative impact on gross debt of banking crisis interventions | 6,177 | 38,203 | 45,568 | 46,215 | |
| Memo: Gross debt excluding cumulative impact of banking crisis interventions | 98,367 | 105,961 | 123,658 | 146,246 | |
| Memo: Cumulative impact on EDP debt instrument assets of banking crisis interventions | 4,767 | 1,606 | -674 | -674 | |
| Memo: Net debt excluding cumulative impact of banking crisis interventions | 93,600 | 104,355 | 124,332 | 146,920 |
| Table 8 Reconciliation of Exchequer Balance to General Government Deficit | ||||||
| € million | ||||||
| Description | 2009 | 2010 | 2011 | 2012 | ||
| Exchequer balance | -24,641 | -18,745 | -24,917 | -14,891 | ||
| Deduct cash inflows which do not increase financial net worth | 0 | -379 | -59 | -2 | ||
| Inflows from sale or redemption of financial assets | 0 | -379 | -59 | -2 | ||
| Incurrence of Exchequer liability to Central Bank for notes and coins | 0 | 0 | 0 | 0 | ||
| Exclude cash outflows which do not reduce financial net worth | 31 | 650 | 7,327 | 2,321 | ||
| Acquisition of financial assets | 1 | 642 | 4,810 | 2,282 | ||
| Repayment of promissory notes notional loan principal | 0 | 0 | 2,517 | 12 | ||
| Redemption of Exchequer liability to Central Bank for notes and coins | 30 | 9 | 0 | 27 | ||
| Impact on financial net worth of Exchequer cash transactions | -24,610 | -18,474 | -17,648 | -12,572 | ||
| Adjust for impact of non-cash revenue and non-financial asset disposals (+) | -128 | -169 | 642 | 92 | ||
| Accrual of tax revenue (PAYE, USC, VAT, Excise and Corporation Tax) | -265 | 2 | 470 | -125 | ||
| Receipts due from EU (Agriculture grants, Cohesion Fund, ESF and ERDF) | 129 | -162 | 36 | -65 | ||
| Accrual of interest due on contingent capital assets assigned to banks | 0 | 0 | 128 | 0 | ||
| Sale of mobile telephony licences | 8 | -9 | 8 | 282 | ||
| Adjust for impact of non-cash expenditure (-) | 62 | -31,844 | 17 | -492 | ||
| Capital transfer to financial institutions financed by promissory notes | 0 | -30,850 | 0 | 0 | ||
| Difference between interest paid and accrued | -229 | -1,326 | -38 | -447 | ||
| Farm Waste Management Scheme | 293 | 298 | 33 | 0 | ||
| Accrual of expenditure relating to EU transfers (FEOGA, Cohesion Fund, ESF and ERDF) | -16 | -1 | -13 | -43 | ||
| Prepayments for military equipment | 14 | 34 | 35 | 0 | ||
| Carbon credits | 0 | 0 | 0 | -2 | ||
| EDP Net lending (+) / net borrowing (-) of Exchequer | -24,677 | -50,487 | -16,989 | -12,972 | ||
| Net lending (+) / net borrowing (-) of departments, offices, extra-budgetary bodies, funds and accounts consolidated with Exchequer | 158 | 645 | 107 | 239 | ||
| Post Office Savings Bank Fund | 10 | -6 | 111 | -20 | ||
| Small Savings Reserve Fund | -243 | 0 | 0 | 0 | ||
| Capital Services Redemption Account | 0 | 600 | -600 | 0 | ||
| Bank Guarantee Scheme receipts - special account | 439 | -259 | -3 | -67 | ||
| Dormant Accounts Fund | -39 | -22 | -9 | -5 | ||
| Other Extra-Budgetary Funds | 45 | -56 | 356 | 238 | ||
| Health Service Executive | 171 | 167 | 155 | 156 | ||
| Difference between Exchequer cash issues and accrued net spending of other departments and offices | -225 | 222 | 97 | -63 | ||
| EDP Net lending (+) / net borrowing (-) of Budgetary Central Government | -24,520 | -49,842 | -16,883 | -12,732 | ||
| Net lending (+) / net borrowing (-) of other Central Government bodies | 4,678 | 2,387 | -4,393 | 299 | ||
| National Pensions Reserve Fund | 4,433 | 2,116 | -4,373 | 334 | ||
| Non-market State corporations and agencies | 218 | 269 | -6 | -21 | ||
| Voluntary and joint board hospitals | 28 | 2 | -14 | -13 | ||
| EDP Net lending (+) / net borrowing (-) of Central Government (S.1311) | -19,841 | -47,454 | -21,276 | -12,433 | ||
| EDP Net lending (+) / net borrowing (-) of Social Insurance Fund (S.1311) | -2,483 | -915 | -8 | 19 | ||
| EDP Net lending (+) / net borrowing (-) of Local Government (S.1313) | -43 | 95 | 16 | -47 | ||
| EDP Net lending (+) / net borrowing (-) of General Government (S.13) (=GGDeficit) | -22,368 | -48,274 | -21,268 | -12,461 |
| Table 9 Reconciliation of National Debt to General Government Debt | ||||
| € million | ||||
| Description | 2009 | 2010 | 2011 | 2012 |
| Audited National Debt | 75,152 | 93,445 | 119,082 | 137,631 |
| Composed of | ||||
| Gross National Debt | 96,968 | 109,609 | 136,774 | 161,481 |
| Medium/long term debt | 71,528 | 90,775 | 120,612 | 144,524 |
| Irish Government Bonds | 71,075 | 90,704 | 85,912 | 88,455 |
| EU/IMF Programme Funding | 0 | 0 | 34,629 | 52,905 |
| EIB and bilateral loans | 0 | 0 | 0 | 3,071 |
| Miscellaneous | 453 | 71 | 71 | 93 |
| Short term debt | 18,044 | 8,496 | 4,616 | 3,479 |
| Commercial Paper | 16,261 | 6,972 | 2,920 | 1,299 |
| Treasury Bills | 0 | 0 | 0 | 1,014 |
| Borrowings from Funds under the control of the Minister for Finance | 1,783 | 1,524 | 1,696 | 789 |
| Miscellaneous | ||||
| State Savings Schemes | 7,396 | 10,338 | 11,546 | 13,478 |
| less | ||||
| Liquid assets | -21,816 | -16,164 | -17,692 | -23,850 |
| Reverse deduction of liquid assets and EFSF prepaid margin held by Exchequer | 21,816 | 16,164 | 18,222 | 24,380 |
| Outstanding principal value of promissory notes | 0 | 30,850 | 28,333 | 25,261 |
| Liability for coinage in circulation | 674 | 673 | 694 | 670 |
| Accrual adjustments (Small Savings Reserve Fund) | 346 | 368 | 464 | 560 |
| Adjustment from discounted to nominal value | 55 | 72 | 4 | 6 |
| Gross treatment of collaterals | 0 | 11 | 170 | 1,431 |
| Other adjustments (repurchase agreements and OPW contracts) | 14 | -19 | -16 | 9 |
| Unconsolidated Exchequer Debt (Maastricht definition) | 98,057 | 141,564 | 166,952 | 189,949 |
| of which: Liabilities to other Central Government bodies | 2,394 | 2,440 | 2,615 | 2,305 |
| Exchequer contribution to Central Government debt | 95,663 | 139,124 | 164,337 | 187,644 |
| of which: Liabilities to Local Government (Local Authorities and VECs) | 19 | 32 | 19 | 30 |
| Exchequer contribution to General Government debt | 95,644 | 139,092 | 164,319 | 187,614 |
| Housing Finance Agency (HFA) | ||||
| Gross debt of HFA | 4,941 | 4,512 | 4,414 | 4,501 |
| of which: Liabilities to other Central Government bodies | 30 | 3,612 | 3,851 | 3,987 |
| HFA contribution to Central Government debt | 4,911 | 900 | 563 | 514 |
| of which: Liabilities to Local Authorities | 182 | 220 | 179 | 179 |
| HFA contribution to General Government debt | 4,729 | 679 | 384 | 335 |
| Other Central Government | ||||
| Liabilities of Post Office Savings Bank Fund to Post Office Savings Bank | 1,892 | 2,330 | 2,512 | 2,770 |
| Health Service Executive and Voluntary Hospitals | 187 | 146 | 151 | 155 |
| National Oil Reserves Agency | 444 | 336 | 321 | 139 |
| Irish Rail | 128 | 29 | 17 | 0 |
| Westlink buyout: imputed loan from National Toll Roads to National Roads Authority | 510 | 460 | 410 | 360 |
| All other bodies | 36 | 33 | 80 | 200 |
| Other bodies' contribution to Central and General Government debt | 3197 | 3333 | 3490 | 3623 |
| Total Central Government debt | 103,771 | 143,357 | 168,391 | 191,781 |
| of which: Liabilities to Local Government | 201 | 252 | 197 | 208 |
| Central Government contribution to General Government debt | 103,570 | 143,104 | 168,193 | 191,572 |
| Local Government - Local Authorities | ||||
| Borrowing from Housing Finance Agency | 4,583 | 4,449 | 4,358 | 4,439 |
| Borrowing from other Central Government bodies | 104 | 109 | 58 | 30 |
| Other borrowing | 955 | 1,040 | 1,033 | 889 |
| Local Authorities' contribution to Local Government debt | 5,641 | 5,598 | 5,448 | 5,358 |
| VECs and Institutes of Technology | 19 | 19 | 0 | 0 |
| Total Local Government debt | 5,660 | 5,617 | 5,448 | 5,358 |
| of which: Liabilities to Central Government | 4,686 | 4,558 | 4,416 | 4,469 |
| Local Government contribution to General Government debt | 974 | 1,060 | 1,033 | 889 |
| General Government Debt | 104,544 | 144,164 | 169,226 | 192,461 |
Introduction
This release is the first in a new series being published by the Central Statistics Office. It coincides with the release of EU wide General Government Debt and Deficit figures by Eurostat as reported under the Excessive Deficit Procedure (EDP) at end March 2013. Up to 2012, the EDP returns for Ireland had been prepared and transmitted to Eurostat by the Department of Finance with input from the CSO. From 2013 the CSO have assumed responsibility for the historic components of this return, in addition to the existing Government Finance Statistics reporting already undertaken by the Office to Eurostat. The Department of Finance retain responsibility for the preparation of the current year forecasts included in the EDP return.
Government Finance Statistics – Concepts and Definitions
Government Finance Statistics (GFS) form the basis for fiscal monitoring in Europe, in particular in relation to the Excessive Deficit Procedure (EDP).
European GFS, including EDP statistics are produced according to the legally binding accounting rules of the European System of Accounts 1995 (ESA95). The Manual on Government Debt and Deficit (MGDD) provides further guidance on the implementation of ESA95 in the context of GFS.
The ESA95 regulation sets out both a methodology for the compilation of National Accounts and a programme of transmission of key economic aggregates which are a subset of the full set of accounts set out in ESA95. In relation to GFS aggregates of interest include: general government revenue and expenditure, general government surplus/deficit, general government consolidated gross debt and their main components.
EU Member States are required to report government deficit/surplus and debt data biannually under the EDP (before 1 April and 1 October in year N) for years N-4 to N-1 calendar years as well as a forecast for the current year. The data are reported in harmonised tables, which provide a consistent framework for the presentation of this data by Member States. The tables provide a structure for linking national budgetary aggregates with government deficit and debt.
Detailed statistics on Government revenue and expenditure are also provided to Eurostat under the ESA95 transmission programme. For annual data the main tables reported are:
Table 0200 Main aggregates of general government,
Table 0900 Detailed tax receipts by sector
Table 1100 General government expenditure by function.
Total general government expenditure and revenue are defined according to Commission Regulation (EC) No 1500/2000 of 10 July 2000 on general government expenditure and revenue. They comprise specific categories of ESA95.
Definition of general government and its subsectors
The general government sector of the economy, is defined in ESA95, paragraph 2.68: 'All institutional units which are other non-market producers [institutional units whose sales do not cover more than the 50% of the production costs, see ESA95 paragraph 3.26] whose output is intended for individual and collective consumption, and mainly financed by compulsory payments made by units belonging to other sectors, and/or all institutional units principally engaged in the redistribution of national income and wealth. General government comprises the sub-sectors central government (S.1311), state government (S.1312 - where applicable), local government (S.1313), and social security funds (S.1314).
As part of the GFS production process CSO is required to define the General Government and public sectors for Ireland. In this context, the public sector includes all bodies that are directly or indirectly controlled by a Government department or office, or by a local authority. General Government, in turn, includes all public sector bodies that are also mainly financed by Government bodies. The decision rules governing the classification of bodies to the public and General Government sectors are set out in detail in the Manual on Government Deficit and Debt. A detailed explanation of the application of these rules and the most up-to-date list of public sector and (including general government bodies) for Ireland are shown at
http://www.cso.ie/en/surveysandmethodology/nationalaccounts/.
General Government Deficit/Surplus (GG Deficit) is the standard European measure of the fiscal balance, which is used to monitor compliance with the Stability and Growth Pact. It is the difference between the revenue and the expenditure of the general government sector. The government deficit data related to the EDP (EDP B.9) differs from the deficit according to ESA95 (B.9) in the treatment of interest relating to swaps and forward rate agreements.
General Government Debt (GG Debt) is defined in the EU regulations implementing the Maastricht Treaty as the gross debt liabilities of the consolidated General Government sector, at nominal value.
‘Gross’ means that the value of any financial assets held by General Government cannot be deducted from the GG Debt. In Ireland’s case, this means that the liquid assets which are deducted from the ‘gross’ National Debt in arriving at the audited National Debt cannot be deducted from the GG Debt.
‘Debt liabilities’ are defined as the ESA categories AF.2 (Currency and deposits), AF.33 (Securities other than shares, excluding financial derivatives), and AF.4 (loans).
This definition excludes liabilities in derivatives (AF.34), equity liabilities (AF.5), pension and insurance liabilities (AF.6) and accounts payable (AF.7).
‘Consolidated’ means that any money owed by one entity within General Government to another is excluded from the total GG Debt.
‘Nominal value’ is defined in the governing regulation as face value. If debt is sold at a discount, it is the undiscounted value of the instrument, rather than the amount actually received, that is shown in the GG Debt. In other statistical contexts, ‘nominal value’ means face value plus any interest accrued but not paid; however, such interest is excluded from GG Debt by definition.
ESA95 codes and an explanation of each are shown below for the main components of Government revenue and expenditure as well as for types of financial flows. More detailed codes and technical definitions can be seen in the ESA95 manual available at http://circa.europa.eu/irc/dsis/nfaccount/info/data/esa95/en/esa95en.htm.
Main Components of General Government Expenditure and Revenue
P.2 Intermediate consumption – value of goods and services used in the process of production, excluding fixed assets
P.5 Gross capital formation
P.51 Gross fixed capital formation - acquisitions, less disposals, of fixed assets during a given period
plus certain additions to the value of non-produced assets realised by productive activity.
Fixed assets are tangible or intangible assets produced as outputs from processes of production
that are themselves used repeatedly, or continuously, in processes of production for more than one
year
P.52 Changes in inventories
P.53 Acquisitions less disposals of valuables
D.1 Compensation of employees – the total remuneration of government employees
D.11 Wages and salaries, in cash and in kind
D.12 Employers social contributions – actual (D.121) and imputed (D.122)
D.29 Other taxes on production (payable) all taxes that enterprises incur as a result of engaging in production, independently of the quantity or value of the goods and services produced or sold. These include taxes on use or ownership of land or buildings, taxes on use of fixed assets, taxes on total wage bill and payroll, taxes on international transactions related to production.
D.3 Subsidies (payable) - current unrequited payments which general government or the Institutions of the European Union make to resident producers, with the objective of influencing their levels of production, their prices or the remuneration of the factors of production
D.4 Property income (payable) - the income receivable by the owner of a financial asset or a tangible non-produced asset in return for providing funds to, or putting the tangible non-produced asset at the disposal of, another unit
D.41 Interest (payable) - excludes settlements under swaps and forward rate arrangements,
as these are treated as financial transactions in the ESA95
D.5 Current taxes on income, wealth, etc, (payable) - all compulsory, unrequited payments, in cash or in kind, levied periodically by general government and by the rest of the world on the income and wealth of units in the economy, and some periodic taxes which are assessed neither on income nor wealth
D.6 Social contributions - transfers to households, in cash or in kind, intended to relieve them from the financial burden of a number of risks or needs, made through collectively organised schemes, or outside such schemes by government and non-profit institutions. These include payments from general government to producers which individually benefit households and which are made in the context of social risks or needs
D.62 Social benefits in cash - social benefits and pensions paid in cash;
D.631 Social transfers in kind, via market producers - can be subdivided into those where beneficiary
households actually purchase the goods and services themselves and are then reimbursed, and those
where the relevant services are provided directly to the beneficiaries
D.7 Other current transfers
D.9 Capital transfers - involve the acquisition or disposal of an asset, or assets, by at least one of the parties to the transaction.
K.1 Consumption of fixed capital - the amount of fixed assets used up, during the period under consideration, as a result of normal wear and tear and foreseeable obsolescence, including a provision for losses of fixed assets as a result of accidental damage which can be insured against.
Categories of Financial Flows
F.1 Monetary gold and special drawing rights (SDRs)
F.11 Monetary gold
F.12 Special drawing rights (SDRs)
F.2 Currency and deposits
F.21 Currency
F.22 Transferable deposits
F.29 Other deposits
F.3 Securities other than shares
F.33 Securities other than shares, excluding financial derivatives
(F.331 - Short-term, F.332 - Long-term )
F.34 Financial derivatives
F.4 Loans
F.41 - Short-term,
F.42 - Long-term
F.5 Shares and other equity
F.51 Shares and other equity, excluding mutual funds shares
(F.511 - Quoted shares, F.512 - Unquoted shares, F.513 - Other equity )
F.52 Mutual funds shares
F.6 Insurance technical reserves
F.61 Net equity of households in life insurance reserves and in pension funds reserves
(F.611 - Net equity of households in life insurance reserves,
F.612 - Net equity of households in pension funds reserves,
F.62 - Prepayments of insurance premiums and reserves for outstanding claims
F.7 Other accounts receivable/payable
F.71 Trade credits and advances
F.79 Other
 Hide Background Notes
Scan the QR code below to view this release online or go to
http://www.cso.ie/en/releasesandpublications/er/gfsa/governmentfinancestatisticsapril2013/
 Show Table 1 General Government transactions: revenue, expenditure, financing and deficit
 Hide Table 1 General Government transactions: revenue, expenditure, financing and deficit